

Abstract
We present a comparison of respondent-driven sampling (RDS) and time-location sampling (TLS) for behavioral surveillance studies among men who have sex with men (MSM). In 2010, we conducted two simultaneous studies using TLS (N = 609) and RDS (N = 507) in Guatemala city. Differences in characteristics of the population reached based on weighted estimates as well as the time and cost of recruitment are presented. RDS MSM were marginally more likely to self-report as heterosexual, less likely to disclose sexual orientation to family members and more likely to report sex with women than TLS MSM. Although RDS MSM were less likely than TLS MSM to report ≥2 non-commercial male partners, they were more likely to report selling sex in the past 12 months. The cost per participant was $89 and $121 for RDS and TLS, respectively. Our results suggest that RDS reached a more hidden sub-population of non-gay-identifying MSM than TLS and had a lower implementation cost.
Keywords: HIV surveillance, MSM, RDS, TLS, Hidden populations
Introduction
Men who have sex with men (MSM) have been disproportionately affected by the HIV/AIDS epidemics in many parts of the world including Latin America [1]. In 2001, a multi-country cross-sectional study, the Estudio Multi-céntrico, estimated HIV prevalence among MSM in Guatemala city at 12 % and incidence at 2.1 per 100 person-years (n = 165) [2]. A more recent 2006 study estimated HIV prevalence among MSM at 18 % (n = 300) [3]. These two studies were non-probability samples, making inference regarding the MSM population questionable.
Accurate and precise data on the behaviors in this population at risk are critical for tracking the direction of the epidemic, planning effective responses, and monitoring and evaluating those responses. MSM are considered a difficult-to-reach or hidden population for disease surveillance: many do not self-identify as gay, homosexual or bisexual and study participation is complicated by high degrees of stigmatization [4]; there is no practical way of constructing a sampling frame to permit standard random sampling methods; and, as MSM constitute a relatively small proportion of the male population [5], sampling via population-based surveys is cost-prohibitive. The most commonly used non-probability approach to sampling MSM has been snowball sampling, which is thought to increase efficiency, identification, and inclusion of hidden populations by having members of the target population recruit other members [6]. However, the degree to which snowball samples represent the population is unknown because of biases inherent in peer-recruitment methods, including dependence on the choice of initial recruits [7].
The main approaches to probability-based sampling for surveillance of MSM include time-location sampling (TLS) and respondent-driven sampling (RDS). TLS seeks to approximate a probability sample by mapping the universe of venues frequented by members of the target population and the days and times when population members tend to be present. Individuals from a random sample of the enumerated time-venue units are then selected for recruitment into the study, by random selection or a “take-all” strategy in which all individuals present are invited to participate in the study [8, 9]. A limitation of TLS is that inference is limited to individuals who frequent venues. RDS attempts to overcome this limitation by recruiting members of hidden populations through their social networks. Unlike snowball sampling, RDS controls for peer-recruitment biases by limiting the number of recruits per participant and through statistical weighting to account for differences in self-reported network size—which is presumed to be related to selection probability—and associations on variables of interest among recruiters and recruits [10–12]. RDS analysis has been an area of active research, including assessments of the validity of variance estimates available for RDS and how they may be affected by violations of RDS’s theoretical assumptions [13–17]. In contrast, although TLS is based on standard survey theory, it has not benefited to the same degree from evaluations of performance of estimators in practice or diverse analytical approaches in current use [18].
Reviews of available methods for surveillance in hard-to-reach populations [19, 20] and more than 200 RDS studies in 36 countries [20–23] have concluded that RDS remains a promising and effective sampling method when appropriately designed and implemented. Venue-based approaches continue to be more common for surveillance of MSM in developed countries [24].
Of key interest is whether TLS and RDS reach qualitatively different populations in practice. Most comparisons of TLS and RDS to date have been based either on analyzing RDS samples stratified by variables of interest (e.g., venue-going and non-venue-going) [25–27], different recruitment methods applied during different periods [28], or have been limited by small sample size [29] and unweighted analyses [30]. Two previous studies compared RDS and TLS in real time [29, 31]. The first, among MSM in San Francisco, found that RDS was able to reach more hidden segments of the Black MSM population compared with TLS [29]. The second study, was conducted among female sex workers in China, and found higher syphilis prevalence among women recruited through TLS compared to RDS, but similar reports of risk behaviors.
We present a head-to-head comparison of separate RDS and TLS behavioral surveillance studies conducted simultaneously in Guatemala city, Guatemala. We examine differences in the population reached in terms of demographic and geographic characteristics, indicators of HIV risk behavior and access to HIV services. Finally, we compare the cost and time required to recruit the two MSM samples.
Materials and Methods
Sample and Study Design
Two cross-sectional surveys were conducted simultaneously among MSM in Guatemala city from July to December, 2011. The sample size of 500 for each strategy was estimated with a design effect of 2.0. Approval was obtained from the U.S. Centers for Disease Control and Prevention’s Global AIDS Program Associate Director for Science Office and the Del Valle University of Guatemala’s Ethics Committee Board.
Men could participate if they were at least 18 years of age, resided in Guatemala city at the time of interview, reported sex with a man in the past 12 months, and consented to participate in the study. Men could participate in either or both TLS and RDS surveys, but could not participate in either more than once. Individuals under the influence of alcohol or illicit drugs were not eligible to participate.
Prior to implementation, we conducted formative research to adapt study procedures to the Guatemalan setting, collect epidemiological information on MSM in Guatemala, raise community awareness, inform questionnaire development, and define appropriate incentives. Methods specific to each sampling method are described below.
RDS Methods
During formative research we determined whether social networks were strong enough to support the RDS methodology, identified RDS seeds, determined proper study site locations and hours of operation. Eight seeds were selected who were popular (i.e., having many network connections) and who were diverse with respect to age, ethnicity, level of education and residential location. The RDS survey was conducted at a health clinic operated by the non-governmental organization (NGO) Fundación Marco Antonio, which offers primary health care, HIV and STI testing and treatment services and was easily accessible by public transportation. Each of the seeds received 2 unique coupons to distribute to their peers. All men with a coupon were screened for eligibility, asked to provide written informed consent and completed a 20–25 min interviewer-administered questionnaire on a handheld-assisted personal interview (HAPI) instrument. Following the survey, participants received educational materials, a voucher for groceries equivalent to U.S. Dollars (USD) 6 and 2 recruitment coupons. Study staff explained to seeds and other participants how to recruit peers and how to return to collect a secondary incentive of USD 4 for each of a maximum of two successful referrals. This process was repeated until the sample size was achieved. The following questions were used to assess network size: How many transgender and MSM do you know, who know you and who live in this city? Of these, how many are 18 years of age or older? Of those, how many have you seen or spoken to in the past 30 days?
TLS Methods
We used TLS methodology that has been described in detail previously [9]. During formative research, we identified potential venues from local gay publications and lists developed during previous studies, through interviews and focus groups with key informants, and by conducting an online survey among MSM promoted by local sexual diversity NGO’s. Eligible venues identified included street locations, dance clubs, bars, businesses, community organizations, bathhouses, health clubs, Internet cafes, restaurants, shopping malls and parks. For logistical reasons, we constructed a sampling frame from the set of venues expected to yield at least 7 eligible men during an average 4-hour venue-day-time (VDT) sampling event.
Monthly, ~40 venues were randomly selected without replacement, 2 venues were selected with certainty (purposefully selected by study staff), and one VDT was selected for each venue. Replacement VDTs were randomly selected for each of the selected venues and used when sampling could not be conducted at the original venue (e.g., when the primary venue had closed). Venues that closed permanently or VDTs that consistently produced fewer than 7 eligible participants were deleted from the sampling frame. At the randomly selected VDT, interviewers approached participants systematically (i.e., every 5th person), provided information about the study, applied a written informed consent process, administered the questionnaire using a HAPI instrument and distributed educational materials and the USD 6 primary incentive. The number of men present at each VDT and limited data on men who refused to participate were also collected.
Cost Estimation
We used an ingredients-based costing approach to estimate the total cost per study and unit costs per participant for each sampling strategy [32]. Cost data were collected by project phase (i.e., planning and implementation) and by major cost category (i.e., equipment, materials and supplies, personnel, protocol development, rent and utilities and transport). The planning phase included start-up costs, which we defined as the cost of protocol development, formative research and mapping of venues. The implementation phase included project running costs. Personnel costs during each phase included the cost for local office and field staff and the cost for technical assistance by headquarters staff (using wage rates for U.S. staff adjusted for the number of hours worked). Technical assistance by headquarters staff included assistance with protocol development and approval, preparation of study questionnaire, piloting of questionnaire, preparation of standard operating procedures, development of the event calendar for TLS, troubleshooting during data collection, and statistical support during the sampling design and data analysis. All costs are presented in 2011 U.S. dollars. The estimated cost per participant was derived as the total study cost divided by the number of study participants.
Measures
During both studies, trained interviewers administered a standardized questionnaire using handheld computers. Variables to assess differences in population characteristics included socio-demographics, HIV risk behaviors and exposure to HIV testing and prevention services. Binge drinking was defined as drinking ≥5 alcoholic beverages at one sitting at least once in the past 30 days. Exchange sex was defined as having sex with someone in exchange for money or drugs. Consistent condom use was defined as always using condoms when having anal sex in the past 12 months with all sexual partners (i.e., main, casual and exchange). Concurrency of sexual partners was defined as overlapping sexual partnerships and was assessed based on question items regarding the starting and ending date of each of the last three partners during the past 12 months. HIV knowledge was assessed using the knowledge indicator developed by the Joint United Nations Programme on HIV/AIDS (UNAIDS) [33].
Data Analysis
We used the Respondent-Driven Sampling Analysis Tool version 6.0.1 (Cornell University, Ithaca, NY, USA) to adjust the RDS data for differences in network size and recruitment patterns. We examined the equilibrium of key variables and recruitment patterns by key demographic characteristics to identify potential biases associated with recruitment.
TLS survey data were weighted and analyzed using survey procedures in SAS 9.2 (SAS Institute Inc., Cary, NC, USA). Venues were treated as the primary sampling units (PSU). Sampling weights were calculated as the inverse of the product of a three-stage selection probabilities, in which the stages comprised sampling of venues, VDTs and participants, respectively. Replacement VDTs were assumed to have the same selection probabilities as the originally selected VDTs. Sampling weights were adjusted for non-response and for unequal selection probabilities of venue attendees [34]. Men attend venues with different frequencies, and this results in frequent visitors having a higher chance of being selected to participate in the study due to the multiple venues, days and times attended. The different patterns of attendance result in multiple routes of selection for certain individuals. To adjust for multiple routes of selection, the sampling weights were divided by the product of the fraction of the year that the study occurred (53 days/365.25 days) and the self-reported frequency with which participants attended venues. Self-reported frequency of venue attendance ranged from “never” to “daily”, where “never” was assigned a value of 1.0 (as the participant was present at a venue at the time of sampling), and “daily” was assigned a value of 365. To approximate the number of eligible MSM present at each VDT, the count of all males present at each recruitment event as recorded by study staff was multiplied by either (1) the relative proportion of eligible MSM at gay and mixed sites (a “mixed” site had both gay and non-gay attendees, such as a bar with 50 % gay attendees) or (2) the estimated proportion of MSM (roughly 3 %) in Guatemala city at public sites (e.g., malls and restaurants). Extreme weights were trimmed based on a method developed by Westat© [35].
Unpooled Z tests were used to test for differences between survey-adjusted RDS and TLS proportions, where the test was constructed as the difference between the two estimates divided by the square root of the sum of their variances. Chi square tests were used to test for differences for categorical variables with 3 or more levels. The Chi square tests were adjusted for the complex sampling designs by dividing the Chi square test statistics by the average of the design effects from RDS and TLS for the variable under investigation [36]. P values ≤0.05 were considered statistically significant and values between 0.05 and 0.10 were considered marginally statistically significant. We estimated the square root of the design effect (DEFT) as the ratio of the standard error of the adjusted estimate to the standard error under a simple random sample of the same sample size. The DEFT describes how much the sample standard error, and consequently the confidence intervals, increases compared to a simple random sample [37]. A comparison of the unweighted TLS and RDS-estimated proportions was not conducted since the purpose of this study was to evaluate differences in the MSM sub-populations reached by both sampling strategies and not in the samples themselves.
Maps showing the residential zone for participants were created with ArcGIS version 10.0 (ESRI, Redlands, CA, USA).
Results
RDS and TLS Recruitment
A total of 516 individuals were recruited by the RDS study. Of these, 9 were excluded because they did not report anal sex in the past 12 months, leaving a final sample of 507 for analysis. Among the eight seeds, the most productive resulted in 21 waves comprising 167 participants (Table 1). Of participants, 42 % recruited no peers, 17 % one, and 41 % two peers. For TLS, of 102 venues identified, 54 were deemed eligible and constituted the sampling frame, 82 sampling events were conducted and 69 sampling events yielded interviews, while 13 produced zero interviews. There were 2,901 men approached, 55 % (1,603) accepted the eligibility screening. Of these, 738 were eligible, 628 agreed to participate and 609 were interviewed. Of participants, 27 % were recruited at clubs, 22 % at street intercepts, 12 % at bars, 10 % at shopping malls, 10 % at NGOs, 9 % at restaurants, 7 % at saunas, 2 % at cyber cafes, and 1 % at a movie theater.
Table 1.
Number of referrals and waves per seed during respondent driven sampling recruitment among men who have sex with men in Guatemala city, 2010
| Seed ID | No. referrals (%) | Cumulative (%) | No. waves |
|---|---|---|---|
| 1 | 168 (33.3) | 33.3 | 21 |
| 2 | 146 (28.7) | 62.0 | 19 |
| 3 | 90 (17.8) | 79.8 | 12 |
| 4 | 51 (10.0) | 89.8 | 17 |
| 5 | 47 (9.2) | 99.0 | 8 |
| 6 | 3 (0.6) | 99.6 | 2 |
| 7 | 2 (0.4) | 100.0 | 2 |
| 8 | 0 (0) | 100.0 | 0 |
Demographics, Behaviors and Service Utilization
The median age of participants in the RDS study was 26 years (interquartile range [IQR]: 22–34 years) and the median network size was 15 MSM contacts seen in the past 30 days (IQR: 5–40). The median age of participants in the TLS study was 25 years (IQR: 22–30 years) and the median network size was 14 MSM (IQR: 5–30).
There was no difference in age, income or marital status. However, RDS MSM were less educated than TLS MSM, with 11 versus 27 % having some university education (P < 0.001) (Table 2). The proportion that identified as heterosexual was marginally higher in RDS than TLS (15 versus 5 %, P = 0.08). RDS MSM were less likely to disclose to family members that they were attracted to other men (45 versus 62 %, P = 0.01), more likely to report sex with a woman in the past 12 months (46 versus 27 %, P = 0.02) and marginally less likely to report consistent condom use with women than TLS MSM (45 versus 62 %, P = 0.07) (Table 3). Although RDS MSM were less likely to report more than 2 non-commercial male sex partners in the past 12 months (46 versus 60 %, P = 0.02), they were more likely to report selling sex (56 versus 35 %, P = 0.01) and concurrent sexual partnerships (62 versus 33 %, P < 0.001) in the past 12 months. There was no difference in consistent condom use with male partners (63 versus 67 %, P = 0.47) or using the Internet to meet sex partners (18 versus 20 %, P = 0.72).
Table 2.
Demographic characteristics of men who have sex with men recruited through respondent-driven sampling (RDS) and time-location sampling (TLS) in Guatemala city, 2010
| Variables | RDS adjusted | TLS adjusted | P value | ||||||||||
|---|---|---|---|---|---|---|---|---|---|---|---|---|---|
|
N = 507
|
N = 609
|
||||||||||||
| n | N | % | SE | 95 %CI | DEFT | n | N | % | SE | 95 % CI | DEFT | ||
| Age (in years) | |||||||||||||
| 18–24 | 196 | 499 | 38.9 | 3.70 | 30.8, 45.2 | 1.7 | 296 | 609 | 39.8 | 5.42 | 29.0, 50.6 | 2.7 | 0.19 |
| 25–34 | 191 | 499 | 37.4 | 3.50 | 30.8, 44.8 | 1.6 | 225 | 609 | 42.1 | 4.60 | 32.9, 51.3 | 2.3 | |
| 35+ | 112 | 499 | 23.8 | 3.50 | 17.7, 31.5 | 1.8 | 88 | 609 | 18.1 | 3.80 | 10.5, 25.7 | 2.4 | |
| Education | |||||||||||||
| ≤Primary or less | 108 | 499 | 29.9 | 4.01 | 21.9, 37.6 | 1.9 | 4 | 608 | 18.4 | 4.54 | 9.3, 27.4 | 2.9 | < 0.001 |
| ≤High school | 305 | 499 | 58.7 | 3.90 | 50.8, 66.2 | 1.8 | 50 | 608 | 55.1 | 3.87 | 47.4, 62.8 | 1.9 | |
| Some university | 86 | 499 | 11.3 | 2.40 | 7.6, 27.0 | 1.7 | 110 | 608 | 26.5 | 5.85 | 14.8, 38.2 | 3.3 | |
| Monthly income | |||||||||||||
| ≥275 USD | 236 | 475 | 37.0 | 3.72 | 29.9, 44.5 | 1.7 | 363 | 608 | 49.1 | 8.57 | 32.0, 66.3 | 4.2 | 0.19 |
| Sexual identity | |||||||||||||
| Heterosexual | 42 | 495 | 14.9 | 3.24 | 8.8, 21.5 | 2.0 | 19 | 609 | 4.5 | 3.57 | 0.0, 11.6 | 4.3 | 0.08 |
| Bisexual | 143 | 495 | 38.8 | 3.78 | 31.8, 46.6 | 1.7 | 188 | 609 | 38.4 | 5.50 | 27.4, 49.3 | 2.8 | |
| Gay | 209 | 495 | 37.4 | 3.83 | 29.8, 44.8 | 1.8 | 350 | 609 | 49.0 | 5.26 | 38.5, 59.5 | 2.6 | |
| Trans | 99 | 495 | 8.9 | 2.37 | 4.9, 14.2 | 1.9 | 52 | 609 | 8.2 | 4.64 | 0.0, 17.4 | 4.2 | |
| Marital status | |||||||||||||
| Single | 428 | 499 | 81.0 | 2.43 | 76.2, 85.7 | 1.4 | 531 | 609 | 86.4 | 5.62 | 75.2, 97.6 | 4.0 | 0.87 |
| Married/civil union | 67 | 499 | 18.6 | 2.61 | 13.5, 23.7 | 1.5 | 69 | 609 | 11.7 | 5.16 | 1.4, 22.1 | 4.0 | |
| Divorced/separated | 4 | 499 | 0.4 | 0.25 | 0.0, 0.9 | 0.9 | 9 | 609 | 1.9 | 1.45 | 0.0, 4.8 | 2.6 | |
Numbers may not add to totals because of missing data. SE standard error, CI confidence interval, DEFT design factor, Trans trangender or transexual
Table 3.
Behavioral characteristics of men who have sex with men recruited through respondent-driven sampling (RDS) and time-location sampling (TLS) in Guatemala city, 2010
| Variables | RDS adjusted N = 07
|
TLS adjusted N = 609
|
P value | ||||||||||
|---|---|---|---|---|---|---|---|---|---|---|---|---|---|
| n | N | % | SE | 95 %CI | DEFT | n | N | % | SE | 95 % CI | DEFT | ||
| Disclosure | |||||||||||||
| Disclosed to family same sex attraction | 297 | 498 | 44.6 | 3.70 | 37.5, 52.0 | 1.7 | 396 | 604 | 61.8 | 5.47 | 50.9, 72.8 | 2.8 | 0.01 |
| Past 12 months behaviors (unless otherwise noted) | |||||||||||||
| Sex w/women | 154 | 499 | 46.0 | 4.54 | 37.3, 55.1 | 2.0 | 131 | 608 | 27.1 | 6.78 | 13.6, 40.7 | 3.8 | 0.02 |
| Consistent condom use w/women | 76 | 154 | 45.4 | 5.56 | 35.0, 56.8 | 1.4 | 93 | 131 | 62.1 | 7.37 | 47.2, 77.0 | 1.7 | 0.07 |
| >2 male partners | 292 | 499 | 45.9 | 3.67 | 39.0, 53.4 | 1.6 | 417 | 609 | 60.3 | 5.16 | 50.0, 70.6 | 2.6 | 0.02 |
| Consistent condom for anal sex w/men | 290 | 476 | 62.7 | 3.88 | 55.4, 70.6 | 1.7 | 421 | 602 | 67.0 | 4.51 | 58.0, 76.0 | 2.4 | 0.47 |
| Sold sex | 285 | 499 | 55.6 | 4.46 | 46.9, 64.4 | 2.0 | 256 | 609 | 35.1 | 6.76 | 21.6, 48.6 | 3.5 | 0.01 |
| Participant had concurrent partners | 325 | 499 | 62.4 | 3.75 | 54.8, 69.5 | 1.7 | 211 | 609 | 32.7 | 6.52 | 19.7, 45.7 | 3.4 | <0.001 |
| Used the internet to meet sex partners, past 30 days | 102 | 499 | 18.3 | 2.58 | 13.5, 23.6 | 1.5 | 169 | 606 | 20.4 | 5.37 | 9.7, 31.2 | 3.3 | 0.72 |
| Drug use | 123 | 498 | 21.4 | 2.83 | 16.3, 27.4 | 1.5 | 155 | 603 | 20.9 | 5.06 | 10.8, 31.0 | 3.1 | 0.93 |
| Binge drinking | 244 | 499 | 48.8 | 3.80 | 41.8, 56.7 | 1.7 | 467 | 609 | 63.9 | 7.26 | 49.4, 78.4 | 3.7 | 0.07 |
| HIV status and services | |||||||||||||
| Self-reported HIV positive | 18 | 387 | 5.4 | 1.86 | 2.7, 10.0 | 1.6 | 8 | 494 | 4.5 | 2.98 | 0.0, 10.4 | 3.2 | 0.79 |
| Knows where to request HIV test | 434 | 499 | 79.5 | 3.39 | 72.4, 85.7 | 1.9 | 550 | 608 | 86.2 | 5.31 | 75.5, 96.8 | 3.8 | 0.29 |
| Ever had an HIV test | 401 | 499 | 71.8 | 3.83 | 64.2, 79.2 | 1.9 | 518 | 608 | 78.0 | 4.92 | 68.2, 87.8 | 2.9 | 0.32 |
| Had an HIV test past 12 months | 313 | 496 | 54.5 | 3.90 | 46.3, 61.6 | 1.7 | 415 | 606 | 62.3 | 5.15 | 52.0, 72.5 | 2.6 | 0.23 |
| Participated in HIV prevention past 12 months | 347 | 499 | 61.6 | 3.57 | 54.3, 68.3 | 1.6 | 341 | 609 | 44.3 | 4.65 | 35.0, 53.6 | 2.3 | 0.003 |
| Received services at a clinic or NGO in past 12 months | 417 | 499 | 73.7 | 3.49 | 66.8, 80.5 | 1.8 | 521 | 609 | 79.6 | 4.72 | 70.2, 89.0 | 2.9 | 0.32 |
| HIV knowledgea | 244 | 499 | 43.0 | 2.17 | 38.7, 47.2 | 1.0 | 251 | 609 | 36.9 | 8.03 | 20.9, 53.0 | 4.1 | 0.47 |
Numbers may not add to totals because of missing data. SE standard error, CI confidence interval, DEFT design factor
Answered all five items correctly: can a healthy-looking person have HIV; can a person get HIV from mosquito bites; can a person get HIV by sharing a meal with someone who is infected; can having sex with only one faithful, uninfected partner reduce the risk of HIV transmission; can using condoms reduce the risk of HIV transmission?
Injection drug use was low overall (<2 %) and there was no difference in non-injection drug use in the past 30-day (21 % for both studies). Past 30-day alcohol binge drinking was marginally lower in RDS than TLS (49 versus 64 %, P = 0.07). There was no difference in the estimated proportion of MSM ever tested for HIV (72 and 78 %), reporting an HIV test in the past 12 months (55 and 62 %) or receiving HIV or sexually transmitted infection services at a health clinic in the past 12 months (74 and 80 %). However, more RDS MSM had participated in an HIV prevention intervention in the past 12 months than TLS MSM (62 versus 44 %, P < 0.01). Self-reported HIV positivity (5 % for both) and levels of comprehensive HIV knowledge (43 and 37 %) were similar among RDS and TLS participants.
The mean DEFT in RDS was 1.7 (range 0.9–2.0) compared to 3.1 (range 1.7–4.3) in TLS. This means that confidence intervals were on average 1.7 times larger in RDS and 3.1 times larger in TLS as compared with a simple random sample. This suggests that the TLS study had a smaller effective sample size as compared with RDS. For example, for the age category 18–24 years the DEFT was 1.7 in RDS and 2.7 in TLS. For HIV testing in the past 12 months, it was 1.7 and 2.6, respectively.
Geographical Coverage
Figure 1a, b show the distribution of participants by zone of residence within Guatemala city. Together, RDS seeds resided in 4 of the 22 residential zones in Guatemala. For TLS, most venues were concentrated in the historic district (zone 1). TLS recruited participants from a broader geographic area. TLS resulted in participants who resided in all 22 of the city’s zones compared to 18 of the 22 zones for RDS.
Fig. 1.

Maps of study area showing residency of participants recruited through respondent-driven sampling (RDS) and time-location sampling (TLS) in Guatemala city, 2010. a Residency of participants and seeds and location of study site for RDS. b Residency of participants and location of venues for TLS
Cost and Logistics for RDS and TLS
Formative research was conducted in 4 weeks for RDS and 8 weeks for TLS. However, this difference was balanced out when the time to achieve sample size was included. Full recruitment was accomplished in a shorter time frame in TLS than in RDS, 8 and 11 weeks, respectively (Fig. 2).
Fig. 2.
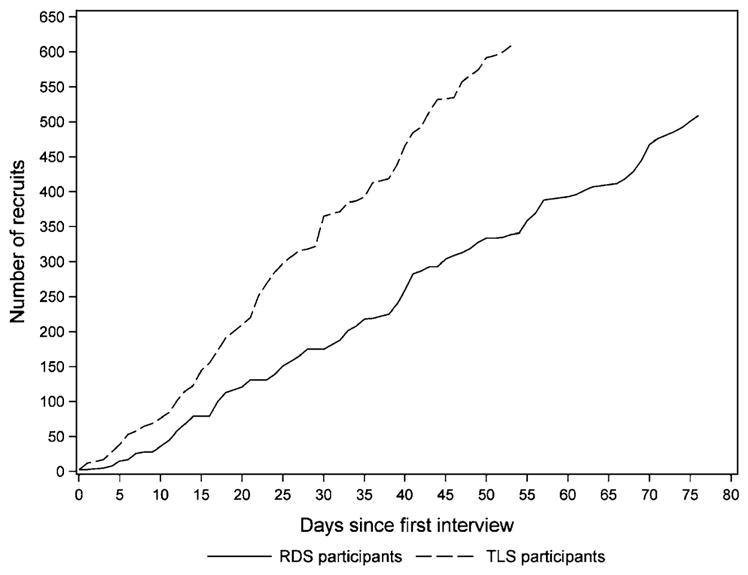
Cumulative number of participants over time for respondent-driven sampling (RDS) and time-location sampling (TLS) among men who have sex with men in Guatemala city, 2010
The cost for the RDS study was USD 44,876 (Table 4), 71 % of which was incurred during the implementation phase and 29 % during the planning phase. Personnel and materials and supplies accounted for the largest share of the study cost. The cost per participant for RDS was USD 89.
Table 4.
Survey costs to recruit men who have sex with men in Guatemala city using respondent-driven sampling (RDS) and time-location sampling (TLS), 2012
| Cost category | RDS
|
TLS
|
||
|---|---|---|---|---|
| Planning | Implementation | Planning | Implementation | |
| Equipment | – | $1,227 | – | $2,100 |
| Personnel | $6,401 | $15,767 | $19,563 | $23,134 |
| Protocol development | $6,608 | – | $6,608 | – |
| Recruitment and training | – | $613 | $438 | $488 |
| Rent and utilities | – | $1,170 | – | – |
| Materials/supplies | – | $7,435 | $645 | $4,989 |
| Transport | $75 | $5,580 | $7,478 | $8,063 |
| Total cost per phase | $13,084 | $31,792 | $34,732 | $38,774 |
| Total cost | $44,876 | $73,505 | ||
| Number of participants | 507 | 609 | ||
| Cost per participant | $89 | $121 | ||
Costs are reported in U.S. dollars
The cost for the TLS study was USD 73,505, distributed as 47 % during the planning phase and 53 % in the implementation phase. The largest share of total cost for TLS went towards personnel and transportation. Together these accounted for 80 % of the total. The cost per participant for TLS was USD 121.
Discussion
Our study found that population estimates obtained through RDS and TLS sampling were comparable with respect to age and income, but different for other important social and behavioral characteristics. RDS reached more hidden MSM, in terms of being less likely to be out about their sexuality. RDS MSM were also more likely to report sex with a woman, unprotected sex with women, recent sex work and concurrent partners. TLS MSM had a higher number of non-commercial partners and marginally higher binge drinking and were less likely to report participation in HIV prevention activities. Despite the concentration of MSM venues for TLS in one residential zone, TLS achieved a broader geographical coverage in terms of participants’ neighborhoods of residence.
Because RDS is driven by peer referral, it has been hypothesized that it can reach more hidden segments of the population. In our study, a higher proportion of RDS MSM self-identified as heterosexual and reported sex with women than TLS MSM. Sex work was commonly reported in both samples but was higher in RDS and could in part explain the higher estimated proportion of concurrence. We found higher coverage of prevention interventions among RDS MSM. Our choice of study site—a sexual diversity NGO offering HIV prevention and other primary health care services—may be in part responsible for the higher prevention coverage among RDS participants. However, this could also be explained by the challenges faced by prevention programs for MSM in Guatemala. Prevention interventions for MSM in Guatemala are mainly supported by the Global Fund and delivered at health facilities, community based organizations, streets, parks and venues [38]. It is commonly reported that gay venues such as saunas, dance clubs and bars do not provide permission to conduct outreach activities inside the venues.1
The large DEFT found for both studies should be considered when calculating sample sizes for future surveys. The DEFT reported in this study (estimated as the square root of the design effect) is equivalent to average design effects of approximately 3 in RDS and 10 in TLS. While there have been several assessments of design effects for RDS [39–43], design effects for TLS have rarely been reported [44]. A recent assessment suggests TLS design effects range from 1 to 10 [44]. Improvements in sampling design, for instance by combining the first two sampling stages (selection of locations and times) or selecting venues with probability proportional to size, could potentially reduce sampling variance and improve design effects [34]. Studies using RDS have reported design effects ranging from 2 to 4 [39–43]. However, a simulation study suggested the design effect for RDS may be greater than 20; while 95 % confidence intervals should contain the true population proportion 95 % of the time, the study found that standard RDS 95 % confidence intervals only contained the true population proportion about 50 % of the time [14]. Thus, the true design effects for RDS may be larger than estimated by current analytical methods and thus, larger than what we report in this study.
We found that the cost per interview was higher in TLS than RDS. The TLS planning phase cost was almost 3 times that for RDS. The planning for TLS required extensive formative work to construct a sampling frame of venues, verification of venues identified and an initial enumeration count, which also meant additional staff and transportation costs. External technical assistance was required for both methods. The need for external assistance in other contexts will depend on local capacity and experience with HIV surveillance surveys.
There are several limitations to our study. First, in the absence of a gold standard for surveying MSM, it is difficult to assess the representativeness of the samples obtained by the different sampling strategies. Generally, the total population data required for a robust evaluation are generally unavailable on hidden and stigmatized groups such as MSM. As no biological markers were collected, we were neither able to assess differences in prevalence of HIV infection nor the challenges associated with collecting biological specimens. Also, we were not able to compare response rates by recruitment strategy since we did not collect information on the number of eligible individuals who refused to participate in the RDS study. Finally, social desirability may have led to under-reporting of stigmatized behaviors in both samples.
While it is difficult to say whether RDS and TLS samples will yield similar results in other countries and settings, our results from Guatemala city are consistent with empirical knowledge about these two sampling methods in other places. RDS reached MSM who were less educated, less likely to be “out” and more likely to have had sex with women. This is an important population to survey in countries with high levels of stigma where MSM and women contribute to transmission from higher prevalence groups to the general population. In contrast, TLS reached a population with a greater number of sexual partnerships, less exposure to prevention, and that was more likely to abuse alcohol. The mapping of venues and interaction with members of the community provide valuable information for future planning of public health interventions among MSM. Because TLS is based on standard survey methods, it has the advantages of a more established theoretical basis and standard methods for statistical analysis using widely available software [44]. RDS is based on participants’ social networks and permits calculation of population estimates of the networked population. Of note, both methods depend on important theoretical assumptions that may not hold true in real-world scenarios.
The findings of this comparison suggest that researchers should carefully consider study objectives and available resources when choosing a sampling method. The choice between RDS and TLS should be based on the appropriateness of the sampling method for the population of interest (e.g., social connectedness of the population to warrant RDS, sufficient concentration of the population in venues to warrant TLS), resources available, ease of implementation, and feasibility in conducting the analysis. Researchers and public health officials should consider the need for consistency in surveillance methods as these may influence the sample composition and ability to evaluate trends over time.
Acknowledgments
This work was supported by Tephinet Inc. through a cooperative agreement (#6D43GH000014-05) from the Centers for Disease Control and Prevention and by Del Valle University through a grant with the University of North Carolina at Chapel Hill Center for AIDS Research (CFAR), an NIH funded program P30 AI50410. The authors thank institutions and venue owners involved in the conduct of this study. The authors recognize the contribution of the field staff and technical consultants: Berta Alvarez, Nelson Arambu, Flor de Maria Hernandez, Jose Manuel Aguilar, Sabrina Boyce, Andres Alvarado, Sonia Morales Miranda, Jessica Espana, Norma Zuniga, Cesar Galindo, Andrea Kim, Henry Fisher Raymond, Willi McFarland, and Clare Barrington. The authors are also grateful for the two anonymous reviewers’ valuable comments that greatly improved the manuscript.
Footnotes
Cesar Galindo, Del Valle University of Guatemala, personal communication, 2012.
Conflict of interest The authors declare that they have no conflict of interest
This work was presented in part at the 6th IAS Conference on HIV Pathogenesis, Treatment and Prevention, Rome, Italy, July 2011. The findings and conclusions in this report are those of the authors and do not necessarily represent the official position of the Centers for Disease Control and Prevention. Use of trade names and commercial sources are for identification purposes only and does not imply endorsement by Public Health Service or the U.S. Department of Health and Human Services.
Contributor Information
Gabriela Paz-Bailey, Division of HIV/AIDS Prevention, National Center for HIV, Hepatitis, STD and Tuberculosis, Centers for Disease Control and Prevention, 1600 Clifton Rd NE, MS E-46, Atlanta, GA 30333, USA.
William Miller, Department of Public Health, University of Chapel Hill, Chapel Hill, NC, USA.
Ray W. Shiraishi, Division of Global HIV/AIDS, Center for Global Health, Centers for Disease Control and Prevention, Atlanta, GA, USA
Jerry O. Jacobson, Bogota, Colombia
Taiwo O. Abimbola, Division of Global HIV/AIDS, Center for Global Health, Centers for Disease Control and Prevention, Atlanta, GA, USA
Sanny Y. Chen, Division of Global HIV/AIDS, Center for Global Health, Centers for Disease Control and Prevention, Atlanta, GA, USA
References
- 1.Bastos FI, Caceres C, Galvao J, Veras MA, Castilho EA. AIDS in Latin America: assessing the current status of the epidemic and the ongoing response. Int J Epidemiol. 2008;37:729–37. doi: 10.1093/ije/dyn127. [DOI] [PubMed] [Google Scholar]
- 2.Soto RJ, Ghee AE, Nunez CA, Mayorga R, Tapia KA, Astete SG, et al. Sentinel surveillance of sexually transmitted infections/HIV and risk behaviors in vulnerable populations in 5 Central American countries. J Acquir Immune Defic Syndr. 2007;46:101–11. [PubMed] [Google Scholar]
- 3.Vision Mundial de Guatemala. Informe final del estudio de línea de base: iniciativa intensificación de las acciones de prevención y atención integral del VIH/sida en grupos vulnerables y área prioritarias. Guatemala: Vision Mundial; 2006. [Google Scholar]
- 4.Caceres CF. HIV among gay and other men who have sex with men in Latin America and the Caribbean: a hidden epidemic? AIDS. 2002;16(Suppl 3):S23–33. doi: 10.1097/00002030-200212003-00005. [DOI] [PubMed] [Google Scholar]
- 5.Caceres C, Konda K, Pecheny M, Chatterjee A, Lyerla R. Estimating the number of men who have sex with men in low and middle income countries. Sex Transm Infect. 2006;82(Suppl 3):iii3–9. doi: 10.1136/sti.2005.019489. [DOI] [PMC free article] [PubMed] [Google Scholar]
- 6.Goodman LA. Snowball Sampling. Ann Math Stat. 1961;32:148–70. [Google Scholar]
- 7.Erickson B. Some problems of inference from chain data. Social Methodol Res. 1979;10:276–302. [Google Scholar]
- 8.Muhib FB, Lin LS, Stueve A, Miller RL, Ford WL, Johnson WD, et al. A venue-based method for sampling hard-to-reach populations. Public Health Rep. 2001;116(Suppl 1):216–22. doi: 10.1093/phr/116.S1.216. [DOI] [PMC free article] [PubMed] [Google Scholar]
- 9.MacKellar DA, Gallagher KM, Finlayson T, Sanchez T, Lansky A, Sullivan PS. Surveillance of HIV risk and prevention behaviors of men who have sex with men–a national application of venue-based, time-space sampling. Public Health Rep. 2007;122(Suppl 1):39–47. doi: 10.1177/00333549071220S107. [DOI] [PMC free article] [PubMed] [Google Scholar]
- 10.Heckathorn DD. Respondent-driven sampling II: deriving valid population estimates from chain referral samples of hidden populations. Social Probl. 2002;49:11–34. [Google Scholar]
- 11.Heckathorn D. Respondent-driven sampling: a new approach to the study of hidden populations. Social Probl. 1997;44:174–99. [Google Scholar]
- 12.Salganik MJ, Heckathorn D. Sampling and estimation in hidden populations using respondent-driven sampling. Sociol Methodol. 2004;34:193–239. [Google Scholar]
- 13.Gile KJ, Handcock MS. Respondent-driven sampling: an assessment of current methodology. Sociol Methodol. 2010;40:285–327. doi: 10.1111/j.1467-9531.2010.01223.x. [DOI] [PMC free article] [PubMed] [Google Scholar]
- 14.Goel S, Salganik MJ. Assesing respondent-driven sampling. PNAS. 2010;107:6743–7. doi: 10.1073/pnas.1000261107. [DOI] [PMC free article] [PubMed] [Google Scholar]
- 15.Lu X, Bengtsson L, Britton T, Camitz M, Jun Kim B, Thorson A. The sensitivity of respondent-driven sampling method. J R Stat Soc Ser A. 2012;175:191–216. [Google Scholar]
- 16.Gile KJ. Improved inference for respondent-driven sampling data with application to HIV prevalence estimation. J Am Stat Assoc. 2011;106:135–46. [Google Scholar]
- 17.Gile KJ, Handcock MS. Network model-assisted inference from respondent-driven sampling data. 2011 doi: 10.1111/rssa.12091. arXiv: 1108.0298 [stat.ME] [DOI] [PMC free article] [PubMed] [Google Scholar]
- 18.Sigman R. Methods for inference from hard-to-reach populations. Section on Survey Research Methods, Social Statistics Section, Statistics Without Borders, Committee on Gay and Lesbian Concerns in Statistics; Miami Beach, Florida. 2011. [Google Scholar]
- 19.Magnani R, Sabin K, Saidel T, Heckathorn D. Review of sampling hard-to-reach and hidden populations for HIV surveillance. AIDS. 2005;19(Suppl 2):S67–72. doi: 10.1097/01.aids.0000172879.20628.e1. [DOI] [PubMed] [Google Scholar]
- 20.Montealegre JR, Johnston LG, Murrill C, Monterroso E. Respondent driven sampling for HIV biological and behavioral surveillance in Latin America and the Caribbean. AIDS Behav. 2013;17(7):2313–40. doi: 10.1007/s10461-013-0466-4. [DOI] [PubMed] [Google Scholar]
- 21.Malekinejad M, Johnston LG, Kendall C, Kerr LR, Rifkin MR, Rutherford GW. Using respondent-driven sampling methodology for HIV biological and behavioral surveillance in international settings: a systematic review. AIDS Behav. 2008;12:S105–30. doi: 10.1007/s10461-008-9421-1. [DOI] [PubMed] [Google Scholar]
- 22.Gallagher KM, Sullivan PS, Lansky A, Onorato IM. Behavioral surveillance among people at risk for HIV infection in the U.S.: the National HIV behavioral surveillance system. Public Health Rep. 2007;122(Suppl 1):32–8. doi: 10.1177/00333549071220S106. [DOI] [PMC free article] [PubMed] [Google Scholar]
- 23.Dinenno EA, Oster AM, Sionean C, Denning P, Lansky A. Piloting a system for behavioral surveillance among heterosexuals at increased risk of HIV in the United States. Open AIDS J. 2012;6:169–76. doi: 10.2174/1874613601206010169. [DOI] [PMC free article] [PubMed] [Google Scholar]
- 24.Paquette D, De Wit J. Sampling methods used in developed countries for behavioural surveillance among men who have sex with men. AIDS Behav. 2010;14:1252–64. doi: 10.1007/s10461-010-9743-7. [DOI] [PubMed] [Google Scholar]
- 25.Ramirez-Valles J, Heckathorn DD, Vazquez R, Diaz RM, Campbell RT. From networks to populations: the development and application of respondent-driven sampling among IDUs and Latino gay men. AIDS Behav. 2005;9:387–402. doi: 10.1007/s10461-005-9012-3. [DOI] [PubMed] [Google Scholar]
- 26.Yeka W, Maibani-Michie G, Prybylski D, Colby D. Application of respondent driven sampling to collect baseline data on FSWs and MSM for HIV risk reduction interventions in two urban centres in Papua New Guinea. J Urban Health. 2006;83:i60–72. doi: 10.1007/s11524-006-9103-0. [DOI] [PMC free article] [PubMed] [Google Scholar]
- 27.Johnston LG, Sabin K, Mai TH, Pham TH. Assessment of respondent driven sampling for recruiting female sex workers in two Vietnamese cities: reaching the unseen sex worker. J Urban Health. 2006;83:i16–28. doi: 10.1007/s11524-006-9099-5. [DOI] [PMC free article] [PubMed] [Google Scholar]
- 28.Kendall C, Kerr LR, Gondim RC, Werneck GL, Macena RH, Pontes MK, et al. An empirical comparison of respondent-driven sampling, time location sampling, and snowball sampling for behavioral surveillance in men who have sex with men, Fortaleza, Brazil. AIDS Behav. 2008;12:S97–104. doi: 10.1007/s10461-008-9390-4. [DOI] [PubMed] [Google Scholar]
- 29.Wei C, McFarland W, Colfax GN, Fuqua V, Raymond HF. Reaching black men who have sex with men: a comparison between respondent-driven sampling and time-location sampling. Sex Transm Infect. 2012;88:622–6. doi: 10.1136/sextrans-2012-050619. [DOI] [PMC free article] [PubMed] [Google Scholar]
- 30.Guo Y, Li X, Fang X, Lin X, Song Y, Jiang S, et al. A comparison of four sampling methods among men having sex with men in China: implications for HIV/STD surveillance and prevention. AIDS Care. 2011;23:1400–9. doi: 10.1080/09540121.2011.565029. [DOI] [PMC free article] [PubMed] [Google Scholar]
- 31.Weir SS, Merli MG, Li J, Gandhi AD, Neely WW, Edwards JK, et al. A comparison of respondent-driven and venue-based sampling of female sex workers in Liuzhou, China. Sex Transm Infect. 2012;88(Suppl 2):i95–101. doi: 10.1136/sextrans-2012-050638. [DOI] [PMC free article] [PubMed] [Google Scholar]
- 32.Johns B, Baltussen R, Hutubessy R. Programme costs in the economic evaluation of health interventions. Cost Eff Resour Allocation. 2003;1:1. doi: 10.1186/1478-7547-1-1. [DOI] [PMC free article] [PubMed] [Google Scholar]
- 33.UNAIDS. Monitoring the Declaration of Commitment on HIV/AIDS: Guidelines on Construction of Core Indicators: 2008 reporting. Geneva, Switzerland: UNAIDS/WHO; 2008. p. 144. [Google Scholar]
- 34.Sigman R, Kalton G, Krishna N, Johnson CH, Oster AM. Weighting venue-based sample data for the National HIV Behavioral Surveillance System among men who have sex with men, 2008. Joint Statistical Meeting; July 30–August 4, 2011; Miami Beach, Florida. 2011. [Google Scholar]
- 35.Liu B, Ferraro D, Wilson E, Brick MJ. Joint Statistical Meetings, Section on Survey Research Methods. American Statistical Association; 2004. Trimming Extreme Weights in Household Surveys; pp. 3905–3911. [Google Scholar]
- 36.Lehtonen R, Pahkinen E. Practical methods for design and analysis of complex surveys. 2. Chichester: Wiley; 2004. [Google Scholar]
- 37.Shackman G. Sample size and design effect. American Statistical Association; Albany, NY: 2001. [Google Scholar]
- 38.HIVOS. Guía de trabajo objetivo 1 para sub-receptores, implementación del proyecto de RCC FASE 1, 2010–2013. Guatemala city: Guatemala; 2011. Edited by unlimited. Hp. [Google Scholar]
- 39.Salganik MJ. Variance estimation, design effects, and sample size calculations for respondent-driven sampling. J Urban Health. 2006;83:i98–112. doi: 10.1007/s11524-006-9106-x. [DOI] [PMC free article] [PubMed] [Google Scholar]
- 40.Szwarcwald CL, Barbosa-Junior A, Pascom AR, de Souza PR., Junior Knowledge, practices and behaviours related to HIV transmission among the Brazilian population in the 15–54 years age group, 2004. AIDS. 2005;19(Suppl 4):S51–8. doi: 10.1097/01.aids.0000191491.66736.16. [DOI] [PubMed] [Google Scholar]
- 41.Wejnert C, Pham H, Krishna N, Le B, DiNenno E. Estimating design effect and calculating sample size for respondent-driven sampling studies of injection drug users in the United States. AIDS Behav. 2012;16:797–806. doi: 10.1007/s10461-012-0147-8. [DOI] [PMC free article] [PubMed] [Google Scholar]
- 42.Johnston LG, Chen YH, Silva-Santisteban A, Raymond HF. An empirical examination of respondent driven sampling design effects among HIV risk groups from studies conducted around the world. AIDS Behav. 2013;17(6):2202–10. doi: 10.1007/s10461-012-0394-8. [DOI] [PubMed] [Google Scholar]
- 43.Goel S, Salganik MJ. Respondent-driven sampling as Markov chain Monte Carlo. Stat Med. 2009;28:2202–29. doi: 10.1002/sim.3613. [DOI] [PMC free article] [PubMed] [Google Scholar]
- 44.Karon JM, Wejnert C. Statistical methods for the analysis of time-location sampling data. J Urban Health. 2012;89:565–86. doi: 10.1007/s11524-012-9676-8. [DOI] [PMC free article] [PubMed] [Google Scholar]