

Abstract
Alzheimer’s disease (AD), the most common form of dementia, afflicts about 50 million people worldwide. Currently, AD diagnosis is primarily based on psychological evaluation and can only be confirmed post-mortem. Reliable and objective biomarkers for prognosis and diagnosis have been sought for several years. Together, tau and amyloid β 1–42 (Aβ42) in cerebrospinal fluid (CSF) have been shown to provide good diagnostic sensitivity and specificity. Additionally, phosphorylated forms of tau, such as tau pS181, have also shown promising results. However, the measurement of such markers currently relies on antibody-based immunoassays that have shown variability, leading to discrepant results across laboratories. To date, mass spectrometry methods developed to evaluate CSF tau and Aβ42 are not compatible. We present in this article the development of a mass spectrometry-based method of quantification for CSF tau and Aβ42 in parallel. The absolute concentration of tau and Aβ42 we measured are on average 50 ng/mL (7–130 ng/mL) and 7.1 ng/mL (3–13 ng/mL), respectively. Analyses of CSF tau and Aβ42, in a cohort of patients with AD, mild cognitive impairment and healthy controls (30 subjects), provide significant group differences evaluated with ROC curves (AUC(control-AD) and AUC(Control-MCI)=1, AUC(MCI-AD)=0.76), with at least equivalent diagnostic utility to immunoassay measurements in the same sample set. Finally, a significant and negative correlation was found between the tau and Aβ peptide ratio and the disease severity.
Keywords: Alzheimer’s disease, mass spectrometry, SRM, diagnosis, tau, amyloid β, Aβ42
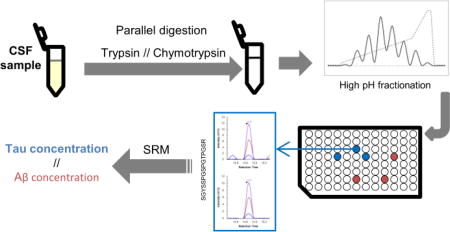
For Table of Contents Only
Introduction
Diagnosis of Alzheimer’s disease (AD), the most common form of geriatric dementia, relies largely on clinical and neuropsychological evaluation, and confirmation of the diagnosis can only be obtained post-mortem (1). Upon autopsy, pathological examination of the AD brain reveals two characteristic hallmarks: neuritic plaques, primarily containing amyloid β (Aβ), of which the 42-amino acid form (Aβ1–42) is more prone to aggregation than the 40-amino acid form (2); and neurofibrillary tangles containing tau, including its phosphorylated forms. However, objective biomarkers capable of detecting AD and tracing its course in living patients are an area of substantial interest, leading to studies that have investigated new markers to diagnose or evaluate the disease progression. The candidate markers are many, including proteins and lipid markers in body fluids as well as brain imaging using magnetic resonance imaging or positron emission tomography (3), (4). The most promising biomarkers to date come from cerebrospinal fluid (CSF) of living patients, where the levels of Aβ1–42 and tau can be monitored. These studies (5), (6), (7) revealed a decrease of Aβ in the CSF of AD patients, which inversely correlated with the formation of plaques (8), (9). On the contrary, tau and phosphorylated tau increase in CSF of AD patients, with at least some tau forms correlating with the formation of tangles (10), (8), (11). These changes in levels of the two key proteins make them valuable markers of the disease, especially when their concentrations are studied together, and CSF tau and Aβ1–42 remain two of the most targeted proteins thanks to their high power of discrimination between healthy control and AD patients as well as their mechanistic association with the disease.
A complication in the use of Aβ1–42 and tau as clinical biomarkers is their quantification using different immunoassay platforms, such as ELISA, Luminex, meso scale discovery (MSD) (12), (13), (6), (14), and so on. These platforms depend on antibodies, leading to variability in their inherent efficiency, as well as substantial differences between assays using different antibody pairs, complications due to matrix effects in samples, and difficulty in measuring the absolute concentration of the markers. The standardization of CSF tau and Aβ1–42 measurements using immunoassays between laboratories has proven difficult (15), (16), and this phenomenon is not unique to the AD field (17). For example, a mass spectrometry-based assay has been developed to quantify synuclein isoforms in CSF, showing the value of measuring more than one marker to increase the potential of the assay (18). Similarly, to eliminate the limitations imposed by the use of antibodies, research groups have attempted the quantification of tau (19) or Aβ1–42 (20), (21), (22) in CSF using mass spectrometry techniques, such as selected reaction monitoring (SRM), which relies on quantifying the intensity of signal produced by detection of peptides generated from the targeted protein (for more details see (23)). The SRM method not only provides highly selective and sensitive measurements of distinct proteins, but also demonstrates good precision and excellent reproducibility across different laboratories (24), (25).
The major challenge in using SRM to quantify tau and Aβ is their biochemical dissimilarity, leading investigators to use separate assays under specific conditions providing the best detection and quantification for each target, that is, tau (19) or Aβ (20), (21), (22). In particular, the detection of tau, being a protein of low abundance in CSF and, more importantly, being represented by multiple fragments in CSF, remains challenging without initial enrichment. Although using antibodies to enrich both proteins at the same time before analysis would, in theory, increase the sensitivity, this has not been reported as a successful approach; so far each of the previous studies presents the optimal conditions for the quantification of the marker of interest, often using conditions that are not compatible, making it impossible to quantify both biomarkers simultaneously (i.e., in a single mass spectrometry run), or in parallel (where the sample processing for both analytes is similar enough to prepare simultaneously, and no modifications to the MS machinery or protocols are required between analyte runs). Our goal here was to establish a method that would allow the quantification of both tau and Aβ42 in a single experiment. This approach would provide not only time savings by analyzing two biomarkers in parallel in one experimental run, but also reduced variation, given that processing the samples in a parallel manner reduces the difference in handling between experiments. A simultaneous or in-parallel strategy also provides additional chances to improve the sensitivity and specificity of the assay by quantifying tau in conjunction with Aβ1–42, as demonstrated by immunoassays (e.g., INNO-BIA AlzBio3 Luminex and MSD assays) (26), (27), (14). Here we present a method of fractionation allowing the detection and quantification of peptides from tau and Aβ in parallel, with at least equivalent diagnostic utility to immunoassays.
Materials and Methods
Materials
Trypsin gold (mass spectrometry grade) and chymotrypsin were obtained from Promega (Madison, WI). Glass screw neck vials for liquid chromatography autosampler were from Waters (Milford, MA). Protease Inhibitor Cocktail (PIC), dithiothreitol (DTT), and iodoacetamide (IAA) were obtained from Sigma (St. Louis, MO). Acids and organic solvents were HPLC grade. Recombinant tau 441 and Beta-amyloid (1–42) standards unlabeled (quantified using amino acid analysis) and 15N tau 441 uniformly labeled and 15N Beta-amyloid (1–42) uniformly labeled were purchased from rPeptide (Bogart, GA).
Characterization of subjects and sample collection
The Institutional Review Boards at the University of California at San Diego, Oregon Health Science University and the University of Washington (UW) approved this study. “Reference CSF” samples were used to develop and assess the assay, and consisted of pooled samples discarded following clinical testing at Harborview Medical Center, UW. After collection and clinical assessment, the “reference CSF” samples were stored at 4°C until transfer to our laboratory. Upon reception, the samples were treated with PIC at the manufacturer’s suggested concentration. Subsequently, the samples were pooled, aliquoted and stored at −80°C until further use. A total of 30 subjects, including 10 patients with AD, 10 patients with mild cognitive impairment (MCI) and 10 age- and sex- matched healthy controls were used. All CSF samples were obtained after informed consent from patients who underwent thorough medical history evaluation, physical and neurological examinations, laboratory tests, and neuropsychological assessments. The inclusion and exclusion criteria have been previously described (28). Briefly, AD dementia patients were diagnosed with probable AD according to NINDS-ADRDA criteria (29). MCI subjects had a Mini Mental Status Examination (MMSE) score between 24–30, a memory complaint, objective memory loss measured by education adjusted scores on Wechsler Memory Scale Logical Memory II, a Clinical Dementia Rating (CDR) of 0.5, absence of significant levels of impairment in other cognitive domains, essentially preserved activities of daily living, and an absence of dementia. The control subjects consisted of healthy community volunteers and had no signs or symptoms of cognitive impairment or neurological disease; all control subjects had a MMSE score between 28 and 30, a CDR score of 0, and New York University paragraph recall scores (immediate and delayed) of > 6. The summary of demographics of subjects is provided in Table 1; there was no significant group difference on age (p=0.13).
Table 1.
Patients information
| Total | Sex (M/F) |
Age (±SD) | MMSE (±SD) |
|
|---|---|---|---|---|
| Control | 10 | 5/5 | 72.4 (±5.0) | 27.6 (±3.6) |
| MCI | 10 | 5/5 | 74.4 (±8.1) | 25.1 (±2.1) |
| AD | 10 | 5/5 | 67.4 (±9.5) | 19.4 (±2.5) |
All CSF samples were collected by lumbar puncture in the morning, processed and stored at −80°C following standard clinical protocols and quality control procedures as described previously (28). At the UW, the samples were thawed, treated with 10% protease inhibitor cocktail (PIC) and aliquoted before once again being frozen and stored at −80 °C until further analysis.
Sample preparation and protein digestion
Uniformly labeled 15N Ttau 441 and 15N Beta-amyloid (1–42) were spiked into 100 µL CSF samples to a final concentration of 5 fmol/µL and 20 fmol/µL respectively; and the proteins were precipitated with 20% trichloroacetic acid (final concentration). After 2h of incubation at −20°C, the samples were centrifuged at 15000 × g for 15min at 4°C and washed twice with 180 µL of cold acetone. Dried pellets were solubilized in 50 µL of urea solution (8M for trypsin digest or 4M for chymotrypsin digest) and the total amount of protein was determined using the Pierce bicinchoninic acid (BCA) Protein Assay Kit (Thermo Scientific, Rockford, IL, USA). The protein mixture was reduced, for 1h at 37°C, with 5mM DTT (final concentration) and alkylated for 30 min, in the dark at room temperature, with 15 mM iodoacetamide (final concentration). After dilution (1:10, v:v) of the protein sample with 25mM ammonium bicarbonate, enzymes, trypsin or chymotrypsin, was added at the approximate ratio 1:25 (enzyme:protein, w:w). Samples were then incubated overnight at 37°C with agitation. After the incubation, the digestion was quenched by adding trifluoroacetic acid (TFA, 0.4%, final concentration) and acetonitrile (ACN, 2% final concentration). The peptides were finally desalted using microspin columns, C18 silica (Nest Group, Southborogh, MA), following the manufacturer’s protocol. After desalting, peptides were dried under vacuum and resuspended in 25 µL of 2% ACN, 0.1% formic acid. The peptide concentration was determined using BCA protein assay kit. For the high pH fractionation, the volume equivalent to 35 µg of peptides was transferred to a glass vial and the volume was adjusted to 70µL.
High pH peptide fractionation
The peptide separation was performed on a U3000 nanoHPLC system (Dionex, Thermo Scientific) following the method published by Shi et al. (30). In brief, 50 µL of peptide samples diluted to 0.5 µg/µL were loaded and separated on C18 column (home-packed 50 cm long, 200 µm ID, Jupiter® 300Å C18 3µm diameter, from phenomenex, Torrance, CA, USA). The separation was performed using a ratio between two buffers, 10 mM ammonium formate in water at pH 9 (buffer A) and 10 mM ammonium formiate in 90% ACN (buffer B) at a flow rate of 2.2µL/min. The gradient applied was first loading and equilibrating the column for 30 min at 1% B, followed by gradient increase to 5% B within 2 min, 60 min gradient up to 45% B, increase to 90% B in 13 min, 3 min at 90% B, decrease to 1% B within 3 min, and 14 min at 1% B. Fractions were collected every 3 min from the beginning of the gradient in collection tubes containing 18.4 µL of 2% ACN, 0.1% formic acid.
Selected reaction monitoring (SRM) assay
Quantification of target peptides from tau and Aβ1–42 by SRM was performed on a TSQ Vantage, triple quadrupole mass spectrometer (Thermo Scientific) coupled to a nanoAcquity UPLC (Waters). Four (4 µL) microliters of protein digest or high pH fractions was loaded on C18 trap column (20 mm long, 75µm ID) and separated on a reversed-phase home-packed fused silica column, 75 µm i.d. × 30 cm (100 Å Magic C18AQ; Michrom/Bruker, Auburn, CA, USA) at a flow rate of 0.3 µL/min using 0.1% formic acid in water as mobile phase A and 0.1% formic acid in ACN as mobile phase B. Elution was carried out using a binary gradient increasing from 2 to 30% B in 15 min, 30% to 80% B in 1 min, 80% B for 5 min, 80% to 2% B in 1 min, finally the column was re-equilibrated with 2% B for 8 min. All MS experiments were performed in positive ion mode with source temperature set to 350°C and spray voltage to 2.1 kV. Scheduled SRM was performed with 8 min retention time windows for most of the peptides and an instrument cycle time of 2000 ± 500ms. Dwell times were optimized based on the number of concurrent transitions but in all cases they were at least 50 ms. Collision energies for each transition were calculated using Skyline software, which have previously been tested for accuracy in our hands. Both of the Q1 and Q3 peak widths (FWHMs) were set to be 0.70.
To construct the calibration curves for the target peptides, recombinant unlabeled and 15N-labeled proteins were used. Standard proteins were digested in 50 µg of BSA following the conditions of the CSF digest. Unlabeled protein standard was resuspended in Buffer A and serial dilution was performed to yield concentrations ranging from 100 pmol/mL to 0.013 pmol/mL (4.6 µg/mL to 0.6ng/mL) for tau and 1000 pmol/mL to 0.13 pmol/mL (4.5µg/mL to 0.6ng/mL) for Aβ1–42. Digested 15N-labeled peptides were spiked at 50 pmol/mL final concentration for tau and 200 pmol/mL final concentration for Aβ1–42 on the serially diluted standards. Four microliters of each standard was injected on column for SRM analysis (see table S-1 for transitions list).
SRM Data Analysis
All SRM raw data files were uploaded and processed in Skyline software ver. 3.5.0.9319 (McCoss Lab, University of Washington). Typical settings applied include 0.055 Th match tolerance m/z, default peak integration and Savitzky–Golay smoothing algorithm. Manual inspection and evaluation of data sets were done to ensure correct peak detection and integration. Quantification was performed using peak areas of at least the three best performing transitions for both unlabeled and labeled peptides (see table S-1 for the best transitions).
Immuno-based Assay
Levels of tau and Aβ1–42 were assessed by MSD immunoassays and published previously (14), which generate comparable data to the commonly used AlzBio3 Luminex assay.
Statistical analysis
All statistical analyses were performed in Mathematica (Mathematica software, Champaign, IL, USA, www.wolfram.com/mathematica V11.0.0.0) and GraphPad Prism version 6.00 for Windows (GraphPad Software, San Diego California USA, www.graphpad.com Prism 6.0). Analysis of Variance (ANOVA) followed by posthoc Tukey HSD test were used to compare group differences between AD, MCI and controls for both MSD and SRM assay. Receiver Operating Characteristic (ROC) curves for analytes were generated to evaluate their sensitivities and specificities in distinguishing AD from healthy control subjects. The “optimum” cutoff value for a ROC curve was defined as the value associated with the maximal sum of sensitivity and specificity. Spearman correlation was used to determine correlation between CSF Aβ or tau MSD assay measurements and the SRM results. Values with p<0.05 were considered significant in the analyses.
Results
Method development
We developed a mass spectrometry-based method for the quantification of tau and Aβ in parallel. In our initial protocol we processed the samples with trypsin, followed by the direct injection of the sample in the LC-MS system for SRM measurement. With this approach, trypsin cleavage of Aβ generates one peptide corresponding to amino acids in positions 17 to 28 of Aβ1–42 (see figure 1A), easily detectable in CSF, while tau peptides remain barely detectable and/or unreliable. To improve the detection of tau peptides, we added a high pH fractionation prior to the LC-MS measurement (see synopsis in figure 1B). By simplifying the sample with the fractionation, we were able to reliably detect and quantify two peptides from tau in reference CSF, covering the sequences 194 to 208 and 211 to 220 of tau 441. The fractionation allowed us to increase the signal intensity for both heavy and light peptides. For example, from the same reference CSF sample, the signal intensity for the heavy tau peptide SGYSSPGSPGTPGSR (peptide 194–208) was increased sixty fold and the light signal was brought above the detection and quantification limits. For the tau peptide TPSLPTPPTR (peptide 211–220), the heavy signal intensity was increased five fold and the light signal was brought above the noise signal to a more acceptable level for its quantification. Figure 1B shows the signal after fractionation for those two peptides (see also a comparison in figure S-1). A third peptide from tau showed a reproducible detection in reference CSF, however, the expression of this peptide remains quite low and close to the limit of quantification. Figure 2A shows the difference of concentration of the most intense peptides (TPSLPTPPTR and SGYSSPGSPGTPGSR) and the third peptide of low intensity (STPTAEDVTAPLVDEGAPGK). We estimate the difference of concentration to approximately 7.2 fold in the same reference CSF sample. The peptide STPTAEDVTAPLVDEGAPGK is part of the N2 region of tau, which is not expressed in every tau isoform. This would explain the difference in expression between this peptide and the others, as well as the lower intensity of this peptide.
Figure 1.

(A) Sequence of Aβ1–42, with the cleavage sites for chymotrypsin (arrows at top of the sequence) and cleavage sites for trypsin (arrows at the bottom of the sequence). The part of the sequence included in both peptides measured after trypsin and chymotrypsin digest is underlined. The amino acid sequence specific to Aβ42 is represented in bold at the C-terminal end of the sequence. (B) Schematic illustrating the design of our experiment, showing the digest performed in parallel with trypsin or chymotrypsin, the separate fractionation of the peptides generated by each digest and the analysis of the fraction containing the peptides of interest with LC-MS.
Figure 2.

(A) Histogram illustrating the difference of expression of the tau peptides: TPSLPTPPTR and SGYSSPGSPGTPGSR are part of the core of the protein and have higher level of expression; STPTAEDVTAPLVDEGAPGK is located at the N-terminal portion of the protein and displays a lower level of expression. (B) Histogram illustrating the difference of expression of the Aβ peptide shared between amyloid β proteoforms (AEDVGSNKGAIIGL) and the peptide specific to Aβ42 (MVGGVVIA).
Trypsin digestion followed by high pH fractionation resulted in reliable detection of one quantifiable peptide representative of Aβ. During our initial evaluation of the assay, when tested in pooled samples, the pattern of expression of Aβ did not show any differences between control, MCI and AD patients (data not shown). This could be explained by the fact that the peptide measured (LVFFAEDVGSNK) is shared between several proteoforms of Aβ and thus is not representative of Aβ1–42. The only peptide able to discriminate Aβ1–42 from the other proteoforms would be the C-terminal peptide (GAIIGLMVGGVVIA, figure 1A), which was not etectable under these conditions.
To detect the C-terminal portion of Aβ42 we used chymotrypsin, which generated two detectable peptides—AEDVGSNKGAIIGL and MVGGVVIA (figure 1A). The latter peptide represents the last eight amino acids of Aβ1–42 and is thus specific to this proteoform. Figure 2B shows the difference in expression of the peptides generated by chymotrypsin. We estimate approximately 6.8 fold differences between both peptides within the same reference CSF sample, which likely illustrates the difference in quantity between the peptide shared among proteoforms of Aβ and the C-terminal peptide of Aβ1–42. This C-terminal peptide of Aβ1–42 includes the amino acids that differentiate Aβ1–42 from Aβ1–40 and Aβ1–38. However, as we do not measure the entire proteoform, we differentiate in the text the full form “Aβ1–42+” from the form we measure “Aβ42”. Because of the low abundance of the C-terminal peptide of Aβ42, samples digested by chymotrypsin are also fractionated with our high pH method prior to SRM measurement to reduce the noise and increase the sensitivity of the detection. Finally, the expression of the Aβ peptides LVFFAEDVGSNK, from trypsin digest and AEDVGSNKGAIIGL, from chymotrypsin digest show a good correlation (p<0.001), indicating comparable digests (figure S-2).
To validate the reproducibility, we performed three repetitions of the assay using reference CSF, evaluating the variation between each sample preparation. Table 2 summarizes the characteristic of each peptide monitored in this assay (standard curves are shown on figure S-3).
Table 2.
Characteristics observed for each peptide monitored in our tau and Aβ42 assay. Mean, Standard deviation (SD) and coefficient of variation (CV) were obtained with repeats of a reference sample
| Mean | SD | CV | Lineraity range (fmol/ul) |
LLOD* | LLOQ* | |||
|---|---|---|---|---|---|---|---|---|
| Trypsin | Tau | TPSLPTPPTR | 39.2 | 0.321 | 0.8% | 0.10–50 | 0.78 | 1.56 |
| SGYSSPGSPGTPGSR | 29.1 | 1.84 | 6.3% | 0.10–50 | 0.1 | 0.1 | ||
| STPTAEDVTAPLVDEGAPGK | 4.57 | 0.013 | 0.3% | 0.10–6.25 | 0.1 | 0.1 | ||
|
| ||||||||
| Aβ | LVFFAEDVGSNK | 227.879 | 9.666 | 4.2% | 15.6–500 | 15.6 | 15.6 | |
|
| ||||||||
| Chymotrypsin | Aβ | AEDVGSNKGAIIGL | 245.987 | 9.897 | 4.0% | 15.6–1000 | 15.6 | 31.25 |
| MVGGVVIA | 35.150 | 1.355 | 3.9% | 3.9#–500 | 0.49 | 0.98 | ||
The LLOD is the lowest measurement with a CV<20%. The LLOQ is the lowest value with a CV<10%
for the peptide MVGGVVIA, LLOD and LLOQ are below the linear range. However, no experimental values are below the lowest value of the linear range.
Comparison of the SRM assay to the corresponding immunoassay on CSF samples
We tested our SRM assay in CSF from a small cohort of clinical samples from control subjects or patients with MCI or AD, which we have previously measured for tau and Aβ1–42 concentrations using immunoassays. For tau, among the three peptides detectable in our SRM assay only two were quantifiable in all samples, while the third (STPTAEDVTAPLVDEGAPGK), positioned at the N-terminal region of the protein, could be detected in eleven samples and quantified in eight. However, while this peptide provides the lowest concentration for tau, the comparison of the SRM concentrations with the immunoassay results reveals values on average twelve times higher than the concentrations obtained by immunoassay.
To compare our assay with traditional immunoassays, we determined the correlation between the quantification obtained in the current SRM assay with the data previously obtained with MSD assay for the same set of samples. The concentrations, obtained with the peptides TPSLPTPPTR and SGYSSPGSPGTPGSR, that could be quantified by SRM in every sample analyzed, significantly correlated (ρ=0.74 and 0.82 respectively and p<0.001 for both peptides, figure S-4A and B) with the concentrations measured using the immunoassay. Both peptides were estimated to have similar concentrations in each sample. When the expression level of both peptides were averaged, we estimated the average concentration to be close to ninety times higher than the concentration obtained by immunoassay (correlation ρ=0.83, p<0.0001), likely due to the antibodies capturing and detecting a sub-population of tau species in CSF (figure 3A). The average would compensate for any variation between samples, due to changes in digest, post-translational modifications, and so on. The correlation for the peptide STPTAEDVTAPLVDEGAPGK was only borderline significant (ρ=0.52, p=0.07, figure S-4C), probably resulting from the small number of samples. Considering that this peptide is not representative of tau in the majority of the sample, we disregarded this peptide in the rest of the analysis.
Figure 3.

(A) Correlation of the expression of the tau peptides (y-axis, ng/mL) with the immunoassay concentration (x-axis, pg/ml). (B) Correlation of the SRM-based expression of Aβ42 (y-axis, ng/mL) with the corresponding immunoassay values (x-axis, pg/mL). (C) and correlation of the ratio Aβ42/Amyloid β (y-axis) with the corresponding immunoassay values (x-axis, pg/mL).
The discrepancies between immunoassay and SRM raise the question of the accuracy of either of the assays. When comparing the values obtained by the immunoassay on the standards used for mass spectrometry (quantified by amino acid analysis), we observed a more than 3 fold decrease between the expected concentration and the measured value (Table S-2), suggesting that the immunoassay might underestimate the “true” concentration. Inversely, the quantification of the MSD standards by SRM showed that the concentration was 30 times higher than the labeled concentration for the standard (Table S-2). Taken together, those differences led to more than a hundred fold difference between the two assays, which may at least partially explain the discrepancies in CSF tau concentrations measured by the immunoassay and SRM.
Regarding the Aβ peptides targeted in this assay, the chymotryptic peptide corresponding to the C-terminal portion of Aβ42 significantly correlates (ρ=0.56, p<0.05) with the previous data (figure 3B). The concentration for Aβ42 obtained by SRM are however thirty two times higher than the concentration measured with immunoassay for Aβ1–42 specifically. On the contrary, the tryptic peptide LVFFAEDVGSNK and the chymotryptic peptide AEDVGSNKGAIIGL did not correlate with the immunoassay values (figure S-5A and B). Additionally, the shared peptides characterize the global expression of amyloid β, including its truncated forms, such as Aβ1–40, Aβ1–38, P3 and so on., but exclude the soluble form of APP such as sAPP-α and sAPP-β. We thus evaluated the ratio of Aβ42 we measured in our assay over the global expression of amyloid β (Aβ42/Amyloid β). To do so we divided the expression of the peptides produced by chymotrypsin –MVGGVVIA (C-terminus of Aβ1–42) divided by AEDVGSNKGAIIGL (shared between several amyloid β forms, such as Aβ1–40, Aβ1–38, P3 etc.). Interestingly, the ratio (Aβ42/Amyloid β) significantly correlated (ρ=0.52, p<0.05) with the immunoassay values (figure 3C).
Evaluation of the discrimination of the assay
To further validate the performance of our assay, we evaluated the benefits provided by the SRM assay comparing healthy control, patients with MCI patients and AD patients (n=10 in each group). The SRM results for tau showed significant differences between healthy control, MCI and AD subjects (p<0.001, figure S-6A). Aβ on the contrary, shows a nonsignificant decrease in MCI and AD (p=0.46, figure 4A). This can be explained by the proteoform targeted in our assay. By measuring the C-terminal peptide of Aβ1–42 the quantities are exposed to interferences from other proteoforms that contain this region of the peptide, for example, forms truncated at the N-terminal portion. The difference between healthy control and demented patients was, however, improved with the ratio Aβ42/Amyloid β, which displays a significant difference between healthy control and MCI and AD (p(Ctl-AD)<0.0001, p(Ctl-MCI)<0.0001, figure 4B)
Figure 4.

(A) Aβ42, measured with SRM indicates no significant differences between healthy control, MCI patients and AD patients. (B) The ratio Aβ42/Amyloid β displays a significant (p<0.0001) difference between healthy control, MCI patients (p(control-MCI)<0.0001) and AD patients(p(control-AD)<0.0001). (C) The ratio tau/Aβ, measured with SRM indicates a significant (p<0.001) difference between healthy control, MCI patients and AD patients (p(control-AD)<0.0005). (D) The ratio tau/Aβ measured with MSD displays a significant (p<0.001) difference between healthy control, MCI patients (p(control-MCI)<0.005) and AD patients(p(control-AD)<0.0001).
Taken together as a ratio (Tau/Aβ) the comparison of healthy control, MCI and AD subjects (figure 4C) shows significant differences (p<0.001), similar to the immunoassay data (p<0.0005, figure 4D). Furthermore, this is illustrated by the ROC curve, presented in figure 5A, indicating that the tau/Aβ ratio could discriminate MCI patients and healthy control or AD patients and healthy control quite well (AUC= 0.96 for both conditions). In contrast the ROC curve comparing AD and MCI displays a moderate level of discrimination (AUC=0.71), possibly reflecting the heterogeneity of MCI disease, which features a possible evolution to AD. Those values remain fairly comparable to the ROC curves obtained with the same set of samples measured with MSD (AUC(control-AD)= 1, AUC(Control-MCI)=0.85, AUC(MCI-AD)=0.69, figure S-7). Finally, to isolate the performance of the relative level of Aβ42, we normalized it to the total level of Amyloid β (i.e. Aβ42/Amyloid β) and compared the use of the ratio tau/(Aβ42/Amyloid β) to the ratio tau/Aβ42. We showed first that the Aβ42/Amyloid β ratio significantly improves the difference between MCI and AD patients (p<0.05, figure 5B). The additional ratio also improved the discrimination between healthy control, MCI and AD demonstrated with the ROC curve (AUC(Control-AD)= 1, AUC(Control-MCI)=1, AUC(MCI-AD)=0.76, figure 5C). It should be noted that, due to the small sample size, the ROC curve analysis here remains quite preliminary, and thus further evaluation is needed to validate this result in future studies using a larger number of cases.
Figure 5.

(A) the ROC curve based on the ratio tau/Aβ obtained with our SRM assay shows a good discrimination comparing healthy control to AD (blue, AUC= 0.96) or to MCI (green, AUC= 0.96). The discrimination between MCI and AD remains fair (red, AUC= 0.71). (B) The ratio Tau/(Aβ42/Amyloid β) indicated a significant (p<0.0001) difference between healthy controls and AD patients (p(Ctl-AD)<0.0001) as well as a significant difference between MCI and AD patients (p(MCI-AD)<0.05). (C) The ROC curve based on the ratio tau/(Aβ42/Amyloid β) shows a good discrimination comparing healthy control to AD (dashed blue, AUC= 1) or to MCI (green, AUC= 1). The discrimination between MCI and AD remains fair (red, AUC= 0.76). (D) Based on the results of our SRM assay, the ratio Tau/(Aβ42/Amyloid β) shows a significant negative correlation with the MMSE score (ρ=−0.65, p<0.001).
Finally, to further evaluate the performance of the assay, we compared the new ratio tau/(Aβ42/Amyloid β) to the neurological evaluation of the patients (MMSE). The ratio significantly and negatively correlated (ρ=−0.65, p<0.001) with mental state of the patients (figure 5D). The correlation between tau/Aβ and MMSE was not demonstrated before; however, using the data obtained by MSD, this correlation was also true (data not shown). The improvement provided by the new ratio as well as the statistical evalutation of the analytes measured in our assays are sumarized in table 3.
Table 3.
Summary of the statistical values for the analytes monitored with SRM
| Protein or ratio |
Significance | P(Ctl-AD) | P(Ctl-MCI) | P(MCI-AD) | AUC(Ctl-AD) | Sensitivity/ Specificity |
AUC(Ctl-MCI) | Sensitivity/ Specificity |
AUC(MCI-AD) | Sensitivity/ Specificity |
|---|---|---|---|---|---|---|---|---|---|---|
| Tau | <0.0005 | <0.0001 | ns | <0.05 | 1 | 80%/100% | 0.92 | 100%/100% | 0.77 | 80%/70% |
| Aβ42 | ns | ns | ns | ns | 0.62 | 70%/80% | 0.68 | 70%/80% | 0.51 | 30%/90% |
| Aβ42/Amyloid β | <0.0001 | <0.0001 | <0.0001 | ns | 0.98 | 90%/100% | 0.96 | 90%/100% | 0.66 | 65%/65% |
| Tau/Aβ42 | <0.001 | <0.001 | ns | ns | 0.96 | 80%/100% | 0.96 | 100%/100% | 0.71 | 80%/100% |
| Tau/(Aβ42/Amyloid β) | <0.0001 | <0.0001 | ns | <0.05 | 1 | 100%/100% | 1 | 100%/100% | 0.76 | 60%/90% |
Non-significant values are reported as ns
Discussion
This study presents important advancements regarding measuring tau and Aβ42 in CSF using antibody-free, mass spectrometry-based methods. First, we made it possible to measure CSF tau and Aβ peptides in parallel. Second, we developed methods to quantify peptides specifically derived from tau and Aβ42, and when tested on a small cohort of samples, significant diagnostic group differences were observed. Third, we show that in our assay the ratio of Aβ42 to the global expression of amyloid β significantly improves the diagnostic utility of our SRM assay. And fourth, we also showed a significant negative correlation between the ratio generated with our assay and the MMSE score.
The rationale for developing a new assay for both analytes together is mainly the adaptation to the downstream method of measurement. Indeed, the most universal method of liquid chromatography coupled to mass spectrometry is a reverse phase method under acidic conditions, using acetonitrile as the organic solvent for elution. The previous successful methodologies used to quantify either tau or Aβ1–42 employed liquid chromatography separation more specific to their purposes. For the tau peptides, the mobile phase contained water and formic acid and the elution was performed with a mix of methanol and formic acid. On the contrary, the nondigested form of Aβ1–42 was transported in a liquid phase containing water, acetonitrile and ammonia and eluted in a buffer containing acetonitrile, methanol and trifluoroethanol. These liquid chromatography methods are quite different, and would thus either require replacing the liquids in the chromatography system between runs, or using two liquid chromatography systems in parallel. In these cases it is not practical to measure both analytes in parallel in a single system. Therefore, we sought to identify a fractionation strategy suitable for solving multiple challenges: first, allowing separation and detection of both Aβ42 and tau peptides under the same conditions, and second, sufficient simplification of the CSF sample to allow observation of low-abundance tau peptides without predigestion enrichment, such as was necessary in previous studies (19), (31), (32). The strategy we developed allows the simultaneous detection of peptides from tau and other protein species like Aβ. For the postdigestion fractionation, several options were available (ion exchange, SPE, IEF, etc.). We chose high pH reverse phase fractionation, as it is highly robust and produces fractions compatible with mass spectrometry with limited processing between the fractionation and the mass spectrometry measurement. In addition this method was previously employed for Aβ peptides and proven valuable (33).
Another difficulty was the discrimination of Aβ1–42 from the other proteoforms of amyloid β. To circumvent this problem, as trypsin did not generate peptides specific to Aβ42 that could be detected with mass spectrometry under our conditions, we utilized a different enzyme. Indeed, chymotrypsin digestion provided us with two peptides that covered the shared part of the peptide sequence and the C-terminal part of Aβ1–42. With the peptide common to several amyloid β proteoforms, we were able to compare the digests between enzymes, certifying the reliability of the digest. On the contrary, the C-terminal peptide was more representative of the expression of Aβ1–42, and it correlated with the expression of Aβ1–42 previously measured by immunoassay (14). Comparing the absolute concentrations measured with SRM with the immunoassay results we observed higher concentrations with SRM. The concentrations measured here, in the lower nanogram per mililiter range, are comparable to previous studies (20) where the concentrations of Aβ were in the higher picogram to lower nanogram per milliliter range. The slight difference between the SRM assays could result from several factors such as sample collection, handling and preparation. Additionally, recent discoveries (34) showed that the ratio of Aβ1–42 to either Aβ1–40 or Aβ1–38 improves the diagnostic value of Aβ1–42. While we did not measure peptides from Aβ1–40 or Aβ1–38 in our assay, we did monitor an additional peptide, which is shared between several proteoforms of amyloid β, including Aβ1–40 and Aβ1–38. The ratio of these two peptides (Aβ42/Amyloid β) allowed us to improve the diagnostic significance of our assay, similar to the findings using Aβ1–40 or Aβ1–38. Developing assays to monitor these two peptides specifically may be desirable in the future, but it is also worth noting that the C-terminal peptide we monitor in the current assay is eight amino acids long, and is already at the lower limit regarding the peptide length measurable with SRM. The C-terminal peptides for Aβ1–40 and Aβ1–38, using chymotrypsin, would be six and four amino acid long respectively, making their detection difficult. Thus, alternative strategies and additional assay development will be necessary to measure these proteoforms specifically.
The level of expression of tau measured by SRM was substantially higher than that obtained with immunoassays. This difference resulted from a combination of multiple factors. First, the immunoassay appears to underestimate even the amount of standard proteins (Table S-2). Second, tau is a protein displaying a large variety of fragments, either produced by alternative splicing (35), (36) or by post-translational modification as already observed in the brain tissues (37). The isoform or isoforms included in an immunoassay depend on the antibodies used to capture and detect the analyte. As a result, the quantitative values provided by the immunoassay represent a portion of the isoform of tau forms. On the contrary, the SRM approach likely combines more isoforms (unmodified ones in this study) and measures the total concentration for all forms containing the target peptide(s). Thus a direct comparison between immunoassay and SRM remains difficult. Thrid, the immunoassays, to which we compared our results, targeted total tau protein, including its isoforms, according to the manufacturer. However, considering that capture and detection antibodies must bind at two different positions along the sequence of the protein, any cleavage or truncation of tau between those two epitopes would lead to an absence of detection and thus reduce the final concentration, which is at least a theoretical possibility given that the specificity of the antibodies for each tau isoforms remains to be completely defined. Additionally, tau is known to be highly modified and post-translational modifications (PTMs) can certainly result in changes in antibody affinity in immunoassays and reduction of SRM signal. Of note, analyzing PTMs of tau and Aβ species is currently being carried out in our laboratory. Fourth, Barthelemy et al. (32) showed that the apparent expression of tau peptides varies depending on their position within the sequence, which suggested that depending on the position of the capture and detection antibodies‘ epitopes, the measured tau concentrations may vary significantly. With the limited information regarding the commercial kit that was used for the immuno-detection of tau, we cannot compare any further the absolute concentration measured by SRM and the concentration obtained by immunoassay. However, this may also explain why we see differences between our three tau peptides, knowing that STPTAEDVTAPLVDEGAPGK is located at the N-terminal portion of the protein, in the N2 region of tau, and TPSLPTPPTR and SGYSSPGSPGTPGSR are part of the core of tau. In addition, Barthelemy et al. (32) also observed a twenty fold difference when comparing their ELISA and SRM assays, illustrating the difference we could expect when comparing ELISA and SRM on the same region of the protein. When comparing the absolute concentration for tau, measured with SRM, our current values are consistent with previous studies (19), and the concentrations in both cases are in the nanogram per milliliter range. Despite the inherent differences between mass spectrometry and immuno-based methods, it is possible to measure similar trend of expression with SRM and immunoassays.
More importantly, we confirmed the diagnostic utility of our assay through validating the power of the assay for the discrimination of AD, MCI and healthy control subjects. As described in previous studies (38), a ratio gathering the expression from Aβ and tau proteins performs better than each protein taken individually. Also, based on the results of the current assay, we are able to differentiate MCI and AD patients from healthy controls. Nevertheless, as we showed here that the ratio Aβ42/Amyloid β improves the diagnostic efficiency of Aβ42 we gathered this ratio with the expression of tau, creating a slightly more complex ratio, that is tau/(Aβ42/Amyloid β). This combination of values was also an improvement as it allowed a significant discrimination of healthy control and MCI patients. Moreover, with our current set of data and our improved ratio, we identified a significant negative correlation between the tau/Aβ ratio and the MMSE, indicating a relationship between this ratio and the disease severity. This correlation suggests the potential of using tau/Aβ ratio as a disease progression marker, although it requires additional investigation. For example, a longitudinal sample cohort could be used to track time-related changes during the progression of AD. As a methodology study and proof of concept, we only utilized a small number of clinical samples (30 in total), and thus our results will require further confirmation with larger sample cohorts in future studies. However, the significant group differences and correlations we observed with such a small sample size in this study suggest the robustness of our SRM assay.
In summary, to the best of our knowledge, this is the first time that CSF tau and Aβ42 are targeted in parallel with SRM assay. Using the technology established here AD and MCI subjects were differentiated from healthy controls, with at least equivalent diagnostic utility to immunoassays. Furthermore, regarding the diagnostic power of both markers separately, it would be acceptable to use only one of those markers for the diagnostic of MCI and AD, but it is also clear that the combination of both markers makes this assay more robust. Although our SRM assay needs to be further validated in larger cohorts, this could at least serve as a reference method for CSF tau and Aβ1–42 measurements. The validation of this assay will also need to include additional pathologies, especially other tauopathies such as progressive supranuclear palsy and certain forms of frontotemporal dementia. Also, with the same technology, we are currently investigating additional biomarkers that could monitor other aspects of AD pathology and combining them with tau and Aβ42, with the intension to further differentiate AD from other dementias and closely follow the disease progression.
Supplementary Material
Table S-1: list of transitions monitored during the SRM assay
Table S-2: table showing the difference between the expected concentration and the measured concentration using MSD-based and Mass spectrometry-based assays
Figure S-1: Chromatogram before and after fractionation tau peptides
Figure S-2: Correlation of the expression of the peptides shared between proteoforms of amyloid β generated by Trypsin and Chymotrypsin
Figure S-3: Standard curves generated for tau peptides and amyloid β peptides
Figure S-4: Correlation of the SRM-based expression of the peptide STPTAEDVTAPLVDEGAPGK with the corresponding tau immunoassay values
Figure S-5: Correlation of the shared peptides of Aβ generated by Trypsin and Chymotrypsin with the immunoassay values
Figure S-6: Expression of tau in CSF samples measured by SRM assay
Figure S-7: ROC curves obtained with the ratio tau/Aβ1–42 based on the immunoassay results
Acknowledgments
We deeply appreciate the participants for their generous donation of samples. This study was supported by grants from the National Institutes of Health (NIH) (U01 NS091272, U01 NS082137, P30 ES007033-8649, R01 ES016873, and R01 ES019277 to JZ, and P50 AG05131 to D.R.G.).). It was also supported in part by the University of Washington's Proteomics Resource (UWPR95794). The content is solely the responsibility of the authors and does not necessarily represent the official views of the NIH and other sponsors.
Footnotes
Conflict of interest
The authors declare no competing financial interest.
References
- 1.Blennow K, de Leon MJ, Zetterberg H. Alzheimer's disease. Lancet. 2006;368(9533):387–403. doi: 10.1016/S0140-6736(06)69113-7. [DOI] [PubMed] [Google Scholar]
- 2.Snyder SW, Ladror US, Wade WS, Wang GT, Barrett LW, Matayoshi ED, Huffaker HJ, Krafft GA, Holzman TF. Amyloid-beta aggregation: selective inhibition of aggregation in mixtures of amyloid with different chain lengths. Biophys J. 1994;67(3):1216–28. doi: 10.1016/S0006-3495(94)80591-0. [DOI] [PMC free article] [PubMed] [Google Scholar]
- 3.Wong DF, Rosenberg PB, Zhou Y, Kumar A, Raymont V, Ravert HT, Dannals RF, Nandi A, Brasic JR, Ye W, Hilton J, Lyketsos C, Kung HF, Joshi AD, Skovronsky DM, Pontecorvo MJ. In vivo imaging of amyloid deposition in Alzheimer disease using the radioligand 18F-AV-45 (florbetapir [corrected] F 18) J Nucl Med. 2010;51(6):913–20. doi: 10.2967/jnumed.109.069088. [DOI] [PMC free article] [PubMed] [Google Scholar]
- 4.Klunk WE, Engler H, Nordberg A, Wang Y, Blomqvist G, Holt DP, Bergstrom M, Savitcheva I, Huang GF, Estrada S, Ausen B, Debnath ML, Barletta J, Price JC, Sandell J, Lopresti BJ, Wall A, Koivisto P, Antoni G, Mathis CA, Langstrom B. Imaging brain amyloid in Alzheimer's disease with Pittsburgh Compound-B. Ann Neurol. 2004;55(3):306–19. doi: 10.1002/ana.20009. [DOI] [PubMed] [Google Scholar]
- 5.Hulstaert F, Blennow K, Ivanoiu A, Schoonderwaldt HC, Riemenschneider M, De Deyn PP, Bancher C, Cras P, Wiltfang J, Mehta PD, Iqbal K, Pottel H, Vanmechelen E, Vanderstichele H. Improved discrimination of AD patients using beta-amyloid(1–42) and tau levels in CSF. Neurology. 1999;52(8):1555–62. doi: 10.1212/wnl.52.8.1555. [DOI] [PubMed] [Google Scholar]
- 6.Hansson O, Zetterberg H, Buchhave P, Londos E, Blennow K, Minthon L. Association between CSF biomarkers and incipient Alzheimer's disease in patients with mild cognitive impairment: a follow-up study. Lancet Neurol. 2006;5(3):228–34. doi: 10.1016/S1474-4422(06)70355-6. [DOI] [PubMed] [Google Scholar]
- 7.Mattsson N, Zetterberg H, Hansson O, Andreasen N, Parnetti L, Jonsson M, Herukka SK, van der Flier WM, Blankenstein MA, Ewers M, Rich K, Kaiser E, Verbeek M, Tsolaki M, Mulugeta E, Rosen E, Aarsland D, Visser PJ, Schroder J, Marcusson J, de Leon M, Hampel H, Scheltens P, Pirttila T, Wallin A, Jonhagen ME, Minthon L, Winblad B, Blennow K. CSF biomarkers and incipient Alzheimer disease in patients with mild cognitive impairment. JAMA. 2009;302(4):385–93. doi: 10.1001/jama.2009.1064. [DOI] [PubMed] [Google Scholar]
- 8.Tapiola T, Alafuzoff I, Herukka SK, Parkkinen L, Hartikainen P, Soininen H, Pirttila T. Cerebrospinal fluid {beta}-amyloid 42 and tau proteins as biomarkers of Alzheimer-type pathologic changes in the brain. Arch Neurol. 2009;66(3):382–9. doi: 10.1001/archneurol.2008.596. [DOI] [PubMed] [Google Scholar]
- 9.Pannee J, Portelius E, Minthon L, Gobom J, Andreasson U, Zetterberg H, Hansson O, Blennow K. Reference measurement procedure for CSF Abeta1–42 and the CSF Abeta1–42 /Abeta1–40 ratio - a cross-validation study against Amyloid PET. J Neurochem. 2016 doi: 10.1111/jnc.13838. [DOI] [PubMed] [Google Scholar]
- 10.Buerger K, Ewers M, Pirttila T, Zinkowski R, Alafuzoff I, Teipel SJ, DeBernardis J, Kerkman D, McCulloch C, Soininen H, Hampel H. CSF phosphorylated tau protein correlates with neocortical neurofibrillary pathology in Alzheimer's disease. Brain. 2006;129(Pt 11):3035–41. doi: 10.1093/brain/awl269. [DOI] [PubMed] [Google Scholar]
- 11.Chhatwal JP, Schultz AP, Marshall GA, Boot B, Gomez-Isla T, Dumurgier J, LaPoint M, Scherzer C, Roe AD, Hyman BT, Sperling RA, Johnson KA. Temporal T807 binding correlates with CSF tau and phospho-tau in normal elderly. Neurology. 2016;87(9):920–6. doi: 10.1212/WNL.0000000000003050. [DOI] [PMC free article] [PubMed] [Google Scholar]
- 12.Motter R, Vigo-Pelfrey C, Kholodenko D, Barbour R, Johnson-Wood K, Galasko D, Chang L, Miller B, Clark C, Green R, et al. Reduction of beta-amyloid peptide42 in the cerebrospinal fluid of patients with Alzheimer's disease. Ann Neurol. 1995;38(4):643–8. doi: 10.1002/ana.410380413. [DOI] [PubMed] [Google Scholar]
- 13.Olsson A, Vanderstichele H, Andreasen N, De Meyer G, Wallin A, Holmberg B, Rosengren L, Vanmechelen E, Blennow K. Simultaneous measurement of beta-amyloid(1–42), total tau, and phosphorylated tau (Thr181) in cerebrospinal fluid by the xMAP technology. Clin Chem. 2005;51(2):336–45. doi: 10.1373/clinchem.2004.039347. [DOI] [PubMed] [Google Scholar]
- 14.Pan C, Korff A, Galasko D, Ginghina C, Peskind E, Li G, Quinn J, Montine TJ, Cain K, Shi M, Zhang J. Diagnostic Values of Cerebrospinal Fluid T-Tau and Abeta(4)(2) using Meso Scale Discovery Assays for Alzheimer's Disease. J Alzheimers Dis. 2015;45(3):709–19. doi: 10.3233/JAD-143099. [DOI] [PMC free article] [PubMed] [Google Scholar]
- 15.Mattsson N, Andreasson U, Persson S, Arai H, Batish SD, Bernardini S, Bocchio-Chiavetto L, Blankenstein MA, Carrillo MC, Chalbot S, Coart E, Chiasserini D, Cutler N, Dahlfors G, Duller S, Fagan AM, Forlenza O, Frisoni GB, Galasko D, Galimberti D, Hampel H, Handberg A, Heneka MT, Herskovits AZ, Herukka SK, Holtzman DM, Humpel C, Hyman BT, Iqbal K, Jucker M, Kaeser SA, Kaiser E, Kapaki E, Kidd D, Klivenyi P, Knudsen CS, Kummer MP, Lui J, Llado A, Lewczuk P, Li QX, Martins R, Masters C, McAuliffe J, Mercken M, Moghekar A, Molinuevo JL, Montine TJ, Nowatzke W, O'Brien R, Otto M, Paraskevas GP, Parnetti L, Petersen RC, Prvulovic D, de Reus HP, Rissman RA, Scarpini E, Stefani A, Soininen H, Schroder J, Shaw LM, Skinningsrud A, Skrogstad B, Spreer A, Talib L, Teunissen C, Trojanowski JQ, Tumani H, Umek RM, Van Broeck B, Vanderstichele H, Vecsei L, Verbeek MM, Windisch M, Zhang J, Zetterberg H, Blennow K. The Alzheimer's Association external quality control program for cerebrospinal fluid biomarkers. Alzheimers Dement. 2011;7(4):386–395. e6. doi: 10.1016/j.jalz.2011.05.2243. [DOI] [PMC free article] [PubMed] [Google Scholar]
- 16.Mattsson N, Andreasson U, Persson S, Carrillo MC, Collins S, Chalbot S, Cutler N, Dufour-Rainfray D, Fagan AM, Heegaard NH, Robin Hsiung GY, Hyman B, Iqbal K, Kaeser SA, Lachno DR, Lleo A, Lewczuk P, Molinuevo JL, Parchi P, Regeniter A, Rissman RA, Rosenmann H, Sancesario G, Schroder J, Shaw LM, Teunissen CE, Trojanowski JQ, Vanderstichele H, Vandijck M, Verbeek MM, Zetterberg H, Blennow K. CSF biomarker variability in the Alzheimer's Association quality control program. Alzheimers Dement. 2013;9(3):251–61. doi: 10.1016/j.jalz.2013.01.010. [DOI] [PMC free article] [PubMed] [Google Scholar]
- 17.Kruse N, Persson S, Alcolea D, Bahl JM, Baldeiras I, Capello E, Chiasserini D, Bocchio Chiavetto L, Emersic A, Engelborghs S, Eren E, Fladby T, Frisoni G, Garcia-Ayllon MS, Genc S, Gkatzima O, Heegaard NH, Janeiro AM, Kovacech B, Kuiperij HB, Leitao MJ, Lleo A, Martins M, Matos M, Mollergard HM, Nobili F, Ohrfelt A, Parnetti L, de Oliveira CR, Rot U, Saez-Valero J, Struyfs H, Tanassi JT, Taylor P, Tsolaki M, Vanmechelen E, Verbeek MM, Zilka N, Blennow K, Zetterberg H, Mollenhauer B. Validation of a quantitative cerebrospinal fluid alpha-synuclein assay in a European-wide interlaboratory study. Neurobiol Aging. 2015;36(9):2587–96. doi: 10.1016/j.neurobiolaging.2015.05.003. [DOI] [PubMed] [Google Scholar]
- 18.Oeckl P, Metzger F, Nagl M, von Arnim CA, Halbgebauer S, Steinacker P, Ludolph AC, Otto M. Alpha-, Beta-, and Gamma-synuclein Quantification in Cerebrospinal Fluid by Multiple Reaction Monitoring Reveals Increased Concentrations in Alzheimer's and Creutzfeldt-Jakob Disease but No Alteration in Synucleinopathies. Mol Cell Proteomics. 2016;15(10):3126–3138. doi: 10.1074/mcp.M116.059915. [DOI] [PMC free article] [PubMed] [Google Scholar]
- 19.Bros P, Vialaret J, Barthelemy N, Delatour V, Gabelle A, Lehmann S, Hirtz C. Antibody-free quantification of seven tau peptides in human CSF using targeted mass spectrometry. Front Neurosci. 2015;9:302. doi: 10.3389/fnins.2015.00302. [DOI] [PMC free article] [PubMed] [Google Scholar]
- 20.Korecka M, Waligorska T, Figurski M, Toledo JB, Arnold SE, Grossman M, Trojanowski JQ, Shaw LM. Qualification of a surrogate matrix-based absolute quantification method for amyloid-beta(4)(2) in human cerebrospinal fluid using 2D UPLC-tandem mass spectrometry. J Alzheimers Dis. 2014;41(2):441–51. doi: 10.3233/JAD-132489. [DOI] [PMC free article] [PubMed] [Google Scholar]
- 21.Lame ME, Chambers EE, Blatnik M. Quantitation of amyloid beta peptides Abeta(1–38), Abeta(1–40), and Abeta(1–42) in human cerebrospinal fluid by ultra-performance liquid chromatography-tandem mass spectrometry. Anal Biochem. 2011;419(2):133–9. doi: 10.1016/j.ab.2011.08.010. [DOI] [PubMed] [Google Scholar]
- 22.Leinenbach A, Pannee J, Dulffer T, Huber A, Bittner T, Andreasson U, Gobom J, Zetterberg H, Kobold U, Portelius E, Blennow K. Mass spectrometry-based candidate reference measurement procedure for quantification of amyloid-beta in cerebrospinal fluid. Clin Chem. 2014;60(7):987–94. doi: 10.1373/clinchem.2013.220392. [DOI] [PubMed] [Google Scholar]
- 23.Holman SW, Sims PF, Eyers CE. The use of selected reaction monitoring in quantitative proteomics. Bioanalysis. 2012;4(14):1763–86. doi: 10.4155/bio.12.126. [DOI] [PubMed] [Google Scholar]
- 24.Addona TA, Abbatiello SE, Schilling B, Skates SJ, Mani DR, Bunk DM, Spiegelman CH, Zimmerman LJ, Ham AJ, Keshishian H, Hall SC, Allen S, Blackman RK, Borchers CH, Buck C, Cardasis HL, Cusack MP, Dodder NG, Gibson BW, Held JM, Hiltke T, Jackson A, Johansen EB, Kinsinger CR, Li J, Mesri M, Neubert TA, Niles RK, Pulsipher TC, Ransohoff D, Rodriguez H, Rudnick PA, Smith D, Tabb DL, Tegeler TJ, Variyath AM, Vega-Montoto LJ, Wahlander A, Waldemarson S, Wang M, Whiteaker JR, Zhao L, Anderson NL, Fisher SJ, Liebler DC, Paulovich AG, Regnier FE, Tempst P, Carr SA. Multi-site assessment of the precision and reproducibility of multiple reaction monitoring-based measurements of proteins in plasma. Nat Biotechnol. 2009;27(7):633–41. doi: 10.1038/nbt.1546. [DOI] [PMC free article] [PubMed] [Google Scholar]
- 25.Prakash A, Rezai T, Krastins B, Sarracino D, Athanas M, Russo P, Zhang H, Tian Y, Li Y, Kulasingam V, Drabovich A, Smith CR, Batruch I, Oran PE, Fredolini C, Luchini A, Liotta L, Petricoin E, Diamandis EP, Chan DW, Nelson R, Lopez MF. Interlaboratory reproducibility of selective reaction monitoring assays using multiple upfront analyte enrichment strategies. J Proteome Res. 2012;11(8):3986–95. doi: 10.1021/pr300014s. [DOI] [PMC free article] [PubMed] [Google Scholar]
- 26.Blennow K, Hampel H, Weiner M, Zetterberg H. Cerebrospinal fluid and plasma biomarkers in Alzheimer disease. Nat Rev Neurol. 2010;6(3):131–44. doi: 10.1038/nrneurol.2010.4. [DOI] [PubMed] [Google Scholar]
- 27.Fagan AM, Roe CM, Xiong C, Mintun MA, Morris JC, Holtzman DM. Cerebrospinal fluid tau/beta-amyloid(42) ratio as a prediction of cognitive decline in nondemented older adults. Arch Neurol. 2007;64(3):343–9. doi: 10.1001/archneur.64.3.noc60123. [DOI] [PubMed] [Google Scholar]
- 28.Shi M, Bradner J, Hancock AM, Chung KA, Quinn JF, Peskind ER, Galasko D, Jankovic J, Zabetian CP, Kim HM, Leverenz JB, Montine TJ, Ginghina C, Kang UJ, Cain KC, Wang Y, Aasly J, Goldstein D, Zhang J. Cerebrospinal fluid biomarkers for Parkinson disease diagnosis and progression. Ann Neurol. 2011;69(3):570–80. doi: 10.1002/ana.22311. [DOI] [PMC free article] [PubMed] [Google Scholar]
- 29.McKhann G, Drachman D, Folstein M, Katzman R, Price D, Stadlan EM. Clinical diagnosis of Alzheimer's disease: report of the NINCDS-ADRDA Work Group under the auspices of Department of Health and Human Services Task Force on Alzheimer's Disease. Neurology. 1984;34(7):939–44. doi: 10.1212/wnl.34.7.939. [DOI] [PubMed] [Google Scholar]
- 30.Shi T, Fillmore TL, Sun X, Zhao R, Schepmoes AA, Hossain M, Xie F, Wu S, Kim JS, Jones N, Moore RJ, Pasa-Tolic L, Kagan J, Rodland KD, Liu T, Tang K, Camp DG, 2nd, Smith RD, Qian WJ. Antibody-free, targeted mass-spectrometric approach for quantification of proteins at low picogram per milliliter levels in human plasma/serum. Proc Natl Acad Sci U S A. 2012;109(38):15395–400. doi: 10.1073/pnas.1204366109. [DOI] [PMC free article] [PubMed] [Google Scholar]
- 31.Barthelemy NR, Fenaille F, Hirtz C, Sergeant N, Schraen-Maschke S, Vialaret J, Buee L, Gabelle A, Junot C, Lehmann S, Becher F. Tau Protein Quantification in Human Cerebrospinal Fluid by Targeted Mass Spectrometry at High Sequence Coverage Provides Insights into Its Primary Structure Heterogeneity. J Proteome Res. 2016;15(2):667–76. doi: 10.1021/acs.jproteome.5b01001. [DOI] [PubMed] [Google Scholar]
- 32.Barthelemy NR, Gabelle A, Hirtz C, Fenaille F, Sergeant N, Schraen-Maschke S, Vialaret J, Buee L, Junot C, Becher F, Lehmann S. Differential Mass Spectrometry Profiles of Tau Protein in the Cerebrospinal Fluid of Patients with Alzheimer's Disease, Progressive Supranuclear Palsy, and Dementia with Lewy Bodies. J Alzheimers Dis. 2016;51(4):1033–43. doi: 10.3233/JAD-150962. [DOI] [PubMed] [Google Scholar]
- 33.Kim JS, Ahn HS, Cho SM, Lee JE, Kim Y, Lee C. Detection and quantification of plasma amyloid-beta by selected reaction monitoring mass spectrometry. Anal Chim Acta. 2014;840:1–9. doi: 10.1016/j.aca.2014.06.024. [DOI] [PubMed] [Google Scholar]
- 34.Janelidze S, Zetterberg H, Mattsson N, Palmqvist S, Vanderstichele H, Lindberg O, van Westen D, Stomrud E, Minthon L, Blennow K, Swedish Bio Fsg, Hansson O. CSF Abeta42/Abeta40 and Abeta42/Abeta38 ratios: better diagnostic markers of Alzheimer disease. Ann Clin Transl Neurol. 2016;3(3):154–65. doi: 10.1002/acn3.274. [DOI] [PMC free article] [PubMed] [Google Scholar]
- 35.Andreadis A. Tau gene alternative splicing: expression patterns, regulation and modulation of function in normal brain and neurodegenerative diseases. Biochim Biophys Acta. 2005;1739(2–3):91–103. doi: 10.1016/j.bbadis.2004.08.010. [DOI] [PubMed] [Google Scholar]
- 36.Caillet-Boudin ML, Buee L, Sergeant N, Lefebvre B. Regulation of human MAPT gene expression. Mol Neurodegener. 2015;10:28. doi: 10.1186/s13024-015-0025-8. [DOI] [PMC free article] [PubMed] [Google Scholar]
- 37.Meredith JE, Jr, Sankaranarayanan S, Guss V, Lanzetti AJ, Berisha F, Neely RJ, Slemmon JR, Portelius E, Zetterberg H, Blennow K, Soares H, Ahlijanian M, Albright CF. Characterization of novel CSF Tau and ptau biomarkers for Alzheimer's disease. PLoS One. 2013;8(10):e76523. doi: 10.1371/journal.pone.0076523. [DOI] [PMC free article] [PubMed] [Google Scholar]
- 38.Formichi P, Battisti C, Radi E, Federico A. Cerebrospinal fluid tau, A beta, and phosphorylated tau protein for the diagnosis of Alzheimer's disease. J Cell Physiol. 2006;208(1):39–46. doi: 10.1002/jcp.20602. [DOI] [PubMed] [Google Scholar]
Associated Data
This section collects any data citations, data availability statements, or supplementary materials included in this article.
Supplementary Materials
Table S-1: list of transitions monitored during the SRM assay
Table S-2: table showing the difference between the expected concentration and the measured concentration using MSD-based and Mass spectrometry-based assays
Figure S-1: Chromatogram before and after fractionation tau peptides
Figure S-2: Correlation of the expression of the peptides shared between proteoforms of amyloid β generated by Trypsin and Chymotrypsin
Figure S-3: Standard curves generated for tau peptides and amyloid β peptides
Figure S-4: Correlation of the SRM-based expression of the peptide STPTAEDVTAPLVDEGAPGK with the corresponding tau immunoassay values
Figure S-5: Correlation of the shared peptides of Aβ generated by Trypsin and Chymotrypsin with the immunoassay values
Figure S-6: Expression of tau in CSF samples measured by SRM assay
Figure S-7: ROC curves obtained with the ratio tau/Aβ1–42 based on the immunoassay results