


Abstract
Although a large body of literature exists on the potential use of nanoparticles for medical applications, the number of probes translated into human clinical trials is remarkably small. A major challenge of particle probe development and their translation is the elucidation of safety profiles associated with their structural complexity, not only in terms of size distribution and heterogeneities in particle composition but also their effects on biological activities and the relationship between particle structure and pharmacokinetics. Here, we report on the synthesis, characterization, and long-term stability of ultrasmall (<10 nm diameter) dual-modality (optical and positron emission tomography) and integrintargeting silica nanoparticles (cRGDY–PEG–Cy5–C′ dots and 124I-(or 131I-) cRGDY–PEG–Cy5–C′dots) and the extent to which their surface ligand density differentially modulates key in vitro and in vivo biological activities in melanoma models over a range of ligand numbers (i.e., ~6–18). Gel permeation chromatography, established as an important particle characterization tool, revealed a two-year shelf life for cRGDY–PEG–Cy5–C′ dots. Radiochromatography further demonstrated the necessary radiochemical stability for clinical applications. The results of subsequent ligand density-dependent studies elucidate strong modulations in biological response, including statistically significant increases in integrin-specific targeting and particle uptake, cellular migration and adhesion, renal clearance, and tumor-to-blood ratios with increasing ligand number. We anticipate that nanoprobe characteristics and a better understanding of the structure–function relationships determined in this study will help guide identification of other lead nanoparticle candidates for in vitro and in vivo biological assessments and product translation.
Graphical abstract
INTRODUCTION
Organic–inorganic hybrid nanoparticles are a rapidly expanding, diverse class of materials that can be readily adapted for translation as targeted, multimodality imaging probes for nanomedicine.1 In particular, ultrasmall (i.e., below 10 nm diameter) fluorescent core–shell silica nanoparticles, termed Cornell dots (or C dots), provide a versatile optical materials platform for functionalization, incorporating near-infrared (NIR)-emitting dyes and a variety of targeting ligands and contrast-producing labels (i.e., radiolabels) to yield a product that has been successfully translated into the clinic.2–8 Beyond initial synthesis efforts using the Stöber process in alcohols,2,5,7 newer generation dots referred to as Cornell prime dots (or C′ dots) are now synthesized in aqueous solutions employing a simpler single-batch reaction approach.9 This approach leads to superior particle size control down to a single atomic layer, improved dye incorporation efficiency and brightness, and reproducible surface PEGylation and functionalization with therapeutic moieties.9–11 The attachment of multiple surface functionalities and the ability to synthesize particles tuned to hydrodynamic diameters smaller than the renal clearance cutoff (i.e., <10 nm diameter) confers distinct biological properties for cancer diagnosis and treatment, including favorable biodistribution and pharmacokinetics.7,8,12,13 The small size similar to that of macromolecules or medium size proteins also enables characterizations and purification of C′ dots using techniques well-established in polymer science and the pharmaceutical industry, including chromatography.9 The establishment of appropriate chemical designs for clinical trials and workflows will ultimately rest on an ability to precisely tailor and accurately characterize an array of particle probes with varied size and/or bearing controllable numbers of surface functional groups. As such, an added level of analytical scrutiny is needed to interrogate, optimize, and control the physical properties and surface chemistry of nanoparticles beyond that seen in the literature to date. Specifically, physicochemical characteristics such as size, targeting ligand density, and particle stability must be well-addressed to properly control biological activities spanning the molecular and cellular to whole-body levels.
Indeed, the in vitro and in vivo biological properties of nanoparticles may vary greatly with particle morphology/topology, hydrodynamic size, surface area, and surface reactivity.14 For the sub-10 nm particle size regime, the extent to which biological events driven by binding key cancer targets are modulated by variations in such surface chemical properties such as ligand density is poorly understood. Such information is essential to facilitating a better understanding of a particle’s biological interactions with target sites (i.e., binding affinity, potency, and toxicity), ADME (absorption, distribution, metabolism, and excretion), uptake/retention at sites of disease relative to surrounding tissues, and how such changes may drive dynamic events within cells. Therefore, it is critically important to develop synthesis/manufacturing procedures that precisely and reproducibly control for relevant physicochemical properties, including size, shape, surface charge, colloidal and radiochemical stability, and number of surface moieties.
High resolution chromatographic techniques such as size exclusion/gel permeation chromatography (GPC) and high-performance liquid chromatography (HPLC) are typically limited to molecular compounds but have previously been used in the nanoparticle literature to drive developments in ultrasmall materials research, including size determination of gold clusters and first C′ dot characterizations by HPLC,15–17 GPC analysis of chain lengths for particles surface functionalized via radical polymerization techniques, and C′ dot purity assessments.8,18 The key obstacles limiting the clinical translation and commercialization of nanomedicines are tied, in part, to challenges in the chemistry, manufacturing, and controls (CMC) required to ensure that the final product consistently meets a predetermined standard quality. It is therefore highly desirable to develop and utilize high-resolution analytical approaches such as GPC or HPLC to guarantee highly controllable, reproducible, and scalable particle manufacturing.
Here, we report on the synthesis and characterization of ultrasmall (diameter <10 nm) integrin-targeting and dual-modality C′ dots with different surface ligand numbers for investigating the extent to which particle physicochemical structure modulates in vitro and in vivo biological events. Utilizing a suite of analytical techniques and quantitative molecular imaging tools in melanoma models, we compared C′ dots bearing on average about 6, 14, or 18 integrin-targeting moieties in terms of their physicochemical, imaging, and biological properties. In addition to traditional nanoparticle characterization techniques, a custom-built fluorescence correlation spectroscopy (FCS)2,8,19 setup was used in conjunction with GPC and spectroscopic techniques to assess particle composition and properties and monitor long-term particle stability, revealing a two-year shelf life. Coupling with radiolabeling approaches then enabled variations in the surface chemistry of these sub-10 nm cancer-targeting C′ dots to be correlated with in vitro and in vivo biological activities and pharmacokinetic profiles. Results demonstrate statistically significant increases in integrin-specific targeting and particle uptake, cellular migration and adhesion, renal clearance, and tumor-to-blood ratios with increasing ligand number. We hope our results will help guide identification of other lead nanoparticle candidates for in vitro and in vivo biological assessments and product translation.
RESULTS AND DISCUSSIONS
Summary of C′ Dot Synthesis/Manufacturing
The production of C′ dots for clinical use includes two basic steps, i.e., nanoparticle synthesis and product purification in a controlled environment (Scheme 1).9,10 In short, tetramethyl orthosilicate (TMOS) and fluorescent dye–silane conjugate, e.g., Cy5–silane, were added to an aqueous solution of ammonium hydroxide at pH ~8. The growth of silica nanoparticles is triggered by the fast hydrolysis of silane in water and can be efficiently terminated through the addition of silane functionalized polyethylene glycol (PEG; PEG–silane).20,21 To incorporate cancer-targeting functionalities into C′ dots, cRGDY–PEG–silane, obtained from heterobifunctional PEGs, was added to PEG–silane to attach cRGDY peptides to the PEGylated C′ dot surface.10 When reaction conditions are tuned, including reagent concentrations and reaction times, C′ dot size can be controlled from batch to batch between ~3 to >10 nm with accuracy of better than 1 nm, i.e., at the level of a single atomic layer.9
Scheme 1.

Illustration of C′ Dot Production and Molecular Rendering of 124I-Labeled cRGDY–PEG–Cy5–C′ Dotsa
a(A) Production process of radiolabeled C′ dots for clinical use, including particle synthesis, product purification, and radio-labeling steps. C′ dots are ready for clinical use as optical probes after the purification step. A subsequent radio-labeling step enables use of additional imaging modalities (e.g., PET). (B) Molecular rendering of 124I-labeled cRGDY–PEG–Cy5–C′ dots. The atoms of silicon, oxygen, carbon, nitrogen, sulfur, hydrogen, and iodine are colored in purple, red, gray, blue, yellow, white, and green, respectively. Hydrogen atoms are not displayed in the stick model (left) for better visualization but are displayed in the sphere model (right).
Purification of C′ Dots
For purification, the reaction solution was first dialyzed against water to remove unreacted reagents, e.g., uncondensed PEG–silane and dye–silane. After two cycles of dialysis, the C′ dot solution was up-concentrated via spin filtration. Further purification of C′ dots was then performed using a low-pressure GPC column with 0.9 wt % sodium chloride solution as eluent and cross-linked agarose with covalently attached dextran (GE Healthcare Life Sciences) as stationary phase. The column was calibrated using five standard proteins (Bio-Rad Laboratories) with known molar masses ranging from 1.3 to 670 kDa (Figures 1A and D). A representative GPC trace of C′ dots with encapsulated Cy5 dye and cRGDY targeting ligands attached to the PEGylated surface, referred to as cRGDY–PEG–Cy5–C′ dots, is shown in Figure 1B. It shows three well-separated peaks with elution times around 6, 9, and 12.5 min, respectively, which from FCS measurements on fractions collected for each of these three peaks and following procedures from earlier work can be assigned in the following way:9 the first peak (green in Figure 1B) around 6 min, according to FCS results (Table S1), is associated with around 20 nm diameter particles with relatively low fluorescence brightness. It is attributed to impurities from the starting reagents (i.e., these were not C′ dot aggregates). The last peak (blue in Figure 1B) around 12.5 min with particles of average FCS diameter around 2 nm is assigned to self-condensed Cy5–silane or other small unreacted reagents (Table S1). The central peak around 9 min (red in Figure 1B) corresponds to the main C′ dot product with 6.4 nm diameter (Table S1). According to the GPC calibration, the effective molar mass of these C′ dots is estimated to be between 44 and 158 kDa.9
Figure 1.

GPC purification of cRGDY–PEG–Cy5–C′ dots. (A and D) GPC trace of five standard proteins with known molar mass. Representative GPC traces of cRGDY–PEG–Cy5–C′ dots before (B) and after (C) GPC purification. Examples of GPC traces of aggregated C′ dots before (E) and after (F) GPC purification. Different peaks in the GPC traces are fitted by Gaussian distributions and are colored in green (aggregates), red (C′ dots), and blue (unreacted reagents), respectively.
GPC traces were quantitatively analyzed using fits with linearly independent Gaussian distributions to extract effective yields/estimated purities. Please note that accounting for nonzero values between individual peaks sometimes required two Gaussian distributions for one peak (e.g., see Results for the first, green peak in Table S1). Results of the analysis for the elugram in Figure 1B are summarized in Table S1 and suggested a relative yield, or estimated purity, after dialysis of 72.6% of C′ dot product for this synthesis. To increase product purity further, only the elution volume corresponding to the main particle peak in the GPC trace was collected (red in Figure 1B). The resulting C′ dot solution was then up-concentrated and reinjected into the GPC column for a second round of purification. Impurities in the C′ dot solutions were typically removed after 2 rounds of such GPC purifications, resulting in 100% GPC purity of the product (Figure 1C and Table S1).
In addition to extra peaks, the shape characteristics (i.e., skewness) of the primary C′ dot peak in GPC at ~9 min also provides a measure of the purity of the product. For example, if particle aggregation occurs during synthesis, which is highly undesirable for clinical applications, the primary particle peak is skewed, and peak width increases (Figure 1E) due to the underlying broadened particle size distribution. In these cases, the main particle GPC peak could not be fit by a single Gaussian distribution but instead required two Gaussian distributions even after removal of additional byproducts (compare Figures 1E and 1F). The associated formation of particle dimers or trimers was manifested by an increase in particle size as measured by FCS (Table S1). A criterion for the successful production of C′ dots is, therefore, that the GPC trace after purification can be fit by a single (i.e., unskewed) Gaussian distribution, resulting in 100% GPC purity. After GPC purification, C′ dots were transferred to deionized (DI) water via spin-filtration. Finally, to remove any contamination in the form of bacteria, the purified C′ dots were filtered with sterile filters (Scheme 1). After this filtration step, the filters were checked by the standard bubble-point integrity test to ensure they were not damaged (see the Methods section).
Prior to aseptic vialing and storage at 4 °C, the product was further tested for sterility by direct inoculation of media method. Tryptic soy broth and fluid thioglycollate growth media were each inoculated with 0.1 mL of the particle product and visually inspected for signs of bacterial growth after a 14-day incubation period. Product samples were evaluated for bacteriostasis/fungistatis to exclude assay interference. In addition, particles were tested for endotoxins using the FDA approved PTS Endosafe system (Charles River, MA), a quantitative Limulus Amebocyte Lysate chromogenic test.
Product Specifications, Quality Control, and Long-Term Stability of C′ Dots
Product release criteria follow FDA CMC guidance adequate for each phase of development and include essential tests for identity, purity, potency, sterility, endotoxins, and stability (in-use and storage). For quality control tests, a small volume of the final product was aliquoted. These included: GPC purity analysis; TEM morphology assessment; FCS particle size and concentration measurements; optical characterization (absorbance, fluorescence); brightness, quantum enhancement per dye, and number of dyes per particle analyses; surface charge assessment via ζ-potential measurements; thermogravimetric analysis (TGA) of organic content; and number of cancer-targeting ligands per particle estimation (Figure 2).7 Additionally, GPC elugrams, UV–vis spectra, and FCS runs of C′ dots from three different synthesis batches were compared. No substantial difference in product purity, particle size, or ligand numbers was observed, indicating high batch-to-batch consistency (Figure S1).
Figure 2.

Quality control measurements of C′ dot synthesis product. (A) GPC trace with 100% purity. (B) TEM images at different magnifications (inset shows optical appearance of Cy5 encapsulated C′ dots). (C) UV/vis absorption spectrum of cRDGY–Cy5–C′ dots compared to free cRGDY peptide and PEGylated Cy5–C′ dots without cRGDY ligands. (D) FCS autocorrelation curves for cRGDY–PEG–Cy5–C′ dots and Cy5 free dye. (E) TGA trace. (F) Absorbance and emission spectra of cRGDY–PEG–Cy5–C′ dots as compared to Cy5 free dye. (G) Superimposed DLS size measurements of three separate runs. (H) Superimposed ζ-potential measurements of three separate runs.
The stability of a final C′ dot product stored in DI water at 4 °C at a concentration of 15 µM, as measured by sterility, endotoxins, and purity, was monitored for over two and a half years (Figure 3A–H). The GPC traces immediately after synthesis and at two years postsynthesis could both be well-fit by a single Gaussian distribution, suggesting 100% GPC purity at both time points (Figure 3A and C). The corresponding absorbance spectra also remained unchanged, corroborating that no degradation or aggregation of fluorescent dye or peptide ligands occurred over the two-year period (Figure 3B and D). Figures 3E to H show FCS-derived particle size (E), FCS- and absorbance-derived number of Cy5 dyes per particle (F), UV/vis absorbance-derived number of cRGDY ligands per particle (G), and GPC-derived purity (H) at over 2.5 years after particle manufacture. While all other parameters show no systematic changes over the entire time span, the GPC-derived purity analysis suggests the onset of degradation beyond 24 months, i.e., beyond the two-year time point. As shown in Figure S2 of the Supporting Information, for the 32-month postsynthesis time point, GPC traces beyond two years started to show the reappearance of a second peak at ~14 min elution time. Quantitative analysis of the GPC trace at the 32-month time point with Gaussian fits reveals that this impurity amounts to ~2% of the total peak area. Obviously, this is too small to be detected by any of the other quality-assessment techniques represented in Figure 3, demonstrating the importance of GPC in quality control. While more stability tests at even longer times are necessary to fully assess this degradation effect, we hypothesize here that this degradation stems from shedding of cRDGY ligands or cRGDY–PEG ligands from the particle surface. Finally, we conclude that this degradation process does not occur until after 24 months and therefore can assign a shelf life of two years to the cRGDY–PEG–Cy5–C′ dots investigated here.
Figure 3.

Long-term stability assessment of cRGDY–PEG–Cy5–C′ dots. GPC trace (A) and UV/vis absorbance spectrum (B) of final cRGDY–PEG–Cy5–C′ dots right after particle manufacture. GPC trace (C) and UV/vis absorbance spectrum (D) of the same sample two years after particle manufacture. The C′ dots were stored at 4 °C in DI water at a concentration of 15 µM during the stability test. The GPC traces (A and C) were fit by Gaussian distributions (red) with fitted particle peak areas highlighted in red. FCS-derived particle size (E), FCS and absorbance-derived number of Cy5 dyes per particle (F), UV/vis absorbance-derived number of cRGDY ligands per particle (G), and GPC-derived purity (H) over more than 2.5 years after particle manufacture. See Supporting Information for details of the GPC analysis derived purity values.
C′ Dots with Varying Surface Ligand Densities
In earlier studies,7,8,22 first-generation ultrasmall fluorescent silica nanoparticles, cRGDY–PEG–Cy5–C dots synthesized by the Stöber method in alcohol, were prepared with a small number of fixed, surface-targeting ligands (~6 or less cRGDY/C dot) for evaluating αvβ3 integrin-driven biological systems. Here, we performed a comprehensive characterization of sub-10 nm diameter C′ dots synthesized in water9 and surface-functionalized with a range of cRGDY ligand numbers (i.e., ~6–18) to assay whether variations in ligand density modulate key in vitro and in vivo biological activities (i.e., binding affinity, internalization, pharmacokinetics, targeted uptake) in αvβ3-overexpressing human melanoma (M21) and endothelial (HUVEC) cell lines and tumor xenograft models. Importantly, particle concentrations utilized in the following in vitro studies are at least two orders of magnitude greater than those achieved in vivo for our prior clinical trials. Results arising from the former can serve to better define the practical dosing limits for future patient care applications once validated preclinically.
cRGDY–PEG–Cy5–C′ dots with varying cRGDY ligand numbers were synthesized by adding different amounts of cRDGY–PEG–silanes into the reaction mixture, as described in the Materials and Methods section. The final products were characterized as described above (Figure 4). The FCS autocorrelation curves (Figure 4A) of C′ dots with increasing cRDGY surface ligand numbers slightly shift to the right, indicating a small increase in particle size. TEM images reveal high homogeneity of particle morphology (Figure 4A inset, Figure S3D). The UV/vis absorbance spectra of all samples (Figure 4B) show peaks at both 645 and 275 nm, corresponding to Cy5 dye and cRGDY peptides, respectively.9 When absorption-matched to the dye spectrum at 645 nm, samples synthesized with increasing cRGDY–PEG–silane concentrations exhibited increasing absorption intensity at 275 nm, consistent with increasing cRGDY surface ligand density. For a given cRGDY–PEG–Cy5–C′ dot sample in solution, by dividing the cRGDY concentration calculated from an absorbance calibration at 275 nm by the particle concentration as obtained from FCS, the numbers of cRGDY per C′ dot were estimated to be 6, 14 and 18, respectively. Finally, assessments of all samples by GPC (vide supra) indicated 100% purity of all samples (Figure 4C, Figures S3A–C).
Figure 4.

cRGDY–PEG–Cy5–C′ dots with varying surface cRGDY ligand numbers. (A) FCS autocorrelation curves and (B) UV/vis absorbance of C′ dots with varying surface cRGDY ligand numbers as indicated. The insert in A shows a representative TEM image of cRGDY–PEG–Cy5–C′ dots, here with 18 cRGDY ligands per particle. In B, for comparison, a spectrum is shown for a nonfunctionalized PEGylated C′ dot. (C) Representative GPC trace of final products, shown here for C′ dots with 18 cRGDY ligands per particle. The full comparison of TEM and GPC traces of C′ dots with varying cRGDY ligand numbers are displayed in the Supporting Information.
In Vitro Receptor Targeting Studies
In vitro binding kinetics and targeting specificity of cRGDY–PEG–Cy5–C′ dots bearing on average 6 ligands (6 cRGDY/C′ dot), 14 ligands (14 cRGDY/C′ dot), or 18 ligands (18 cRGDY/C′ dot) per particle were evaluated by flow cytometry in M21 cells and compared with controls (i.e., cells in media or M21-L cells lacking surface integrin expression). Figure 5A shows concentration-dependent cell binding and uptake of cRGDY–PEG–Cy5–C′ dots in M21 cells incubated in serum-deprived media (0.2% FBS) for all ligand numbers against cells in serum-deprived media alone. Enhanced uptake was observed with increasing particle concentrations, greatest in magnitude for particles bearing ~18 ligands per particle. Saturation binding occurred at lower concentrations (i.e., ~50 nM) for C′ dots bearing higher ligand numbers (14 and 18 cRGDY/C′ dot) compared to those bearing lower ligand numbers (i.e., ~75 nM). Of note, discrimination of particles bearing different numbers of ligands was also found to be maximal for particle concentrations lower than 25 nM. For instance, at 10 nM concentrations, M21 cell uptake values were, on average, ~4- and >10-fold higher, respectively, for particles bearing ~14 and 18 cRGDY ligands compared to 6 cRGDY ligands. Differences among areas under the profiles for each of the estimated ligand numbers (i.e., 6 cRGDY vs 14 and 18 cRGDY/C′ dot; 14 cRGDY vs 18 cRGDY/C′ dot) were statistically significant (P < 0.001). Furthermore, particle uptake in M21 cells incubated in serum-deprived media was seen to increase with incubation time for all ligand numbers (Figure 5B), consistent with previous binding kinetic studies using small ligand numbers.22 Maximum values were observed at earlier incubation times (i.e., 2 h) for 14 and 18 cRGDY/C′ dots, and areas under these profiles were found to also be statistically significant (P < 0.001) relative to that for 6 cRGDY/C′ dot.
Figure 5.

In vitro integrin-targeted uptake of cRGDY–PEG–Cy5–C′ dots using a range of ligand numbers. Receptor-specific binding and cellular uptake of cRGDY–PEG–Cy5–C′ dots in αvβ3-positive M21 cells incubated in serum-deprived (0.2% FBS) media as a function of (A) particle concentration (0–250 nM) at 4 h postincubation, (B) incubation time (0–4 h) using 100 nM particle concentrations, and (C) incubation temperature (4–37 °C) by flow cytometry (100 nM, 4 h). (D) ανβ3 integrin receptor blocking of M21 cells using flow cytometry and excess anti–ανβ3 antibody prior to incubation with 25 nM cRGDY–PEG–Cy5–C′ dots. Anti-ανβ3 integrin receptor antibody concentrations were 100 times higher than particle concentrations (incubation time was 2 h). (E) Specific binding of 25 nM cRGDY–PEG–Cy5–C′ dots bearing a range of ligand numbers to serum-deprived M21 cells by flow cytometry (incubation time was 2 h) against M21-L cells lacking surface integrin expression (αvβ3-negative). (F) M21 cellular uptake of 25 nM cRGDY–PEG–Cy5–C′ dots (~14 cRGDY/C′ dot) in serum-deprived media relative to 25 nM cRADY–PEG–Cy5–C′ dots (~15–20 cRADY/C′ dot) by flow cytometry (incubation time was 2 h). Each bar represents mean ± SD of three replicates.
Intracellular localization of cRGDY-functionalized C′ dots was found to occur primarily via an integrin-driven, receptor-mediated endocytic mechanism.22 We sought to understand whether the presence of cRGDY peptides on the particle surface substantially enhanced cellular uptake in M21 cells incubated in serum-deprived media as a function of ligand density at 3 different temperatures (i.e., 4, 25, and 37 °C). Temperature-dependent internalization of particles (6–18 cRGDY/C′ dot) was assessed at ~4 h postincubation times (Figure 5C). At 25 and 37 °C, statistically significant increases in uptake were found between cRGDY-bound particle-exposed cells and controls (P < 0.001), and for C′ dots bearing higher versus lower ligand numbers (P < 0.001); uptake of C′ dots bearing 14 versus 18 cRGDY/C′ dot also achieved statistical significance (P < 0.001) at 25 °C. Although dramatic increases (up to 200-fold) in uptake were seen between 4 and 25 °C (or 37 °C) for all ligand numbers, implicating receptor-mediated endocytosis,23 more modest rises were found between 25 and 37 °C, perhaps reflecting greater multivalent-mediated changes in affinity at these temperatures, notably for particles bearing higher ligand numbers.24
Additional confirmation of αvβ3 integrin receptor specificity was based on the following in vitro assays over the range of ligand numbers tested: (1) M21 blocking studies using an anti-αvβ3 integrin receptor antibody (Figure 5D), (2) comparative particle incubation studies with M21 and M21-L cells (Figure 5E), and (3) relative uptake studies using C′ dots surface-functionalized with cRGDY peptides, compared to a similar density of scrambled (i.e., cRADY) peptides (Figure 5F). In the presence of excess (100-fold) antibody to the αvβ3 receptor, M21 uptake in serum-deprived media was maximally blocked (~65%) for 18 cRGDY/C′ dots (Figure 5D), noting statistically significant differences in the magnitude of blocking among 14 and 18 cRGDY/C′ dot and 6 cRGDY/C′ dot (P < 0.002), and between 14 and 18 cRGDY/C′ dot (P < 0.002). In Figure 5E, greater M21 cellular uptake was observed in serum-deprived media using higher, as opposed to lower, ligand densities (P < 0.001 for 14 and 18 cRGDY vs 6 cRGDY/C′ dot and 18 cRGDY vs 14 cRGDY/C′ dot). Relative to M21-L cells lacking integrin expression, up to 75% higher uptake values were measured in M21 cells using 14 (or 18) cRGDY/C′ dot. Dramatic differences in uptake were also found between particle-exposed M21 (or M21-L) and nonparticle-exposed cells, particularly for higher ligand densities (P < 0.001; Figure 5E). Finally, control particles functionalized with ~15–20 cRADY peptide ligands led to M21 uptake values in serum-deprived media that were roughly 1/7 of that found with 14 cRGDY/C′ dot for the same incubation conditions (P < 0.001; Figure 5F); statistical significance was also achieved between these and their respective nonparticle-exposed cellular counterparts (P < 0.001). Taken together, these results confirm modulation of cellular biology by the precise tuning of ligand density and hydrodynamic radius. This, in turn, leads to more potent integrin-specific targeting and enhanced particle uptake using lower particle concentrations, a potentially important safety consideration.
Influence of Ligand Density on Cell Viability and Proliferation
To demonstrate that no significant loss of cell viability or proliferative activity occurred due to the particles over the range of ligand densities tested, subconfluent G0/G1 phase-synchronized M21 cells were exposed to particle concentrations (0–100 nM cRGDY–PEG–Cy5–C′ dots) and incubation times (0–96 h) in serum-supplemented media (10% FBS) at 37 °C, and changes in cell numbers were monitored. Relative to control conditions (i.e., media supplemented with 10% FBS), there was no significant loss of cell survival (Figure S4A). Further, for all ligand densities, time-dependent increases in cell number were found after multidose (n = 5) addition of 100 nM particles to M21 cells, suggesting no adverse effects on cellular proliferation (Figure S4B).
Modulation of αvβ3 Integrin-Driven Pathways by C′ Dots Bearing Different Ligand Numbers
We further investigated whether integrin-mediated alterations in cell signaling could be modulated by ligand density, thereby potentially influencing downstream biological events, including cellular migration, adhesion, and proliferation.
Serum-deprived (0.2% FBS) M21 cells were treated with 100 nM of 6 cRGDY/C′ dot or 14 cRGDY/C′ dot for 2 h at 37 °C against cells treated with 0.2% FBS alone (controls). Western blot analyses of lysates from these particle-exposed cells revealed enhanced expression of pFAK-397, pMEK, pErk, and pAkt (Figure S5A), suggesting activation of mitogen-activated protein kinase (i.e., Ras/Raf/MEK/Erk) and phosphatidylinositol 3-kinase (PI3K)/Akt pathways. Findings confirm those found with earlier-generation particles with 6 or fewer peptide ligands, which linked activation with phosphorylation of FAK at tyrosine 397 (Tyr 397).22 No significant differences in expression levels were noted between particles bearing 6 cRGDY/C′ dot and 14 cRGDY/C′ dot. These findings for particle-exposed cells are shown graphically as intensity ratios normalized to corresponding values measured under control conditions (Figure S5B).
Influence of cRGDY–PEG–Cy5–C′ Dots on Cellular Migration and Adhesion
In addition to proliferative activity, the dependence on particle ligand density of other downstream biological events such as cellular migration and adhesion and the extent to which these events may be differentially modulated were examined. Using a well-established cell migration assay,22 we sought to determine whether cRGDY–PEG–Cy5–C′ dots bearing different ligand densities altered the migration of αvβ3-integrin expressing human umbilical vein endothelial cells (HUVECs). Time-dependent changes in HUVEC cell migration into the cell-free zone of a well plate were monitored using time-lapse imaging after exposing cells to high particle concentrations (400 nM, 37 °C) over a 24-h period (Figures S6A and B). For 14 cRGDY/C′ dot and 18 cRGDY/C′ dot, statistically significant increases in the mean areas of closure were observed as a percentage of the baseline values (t = 0) for cells seeded in the absence of particles, and a percentage of that measured for 6 cRGDY/C′ dot, summarized in Figure S6C.
To determine whether alterations in cellular adhesion occurred over the range of ligand numbers tested (i.e., 6–18), an adhesion assay was performed, as in earlier work,22 using a competitive binding assay and M21 cells preincubated without and with 400 nM cRGDY–PEG–Cy5–C′ dots (Figure S7) over a 2-h period. To conduct the assay, cells were transferred to fibronectin-coated wells, as RGD is a known component of fibronectin and other protein constituents of the extracellular matrix. Average cell counts of elongated (spreading) cells versus rounded cells were quantified over the 2-h period and graphically depicted in Figures S8A and B. Spreading was observed to occur in the absence of particles, while particle-bound cells were not able to attach to the substrate, exhibiting a mostly rounded appearance. In the first 30 min, about 30–50% of cells not preincubated with particles, attached and spread on fibronectin-coated wells (Figure S8B). By contrast, M21 cells preincubated with particles demonstrated a progressively lower percentage of cells (~10–15%) attaching and spreading in the fibronectin-coated well with increasing ligand density up to 2 h postseeding. Quantification of cellular optical densities (or absorbance) after addition of methylene blue dye revealed that, on average, about twice as much dye was taken up by that attached and spread on fibronectin relative to that for particle-exposed cells over the range of ligand densities used; uptake was greatest for the 14 cRGDY/C′ dot and 18 cRGDY/C′ dot batches (Figure S8C). As in earlier studies with M21 cells,22 findings suggested that particles exhibited greater binding affinity for αvβ3-expressing M21 cells than for fibronectin-coated wells. Particle binding inhibited cells from normally adhering and spreading in culture, altering their adhesive, morphologic, and biomechanical properties. Enhancement of these effects was found to increase with increasing ligand number. Statistically significant differences in mean cell numbers were observed as a percentage of the control values (t = 0, no particles) across ligand densities; differences were also found to be significant among ligand densities (14 and 18 cRGDY vs 6 cRGDY/C′ dot; 14 vs 18 cRGDY/C′ dot), as summarized in Figure S8.
Radiostability and Pharmacokinetics Studies of 124I (or 131I)-cRGDY–PEG–Cy5–C′ Dots
A previously reported IODOGEN method was used for labeling d-tyrosine residues of conjugated cRGDY peptides with radioiodine (i.e., 124I, 131I).7,8 Figure 6A (blue line) shows a representative PD-10 column elution profile of 124I–cRGDY–PEG–Cy5–C′ dots. Fractions between 2.5 to 4.0 mL were collected for in vivo imaging studies. Free 124I usually elutes after the 4.5 mL fraction and can be well-separated from the main product, as confirmed by its elution profile (Figure 6, orange line).
Figure 6.

124I radiolabeling, purification, and in vivo radiostability studies. (A) Representative elution profiles of 124I–cRGDY–PEG–Cy5–C′ dot and free 124I in PD-10 columns. PBS was used as the mobile phase. (B) Radio-stability of 124I–cRGDY–PEG–Cy5–C′ dot in mouse plasma at varied p.i. time points (i.e., 1.5, 4, and 30 h).
Next, we investigated the stability of radioiodinated cRGDY–PEG–Cy5–C′ dots in vivo. Healthy nude mice were injected with 124I–cRGDY–PEG–Cy5–C′ dots (i.e., 18 cRGDY/C′ dot), followed by blood sampling at early (1–4 h) and 30-h postinjection (p.i.) time points. After separating plasma from whole blood, the amount of particle-bound 124I (i.e., 124I–cRGDY–PEG–Cy5–C′ dots) was quantified using radioTLC. Figure 6B shows that ~99% of the radiolabel is particle-bound at 4 h p.i. with only ~6.5% free radioiodine at 30 h p.i.; no additional blood sampling was performed after 30 h given that particle tracer circulation half-times are on the order of only 5–6 h.7 The newer-generation 124I–cRGDY–PEG–Cy5–C′ dots thus demonstrated relatively high in vivo radiostability.
In prior studies using earlier-generation, low-ligand number nonradiolabeled6 and radioiodinated C dots,7 efficient renal clearance was measured for both Cy5-incorporated integrin-targeted and nontargeted C dots using both semiquantitative optical and quantitative positron emission tomography (PET) imaging techniques. These findings were also found for C′ dots functionalized with high ligand numbers (i.e., 18 cRGDY/C′ dot) with strong optical signals in the bladder and urine specimens of intravenous injection (i.v.)-injected mice at 20 min p.i. (Figure S9).
We then quantitatively assessed in vivo pharmacokinetics, tumor-targeting efficacy, and target-to-background ratios in αvβ3-positive M21 xenografted mice after intravenously injecting 131I-radiolabeled cRGDY–PEG–Cy5–C′ dots functionalized with a range of ligand numbers (i.e., 131I–cRGDY–PEG–Cy5–C′ dots). Following systemic administration of tracer doses (50–70 µCi, or 1.85–2.59 MBq) of 131I–cRGDY–PEG–Cy5–C′ dots functionalized with 6, 14, and 18 ligands into mice bearing M21 xenografts, biodistribution, renal, and hepatobiliary clearance profiles were evaluated, along with blood, urine, and residual carcass activity (Figure 7). For all ligand densities, kinetic profiles were fairly equivalent with over 90% of the injected 131I-labeled particle dose excreted over the first 3 days p.i. (Figure 7, right inset). At 4 days p.i., targeted probes were almost entirely eliminated from the carcass with less than 7% of the ID remaining; elimination was greatest for 18 cRGDY/C′ dot (i.e., >98%).
Figure 7.

Biodistribution studies in M21 tumor-bearing mice using cRGDY–PEG–Cy5–C′ dots of varying ligand number. Biodistribution patterns and tumor-to-background ratios observed in M21-xenografted mice following i.v.-injection of 131I–cRGDY–PEG–Cy5–C′ dots over a range of p.i. time points (i.e., 1–96 h) (n = 3): (A, and B) 6 cRGDY/C′ dot, (C and D) 14 cRGDY/C′ dot, and (E and F) 18 cRGDY/C′ dot. Insets in A, C, and E show corresponding urine uptake (presented as %ID/g) and retained activity in mice carcasses (presented as %ID) at different p.i. time points.
Relatively faster renal clearance was demonstrated on average for 131I–cRGDY–PEG–Cy5–C′ dots bearing 18 cRGDY/C′ dot as compared with dots with lower cRGDY ligand numbers, a result confirmed by higher urinary activity at early time points and a lower mean blood activity (0.56 ± 0.02 %ID/g) at 24 h p.i. (Figure 7). Kinetic modeling also indicated that ~95% of the injected dose was cleared through the kidneys with the remaining 5% eliminated via the hepatobiliary route. Importantly, efficient renal excretion over a 96-h period was observed for all ligand densities, which was also reflected by radioassay of urine samples (insets, Figure 7). On average, at least 75% of the urinary activity (%ID) was excreted over the first 24 h p.i., while as much as 98% was excreted by 96 h. No significant particle urinary activity could be detected beyond 96 h p.i.
The bulk of the particle tracer was rapidly cleared from the blood compartment with estimated mean half-time values ranging from 2.4 to 3.8 h across ligand numbers. These longer 131I–cRGDY–PEG–Cy5–C′ dot circulation half-times relative to that found for the native cRGDY peptide were felt to be a consequence of surface PEGylation, which can reduce protein adsorption and thereby confer a stealth effect.25
While the magnitude of accumulated activity in tumors did not vary significantly with increasing ligand number (i.e., maximum values of ~3 %ID/g at 4 h p.i.), consistent with the results of cell uptake studies, tumor-to-blood ratios achieved a maximum value of ~10 in mice injected with 131I–cRGDY–PEG-C′dots (18 cRGDY/C′ dot) (Figure 7F) at 72 h p.i., as compared with the results for particles with lower ligand densities (Figures 7B and D). Cross-ligand comparisons of time-dependent tumor-to-blood, -muscle, and -liver ratios showed that tumor-to-blood ratios were statistically significant for 14 vs 18 cRGDY/C′ dots (P < 0.037) 24 h p.i., while tumor-to-liver ratios demonstrated statistical significance at 24 and 96 h p.i. for 18 cRGDY vs 6 cRGDY/C′ dot (P < 0.017 and 0.012, respectively) and 18 cRGDY vs 14 cRGDY/C′ dot (P < 0.007 and 0.005, respectively). Further, no significant uptake was observed in the reticuloendothelial (RES) system (liver, spleen, and bone marrow) or other major organs with time, noting maximum values of 5 %ID/g or less for all ligand densities, which then subsequently decline with time.
Pharmacokinetically derived zero-time particle activities (Ao) and half-times (T1/2), both biologic and effective, for blood, tumor, and major organs are shown in Table S2 for all ligand densities. For the 6 cRGDY/C′ dot and 14 cRGDY/C′ dot, the tumor time–activity data were fit to an exponentially rising and then exponentially falling functions with the first and second half-times corresponding to the rising and falling components, respectively. By contrast, the time–activity data for all other tissues and ligand numbers were fit to a monoexponentially or, more commonly, biexponentially decreasing function.
By appropriate organ mass-adjusted translation of the foregoing biodistribution data to humans, integrated activities (Table S3) and human (70 kg reference person) normal-organ radiation absorbed doses (Table S4, columns 2–4) were derived for all ligand densities and found to be comparable to those of other commonly used diagnostic radiotracers. No significant dose differences were observed across the range of ligand numbers.
In Vivo PET Imaging of 124I–cRGDY–PEG–Cy5–C′ Dot
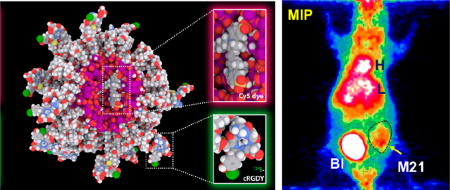
To further demonstrate tumor-specific targeting, both M21 and M21-L tumor-bearing mice were i.v.-injected with 124I–cRGDY–PEG–Cy5–C′ dots (18 cRGDY/C′ dot), given its more favorable target-to-background ratios, and imaged using a small-animal PET system. Particle activity was observed in mouse bladders (BI) at early time points, as shown in representative maximum intensity projection (MIP) images of M21 tumor-bearing mice (Figure 8A). Quantitative PET imaging clearly demonstrates enhanced particle tracer uptake in M21 (αvβ3 positive) xenografts relative to that seen in M21-L tumors (αvβ3 negative) (Figures 8B and C). Region-of-interest (ROI) measurements confirmed these visual findings, with threefold greater uptake values found for M21 xenografts (Figure 8D) compared with M21-L tumors at ~24 h p.i.; results were statistically significant for all time points (P < 0.001). In addition, we observed time-dependent reductions in liver activity for both M21 and M21-L tumor-bearing mice after i.v. injection of 124I–cRGDY–PEG–Cy5–C′ dots (Figure S10); hepatic activities were relatively low (<5 %ID/g). Low but notable thyroid uptakes (white arrows, Figure 8A) were also observed in the mice. Taken together, imaging measurements were found to be consistent with biodistribution findings using 131I–cRGDY–PEG–Cy5–C′ dots.
Figure 8.

In vivo tumor-targeted PET imaging studies. Time-dependent uptake of 124I–cRGDY–PEG–Cy5–C′ dots (18 cRGDY/C′ dot) in M21 (αvβ3 positive) and M21-L (αvβ3 negative) tumor-bearing mice (n = 3). (A) MIP images of M21 tumor-bearing mice systemically injected with 124I–cRGDY–PEG–Cy5–C′ dots. H: heart, L: liver, BI: bladder. M21 tumor marked with yellow arrows and thyroid gland marked with white arrows. Serial coronal tomographic PET images of 124I–cRGDY–PEG–Cy5–C′ dots in (B) M21 (yellow arrows) and (C) M21-L (red arrows) tumor-bearing mice. (D) Uptake of radiolabeled particles in M21 versus M21-L xenografts at different p.i. time points.
CONCLUSION
Although significant advances have been made in targeted-particle probe development for cancer nanomedicine, technical and regulatory hurdles continue to limit safer and more efficient product translation and regulatory approval. At the macro-molecular particle size scale, a better understanding of manufacturing process control is needed, and how surface chemical variations modulate biological events, pharmacokinetic profiles, and nanoparticle biointeractions for improved targeted delivery. Reproducible manufacturing process control is also needed. In this article, we report on the comprehensive characterization of ultrasmall dual-modality and integrin-targeting C′ dots with different surface ligand numbers to identify surface chemistries that lead to more favorable biological responses. Importantly, by conducting single-batch reactions in water-based environments, particle size, surface PEGylation, ligand density, and dye incorporation efficiency could be more precisely controlled. A custom-built FCS device, in conjunction with high resolution GPC and other spectroscopic tools, was used to monitor long-term particle stability and to discriminate variations in these particle properties on a batch-to-batch basis and thus satisfy chemistry, manufacturing, and control specifications for investigational new drug approval. Screening biological assays were conducted on cRGDY–PEG–Cy5–C′ dots with varied ligand numbers to select lead candidates exhibiting optimum binding affinity, cellular uptake, specificity, stability, and favorable pharmacokinetics and target-to-background ratios for clinical trial development. We anticipate that such a comprehensive assessment can serve as a guide for informing safer and more reliable product manufacturing and biological testing procedures and for more efficiently selecting other lead organic–inorganic hybrid particle candidates for clinical translation.
MATERIALS AND METHODS
Reagents, Antibodies, and Chemicals
RPMI 1640, DMEHG with 1.8 g/L sodium bicarbonate, fetal bovine serum (FBS), penicillin, streptomycin, and HBSS (without calcium and magnesium containing 0.25% trypsin and 0.05% EDTA) were obtained from the Core Media Preparation Facility, Memorial Sloan Kettering Cancer Center (New York, NY).
Synthesis of cRGDY–PEG–Cy5–C′ Dots
The detailed synthesis of C′ dots is described in a previous paper.9 For the generation of C′ dots with 6, 14, and 18 cRGDY ligands per particle, the concentration of cRGDY–PEG–silane in the particle synthesis was set to 0.143, 0.286, and 0.429 mM, respectively.
Purification of cRGDY–PEG–Cy5–C′ Dots
The purification of C′ dots was conducted using a BioLogic LP system in a controlled environment equipped with a 275 nm UV detector. The GPC column, which was ~40 cm in length and 2.5 cm in diameter, was packed with Superdex 200 resin from GE Healthcare Life Science. The column was flushed with 0.9 wt % NaCl solution as eluent for at least 3 h before use. The flow rate was set to ~4 mL/min. The column was calibrated using protein standards from Bio-Rad, which were a mixture of thyroglobulin, bovine γ-globulin, chicken ovalbumin, equine myoglobin, and vitamin B12 with known molar masses. In each GPC run, up to 400 µL of C′ dot solution (in DI water) was injected with estimated concentration of ~0.15 mM. Elution solutions were collected by a BioFrac fraction collector. After GPC purification, C′ dot particles were transferred from 0.9 wt % NaCl solution back to DI water via spin-filtration using spin filters (GE Healthcare Life Science). The GPC traces were fit using Gaussian distributions using software Origin 8.0, with fitting results summarized in Table S1. Finally, C′ dot solutions were filtered by Medical Millex-GV sterilized filters and subsequently checked via standard bubble-point test, sterility [direct inoculation, USP (71)], and endotoxin [USP (85)]. In the bubble-point test, air was pressed through the filter using a syringe equipped with a pressure regulator. If the onset pressure at which a continuous stream of bubbles is observed is higher than a threshold given by the commercial provider, i.e., 40 psi for the filter we were using, the integrity of the used filter is demonstrated, and the sample passes the test.
TEM and DLS
TEM images were taken using a FEI Tecnai T12 Spirit microscope operated at an acceleration voltage of 120 kV. Hydrodynamic particle size and particle ζ-potential were measured by DLS using a Malvern Zetasizer Nano-SZ operated at 20 °C. Each sample was measured three times using the DLS setup, and results were averaged.
FCS and UV/Vis Absorbance and Emission Spectra
Absorbance spectra of samples were measured on a Varian Cary 5000 spectrophotometer. The emission spectra of absorbance-matched samples were measured using a Photon Technologies International Quantamaster spectrofluorometer. FCS measurements were conducted using a home-built FCS setup with a 633 nm solid-state laser as the laser source for Cy5 dye.3,9,19 The hydrodynamic particle size, particle brightness, and concentration were obtained by fitting the FCS autocorrelation curves.19 The number of dyes per particle and number of cRGDY ligands per particle were calculated by dividing the dye concentration and cRGDY peptide concentration, calculated from the respective absorbance spectra, by the particle concentration, obtained from FCS.9,19
TGA
The particle solution was first frozen in liquid nitrogen and then left under vacuum at −20 °C for 3 days to dry. The powder after freeze-drying was left under vacuum at 60 °C overnight. The dried particle sample was then subjected to TGA. The TGA was conducted using a TA Instruments Q500 thermogravimetric analyzer. During the measurement, the temperature was increased from room temperature to 100 °C, with a ramp of 10 °C/min, and then kept at 100 °C for 2 h to fully exclude any residual water. Afterward, the temperature was further increased to 600 °C with a ramp of 10 °C/min.
Synthesis of 124I–cRGDY–PEG–Cy5–C′ Dots and 131I–cRGDY–PEG–Cy5–C′ Dots
Radiolabeling of cRGDY–PEG–Cy5–C′ dots with 124I or 131I was performed using a previously reported IODOGEN method.7,8 Briefly, 50 µL of 1 M ammonium acetate was added to an iodination tube, followed by 40 µL (15 µM) of cRGDY–PEG–Cy5–C′ dots and 2.0 mCi (74 MBq) of 124I (or 131I) sodium iodide. The mixture was gently vortexed for several seconds and maintained at room temperature (22 °C) for 10 min. Free radioiodine was removed by passing the mixture through a PD-10 column (PBS as the mobile phase). To eliminate any possible nonspecifically bound 124I, a second PD-10 column purification step was performed. After synthesis, 124I–cRGDY–PEG–Cy5–C′ dots were continuously mixed by a shaker at room temperature (22 °C) for an additional 4–6 h, then repurified using a second PD-10 column prior to the product’s in vivo use. The specific activity of 124I (or 131I)-labeled cRGDY–PEG–Cy5–C′ dots was in the range of 2–4 mCi/nmol.
Cells and Cell Culture
Human melanoma M21 and M21 variant (M21-L, αv negative) cell lines were obtained from D.A. Cheresh (University of California San Diego, San Diego, California, United States). Cells were maintained in RPMI 1640 media/10% FBS, and 2 mM l-glutamine, penicillin, and streptomycin (Core Media Preparation Facility, Memorial Sloan Kettering Cancer Center). Human umbilical vein endothelial cells (HUVECs) were obtained from LONZA (Walkersville, MD) and cultured in EGM-2 medium with 2% FBS and growth factors-LONZA.
In Vitro Cell Binding Studies Using Optical Detection Methods
Particle binding was assayed using M21 and M21-L cells by coating 24-well plates with 10 µg/mL collagen type I (BD Biosciences) in PBS, incubating at 37 °C for 30 min, and washing once with PBS. Cells (3.0 × 10⁵ to 4.0 × 10⁵ cells/well) were grown to near-confluency. Differential binding of cRGDY–PEG-C′-dots bearing different ligand numbers (i.e., 6–18) was evaluated using M21 cells incubated in media supplemented with 0.2% FBS over a range of incubation times (up to 4 h), particle concentrations (10–100 nM), and temperatures (4, 25, and 37 °C) using flow cytometry; controls were run in media supplemented with 0.2% FBS. After incubation, cells were washed with RPMI 1640 media/0.2% FBS, detached using 0.25% trypsin/0.05% EDTA, pelleted in a microcentrifuge tube (5 min at 153 g, 25 °C), resuspended in BD FACSFlow solution (BD Biosciences), and analyzed in the Cy5 channel to determine the percentage of particle-bound probe (FACSCalibur, Becton Dickinson, Mountain View, CA). Particle concentrations and incubation times yielding maximum differential binding were used for subsequent competitive binding assays and specificity studies.
Blocking studies were performed after incubation of cRGDY–PEG–Cy5–C′ dots with serum-deprived M21 cells in the presence of mouse monoclonal antihuman integrin ανβ3 fluorescein-conjugated antibody (Millipore, Billerica, MA) and analyzed by flow cytometry. Particle control binding studies (cRADY–PEG–Cy5–C′ dots; 15–20 ligands) were also conducted with M21 cells at concentrations similar to those used for cRGDY–PEG–Cy5–C′ dots to assess for nonspecific binding and uptake.
Cell Proliferation and Viability
M21 cells in 10% FBS were split (1 × 10⁴ cells/well) in a 24-well plate, and a range of cRGDY-PEGCy5-C′-dot concentrations (0–100 nM), bearing ~6, 14, or 18 ligands, were added for 48 h at 37 °C. Cell survival and proliferation were monitored under control conditions (10% FBS) or after exposure to particles in serum-supplemented media (10% FBS) at 37 °C using a Vi-Cell Viability Analyzer (Beckman Coulter Inc.). To assess survival, media was changed every 48 h with readdition of 100 nM particles while, for proliferative activity, particle-exposed cells were counted every 24 h over a 96-h time interval.
Western Blots (WB)
M21 cells (1 × 10⁶ cells/96-well plate) were grown in 6 wells coated with collagen (10 mg/mL) and made quiescent by growing under serum-deprived conditions. The medium was then changed to 0.2% FBS, and 100 nM of cRGDY-PEG-Cy5-C′-dots bearing either 6 or 14 cRGDY ligands were added (37 °C, ~2 h). Cells were rinsed twice in ice cold PBS, collected by trypsinization, and the pellet resuspended in lysis buffer (10 mM Tris, pH 8.5, 150 mM NaCl, 1 mM EDTA, 1% Triton X-100), 1% Na deoxycholate, 0.1% SDS, Complete protease inhibitors (Roche, Indianapolis, IN), and phosphatase inhibitor cocktail Tablet–PhosSTOP (Roche, Indianapolis, IN). Lysates were centrifuged (10 min, 4 °C). Protein concentrations were determined by the bicinchoninic acid assay (BCA, Thermo Scientific, Rockford, IL). A 50 µg protein aliquot of each fraction was separated by 4–12% gradient sodium dodecyl sulfatepolyacrylamide gel electrophoresis (SDS-PAGE) and transferred to a PVDF membrane (Invitrogen, Carlsbad, CA). Membranes were blocked with 5% nonfat dry milk (Bio-Rad, Hercules, CA) in Tris buffered saline (TBS)–Tween 0.1%, and signal visualized by ECL chemiluminescence (Thermo Scientific, Rockford, IL) or Immobilon Western, (Millipore Billerica, MA) after applying primary (1:1000) and secondary (1:2000–1:5000) antibodies.
Migration Assay
HUVEC cells were seeded (5 × 10⁴ cells/well) using a migration kit (Oris Collagen I coated plate, PLATYPUS TEC). Twenty-four hours after seeding the cells, stoppers in the plate were removed. Fresh culture media (100 µL) supplemented with 0.2% FBS was introduced, along with 400 nM of cRGDY-PEG-Cy5-C′–dots bearing either 6, 14, or 18 ligands. Prior to incubating the plate at 37 °C overnight, time zero images were captured by the Axiovert 200 M microscope (Carl Zeiss) using a 5× (0.15 NA) objective and a scan slide module in the Metamorph software (molecular devices, PA). Serial microscopy was then performed with images captured over a 24-h postincubation interval to assess the percent areas of closure. The resulting images were analyzed using ImageJ software.
Adhesion and Spreading Assays
The effect of cRGDY–PEG–Cy5–C′ dots on the binding of M21 cells to fibronectin-coated plates was evaluated by initially coating 96–well micro titer plates with fibronectin in PBS (5 µg/mL), followed by 200 µL RPMI/0.2% FBS (37 °C, 1 h). Cells (1–3 × 10⁴ cells/100 µL/well) were preincubated with or without 400 nM of cRGDY–PEG–Cy5–C′ dots bearing 6, 14, or 18 surface ligands, in RPMI/0.2% FBS (25 °C, 30 min), and added to fibronectin-coated wells (37 °C, 0–120 min). For quantification of the number of attached cells, wells were rinsed with RPMI/0.2% FBS to remove nonadherent cells. Adherent cells were fixed with 4% PFA (25 °C, 20 min) and stained with methylene blue (37 °C, 1 h). The methylene blue was extracted from cells by the addition of 200 µL of 0.1 M HCl (37 °C, 1 h). Optical densities were determined using a SpectraMax5 microplate reader, and absorbance was measured at 650 nm. For the spreading assay, time lapse imaging was performed (37 °C, 2 h), and images were captured by Axiovert 200 M microscope (Carl Zeiss) using a 20× (0.15NA) objective and a scan slide module in the Metamorph Software (Molecular Devices).
Quantitative Analyses
To quantify differences in the size and intensity between Western blot bands, densitometry of phosphorylated and total protein intermediates was performed using Photoshop CS2 (Adobe, San Jose, CA). Bands were scanned at 300 dpi (Scanjet 7650, Hewlett-Packard, Palo Alto, CA) and converted to grayscale. ROIs were defined within the boundaries of each band to derive the following: area (number of pixels), mean grayscale value within the selected area (0–255), and the associated standard deviation. The product of the first two values for each band was computed and divided by the product for the initial band in each set (control band), yielding an intensity value for each sample relative to the control. Finally, the ratio of phosphorylated protein to total protein and the corresponding propagated error (SD) were computed for each sample using the relative intensities.
Phase contrast images captured for migration studies were analyzed using ImageJ 1.45s (National Institutes of Health, http://imagej.nih.gov/ij/) to quantify the extent of cell migration (i.e., area closure) for HUVECs. At high power views, an enclosed area was drawn adjacent to the rim of attached cells seen in each image after stopper removal. The enclosed area for each image was measured (pixels) and used to calculate percent closure relative to time zero (following particle addition and media replacement) as follows: difference in area at a given time point (7, 24 h) and at time zero divided by the same area at time zero multiplied by 100. The resulting values were averaged, and a standard error was computed for each group.
For cellular adhesion and spreading assays, cell counts in three high power fields per well were manually quantified and microscopically averaged. The assay was performed in quadruplicate at each time point.
Animal Models and Tumor Inoculation
All animal experiments were done in accordance with protocols approved by the Institutional Animal Care and Use Committee of Memorial Sloan-Kettering Cancer Center and followed NIH guidelines for animal welfare. M21 and M21-L xenografts were generated by coinjecting equal volumes of cells (~5 × 10⁶ cells/100 µL) and Matrigel subcutaneously into the hind legs of female athymic nu/nu mice (6–8 weeks old, Taconic Farms Inc.). Average tumor volumes of 200 mm3 were used for all studies.
Dosimetry
Time–activity functions derived for each tissue were analytically integrated (with inclusion of the effect of radioactive decay) to yield the corresponding cumulative activity (i.e., the total number of radioactive decays). 131I mouse organ absorbed doses were then calculated by multiplying the cumulative activity by the 131I equilibrium dose constant for nonpenetrating radiations (positrons), assuming complete local absorption of such radiations and ignoring the contribution of penetrating radiations (i.e., γ-rays). The mouse normal organ cumulated activities were converted to human normal organ cumulated activities by adjustment for the differences in total-body and organ masses between mice and humans (assuming 70 kg standard human). Calculated human normal-organ cumulated activities were entered into OLINDA, a dosimetry program that computes standard human organ absorbed doses based on the formalism of the Medical Internal Dosimetry Committee of the Society of Nuclear Medicine. This human dosimetry model is a normal (i.e., tumor-free) anatomic model.
In Vivo Tumor-Targeted PET Imaging, Radiostability, and Biodistribution Studies
Before the PET imaging, mice were provided with water containing potassium iodide solution to block thyroid gland uptake of free radioiodine. Each mouse was intravenously injected with ~200 µCi (or 7.4 MBq) 124I–cRGDY–PEG–Cy5–C′dot. PET imaging was performed in a small-animal PET scanner (Focus 120 microPET; Concorde Microsystems) at 4, 24, 72, and 96 h p.i. Image reconstruction and ROI analysis of the PET data were performed similar as described previously.7,8 Quantitative PET data were presented as percent of the injected dose per gram (%ID/g).
To study in vivo radiostability of 124I–cRGDY–PEG–C′dots, healthy mice were i.v. injected with ~50 µCi (or 1.85 MBq) of 124I–cRGDY–PEG–Cy5–C′ dots. Mouse blood was sampled at different p.i. time points (i.e., 1.5, 4, and 30 h) and centrifuged (8000 rpm) to separate plasma from red blood cells. The radiostability of 124I–cRGDY–PEG–Cy5–C′ dots in mouse plasma was tested by radio-thin layer chromatography (TLC). TLC plates were developed using a mixture of acetic acid:methanol (80:20 v/v) and analyzed by a TLC plate reader (Bioscan).
For biodistribution studies, M21 tumor-bearing mice were injected with 131I–cRGDY–PEG–Cy5–C′dots functionalized with a range of cRGDY ligand numbers. Activities in major intraparenchymal organs and biological specimens (blood, urine) were assayed at different p.i. time points (i.e., 1, 4, 24, 72, 96 h) using a gamma-counter (PerkinElmer) and presented as %ID/g.
IVIS Spectrum in Vivo Optical Imaging
To show the renal clearance of cRGDY–PEG–Cy5–C′ dots using optical imaging, mice were injected with particles with 18 cRGDY/C′ dot (1.5 nmol, suspended in 200 µL PBS) and PBS control, respectively. The optical imaging was performed by using IVIS spectrum in vivo optical imaging at 20 min p.i. (Ex = 640 nm, Em = 680 nm). Urine samples from the corresponding mice were also taken and imaged using the same imaging system (Ex = 640 nm, Em = 680 nm).
Statistics
All comparisons were performed by a two-sample t test based on three replicates. Concentration and time profiles (Figures 5A and B) were compared based on calculated areas under the profiles.
Supplementary Material
Acknowledgments
This study was funded by grants from the National Institutes of Health (1R01CA161280-01A1 to M.B. and U.W.; 1U54 CA199081-01 to M.B. and U.W.) and the Sloan Kettering Institute (Core Grant P30 CA008748CCSG).
Footnotes
ASSOCIATED CONTENT
- Details on the comparison of GPC traces of cRGDY–PEG–Cy5–C′ dots at different time points; GPC elugrams of cRGDY–PEG–Cy5–C′ dot products with varied ligand densities; effects of cRGDY–PEG–Cy5–C′ dot products on the cell viability, proliferation, cell signaling changes, cellular migration, cell spreading, and adhesion; optical imaging of renal clearable cRGDY–PEG–Cy5–C′ dots (18 cRGDY/C′ dot); time activity curves of blood and tissue specimens; results of quantitative analysis of GPC elugrams of cRGDY–PEG–Cy5–C′ dots; pharmacokinetic-derived activities and half-lives of 131I–cRGDY–PEG–Cy5–C′ dots with varying ligand numbers in a human melanoma (M21) xenograft model; integrated activity of 131I–cRGDY–PEG–Cy5–C′ dots in a 70 kg standard man; and radiation dosimetry of i.v.-injected 131I–cRGDY–PEG–Cy5–C′ dots for a range of ligand numbers (PDF)
Author Contributions
Product preparation was performed by K.M., F.C., and B.Y.; experimental design by F.C., K.M., M.B., E.P., M.B., T.Q., P.Z., U.W., and M.S.B.; data acquisition by F.C., K.M., L.Z., B.Y., E.P., M.P., and M.O.; data analysis and interpretation by F.C., K.M., M.B., E.P., P.M., L.Z., B.Y., M.O., M.S.B., P.Z., M.G., T.Q., and U.W.; and manuscript preparation by F.C., M.S.B., K.M., P.Z., S.S., M.G., and U.W. All authors approved the final version of the manuscript.
The authors declare no competing financial interest.
References
- 1.Huang HC, Barua S, Sharma G, Dey SK, Rege K. Inorganic Nanoparticles for Cancer Imaging and Therapy. J. Controlled Release. 2011;155:344–57. doi: 10.1016/j.jconrel.2011.06.004. [DOI] [PubMed] [Google Scholar]
- 2.Ow H, Larson DR, Srivastava M, Baird BA, Webb WW, Wiesner U. Bright and Stable Core-shell Fluorescent Silica Nanoparticles. Nano Lett. 2005;5:113–7. doi: 10.1021/nl0482478. [DOI] [PubMed] [Google Scholar]
- 3.Burns A, Ow H, Wiesner U. Fluorescent Core-Shell Silica Nanoparticles: Towards “Lab on a Particle” Architectures for Nanobiotechnology. Chem. Soc. Rev. 2006;35:1028–1042. doi: 10.1039/b600562b. [DOI] [PubMed] [Google Scholar]
- 4.Choi J, Burns AA, Williams RM, Zhou Z, Flesken-Nikitin A, Zipfel WR, Wiesner U, Nikitin AY. Core-Shell Silica Nanoparticles as Fluorescent Labels for Nanomedicine. J. Biomed. Opt. 2007;12:064007–1–064007–11. doi: 10.1117/1.2823149. [DOI] [PubMed] [Google Scholar]
- 5.Herz E, Ow H, Bonner D, Burns A, Wiesner U. Dye Structure – Optical Property Correlations in Near-Infrared Fluorescent Core-Shell Silica Nanoparticles. J. Mater. Chem. 2009;19:6341–6347. [Google Scholar]
- 6.Burns AA, Vider J, Ow H, Herz E, Penate-Medina O, Baumgart M, Larson SM, Wiesner U, Bradbury M. Fluorescent Silica Nanoparticles with Efficient Urinary Excretion for Nanomedicine. Nano Lett. 2009;9:442–448. doi: 10.1021/nl803405h. [DOI] [PMC free article] [PubMed] [Google Scholar]
- 7.Benezra M, Penate-Medina O, Zanzonico PB, Schaer D, Ow H, Burns A, DeStanchina E, Longo V, Herz E, Iyer S, Wolchok J, Larson SM, Wiesner U, Bradbury MS. Multimodal Silica Nanoparticles are Effective Cancer-targeted Probes in a Model of Human Melanoma. J. Clin. Invest. 2011;121:2768–80. doi: 10.1172/JCI45600. [DOI] [PMC free article] [PubMed] [Google Scholar]
- 8.Phillips E, Penate-Medina O, Zanzonico PB, Carvajal RD, Mohan P, Ye Y, Humm J, Gonen M, Kalaigian H, Schoder H, Strauss HW, Larson SM, Wiesner U, Bradbury MS. Clinical Translation of an Ultrasmall Inorganic Optical-PET Imaging Nanoparticle Probe. Sci. Transl. Med. 2014;6:260ra149. doi: 10.1126/scitranslmed.3009524. [DOI] [PMC free article] [PubMed] [Google Scholar]
- 9.Ma K, Mendoza C, Hanson M, Werner-Zwanziger U, Zwanziger J, Wiesner U. Control of Ultrasmall Sub-10 nm Ligand-Functionalized Fluorescent Core-Shell Silica Nanoparticle Growth in Water. Chem. Mater. 2015;27:4119–4133. [Google Scholar]
- 10.Ma K, Zhang DH, Cong Y, Wiesner U. Elucidating the Mechanism of Silica Nanoparticle PEGylation Processes Using Fluorescence Correlation Spectroscopies. Chem. Mater. 2016;28:1537–1545. [Google Scholar]
- 11.Yoo B, Ma K, Zhang L, Burns A, Sequeira S, Mellinghoff I, Brennan C, Wiesner U, Bradbury MS. Ultrasmall Dual-modality Silica Nanoparticle Drug Conjugates: Design, Synthesis, and Characterization. Bioorg. Med. Chem. 2015;23:7119–30. doi: 10.1016/j.bmc.2015.09.050. [DOI] [PMC free article] [PubMed] [Google Scholar]
- 12.Bradbury MS, Phillips E, Montero PH, Cheal SM, Stambuk H, Durack JC, Sofocleous CT, Meester RJ, Wiesner U, Patel S. Clinically-translated Silica Nanoparticles as Dual-modality Cancer-targeted Probes for Image-guided Surgery and Interventions. Integr. Biol. (Camb) 2013;5:74–86. doi: 10.1039/c2ib20174g. [DOI] [PMC free article] [PubMed] [Google Scholar]
- 13.Kim SE, Zhang L, Ma K, Riegman M, Chen F, Ingold I, Conrad M, Turker MZ, Gao M, Jiang X, Monette S, Pauliah M, Gonen M, Zanzonico P, Quinn T, Wiesner U, Bradbury MS, Overholtzer M. Ultrasmall Nanoparticles Induce Ferroptosis in Nutrient-Deprived Cancer Cells and Suppress Tumor Growth. Nat. Nanotechnol. 2016;11:977–985. doi: 10.1038/nnano.2016.164. [DOI] [PMC free article] [PubMed] [Google Scholar]
- 14.Albanese A, Tang PS, Chan WC. The Effect of Nanoparticle Size, Shape, and Surface Chemistry on Biological Systems. Annu. Rev. Biomed. Eng. 2012;14:1–16. doi: 10.1146/annurev-bioeng-071811-150124. [DOI] [PubMed] [Google Scholar]
- 15.Wilcoxon JP, Martin JE, Provencio P. Size Distributions of Gold Nanoclusters Studied by Liquid Chromatography. Langmuir. 2000;16:9912–9920. [Google Scholar]
- 16.Song Y, Jimenez V, McKinney C, Donkers R, Murray RW. Estimation of Size for 1–2 nm Nanoparticles Using an HPLC Electrochemical Detector of Double Layer Charging. Anal. Chem. 2003;75:5088–5096. [Google Scholar]
- 17.Yoo B, Ma K, Wiesner U, Bradbury M. New Analytical Tools for Characterizing Ultrasmall Silica-based Nanoparticles. RSC Adv. 2017;7:16861–16865. doi: 10.1039/C7RA01349C. [DOI] [PMC free article] [PubMed] [Google Scholar]
- 18.Wu Z. Synthesis and Characterization of Active Esterfunctionalized Fluorescent Polymers: New Materials for Protein Conjugation. J. Appl. Polym. Sci. 2008;110:777–783. [Google Scholar]
- 19.Larson DR, Ow H, Vishwasrao HD, Heikal AA, Wiesner U, Webb WW. Silica Nanoparticle Architecture Determines Radiative Properties of Encapsulated Chromophores. Chem. Mater. 2008;20:2677–2684. [Google Scholar]
- 20.Ma K, Sai H, Wiesner U. Ultra-small Sub-10 nm Near Infrared Fluorescent Mesoporous Silica Nanoparticles. J. Am. Chem. Soc. 2012;134:13180–13183. doi: 10.1021/ja3049783. [DOI] [PubMed] [Google Scholar]
- 21.Ma K, Werner-Zwanziger U, Zwanziger J, Wiesner U. Controlling Growth of Ultra-Small Sub-10nm Fluorescent Mesoporous Silica Nanoparticles. Chem. Mater. 2013;25:677–691. [Google Scholar]
- 22.Benezra M, Phillips E, Overholtzer M, Zanzonico PB, Tuominen E, Wiesner U, Bradbury MS. Ultrasmall Integrin-targeted Silica Nanoparticles Modulate Signaling Events and Cellular Processes in a Concentration-dependent Manner. Small. 2015;11:1721–32. doi: 10.1002/smll.201402331. [DOI] [PMC free article] [PubMed] [Google Scholar]
- 23.Chithrani BD, Chan WC. Elucidating the Mechanism of Cellular Uptake and Removal of Protein-Coated Gold Nanoparticles of Different Sizes and Shapes. Nano Lett. 2007;7:1542–50. doi: 10.1021/nl070363y. [DOI] [PubMed] [Google Scholar]
- 24.Montet X, Funovics M, Montet-Abou K, Weissleder R, Josephson L. Multivalent Effects of RGD Peptides Obtained by Nanoparticle Display. J. Med. Chem. 2006;49:6087–93. doi: 10.1021/jm060515m. [DOI] [PubMed] [Google Scholar]
- 25.Schottler S, Becker G, Winzen S, Steinbach T, Mohr K, Landfester K, Mailander V, Wurm FR. Protein Adsorption is Required for Stealth Effect of Poly(Ethylene Glycol)- and Poly-(Phosphoester)-coated Nanocarriers. Nat. Nanotechnol. 2016;11:372–7. doi: 10.1038/nnano.2015.330. [DOI] [PubMed] [Google Scholar]
Associated Data
This section collects any data citations, data availability statements, or supplementary materials included in this article.