

SUMMARY
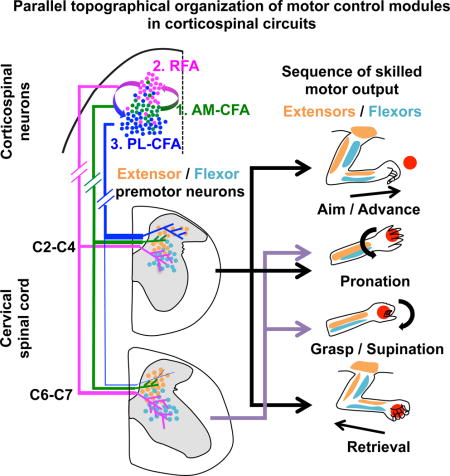
Corticospinal neurons (CSNs) represent the direct cortical outputs to the spinal cord and play important roles in motor control across different species. However, their organizational principle remains unclear. By using a retrograde labeling system, we defined the requirement of CSNs in the execution of a skilled forelimb food-pellet retrieval task in mice. In vivo imaging of CSN activity during performance revealed the sequential activation of topographically ordered functional ensembles with moderate local mixing. Region-specific manipulations indicate that CSNs from caudal or rostral forelimb area control reaching or grasping, respectively, and both are required in the transitional pronation step. These region-specific CSNs terminate in different spinal levels and locations, therefore preferentially connecting with the premotor neurons of muscles engaged in different steps of the task. Together, our findings suggest that spatially defined groups of CSNs encode different movement modules, providing a logic for parallel-ordered corticospinal circuits to orchestrate multistep motor skills.
eTOC
What are the neuronal circuits underlying goal-directed motor skills and how are they organized and spatiotemporallly activated?
INTRODUCTION
In rodents and primates, goal-directed forelimb motor skills are used in many aspects of daily life, a common one being reaching for food and placing it in mouth (Iwaniuk and Whishaw, 2000; Lemon, 2008; Levine et al., 2012). Accomplishing this task requires multiple steps with different muscles and joint movements, and a major challenge is to understand how they are coordinated. Cerebral cortical areas related to movement control were initially identified more than a century ago through electrical stimulation and surgical lesion studies, but the functional organization of these areas continues to be intensively debated (Graziano and Aflalo, 2007; Kalaska, 2009; Lemon, 2008; Miri et al., 2013; Shenoy et al., 2013; Taylor and Gross, 2003). The traditional view holds that different cortical areas are arranged in a hierarchical organization in which the role of somatosensory cortex (S1) is for receiving sensory information, the primary motor cortex (M1) for controlling specific body/limb movements, and the secondary motor cortex (M2), as a higher order region, for indirectly modulating movements through the primary motor cortex. More recently, an alternative model posited that the motor cortical areas are organized as a map of the natural behavioral repertoire (Graziano and Aflalo, 2007). However, it is not clear how such a behavior map can be realized at the neuronal circuits level.
Corticospinal neurons (CSNs) in the cerebral cortex send their direct projection to the spinal cord, and should be the most logical candidate for analyzing the organizing principle for cortical control of spinal motor programs (Kuypers, 1981). However, in both primates and rodents, only a subset of neurons in cortical layer V are CSNs. Moreover, they are distributed over multiple cortical regions such as M1, M2 and S1, and in clusters such as the rostral forelimb area (RFA) and the caudal forelimb area (CFA) (Kamiyama et al., 2015; Nudo and Masterton, 1990). With conventional methods, previous studies could only analyze mixed subsets of cortical neurons including both CSNs and other cortical neurons. Therefore, these approaches neither distinguished the biological diversity of cortical neurons nor identified CSN-specific functions in these areas (Bonazzi et al., 2013; Brown and Teskey, 2014; Donoghue and Wise, 1982; Harrison et al., 2012; Ramanathan et al., 2006; Tennant et al., 2011). Consequently, the knowledge about the functional logic and anatomical organization of CSNs has remained fragmentary.
In this study, by using a viral targeting method to achieve highly efficient labeling of CSNs and studying their functions in the context of a multistep forelimb food pellet retrieval task (Farr and Whishaw, 2002), we addressed: (a) What is the spatiotemporal activation pattern of CSNs during this task? (b) Whether different steps of this skilled task are controlled by CSNs in different cortical regions or as a whole? (c) How CSNs and their axons are organized in the cortex and spinal cord to transform cortical commands into distinct muscle activation patterns? These questions are essential for understanding the organizational and functional logic of CSN circuits.
RESULTS
Efficient Retrograde Viral Labeling of CSNs
To label CSNs, we injected a highly efficient retrograde pseudo-typed lentivirus (HiRet) expressing mCherry (HiRet-mCherry) (Kato et al., 2011; Kinoshita et al., 2012), into the cervical spinal cord (C3–C7) of mice at postnatal day 4 (P4) (Figure 1A–B). These viral vectors are expected to be taken up by axons terminating in the spinal cord, leading to mCherry expression in the originating neurons. In the cerebral cortex, mCherry-expressing neurons are widespread but showing local clusters in individual regions (Figure 1C). In addition to a rostral area in the secondary motor cortex (rostral forelimb area, or RFA), there is a large caudal area covering the overlapping primary motor and somatosensory cortices (caudal forelimb area, or CFA), and a small caudal lateral area in the secondary somatosensory cortex (Figure 1C). By comparing with another retrograde tracer, retrograde beads, injected at P28 (Figure 1D), we found ~98% of the retrograde beads-labeled cortical neurons were co-labeled by mCherry at both RFA and CFA, indicating a high efficiency in targeting the CSNs by HiRet (Figure 1D–I). No neurons were labeled in allocortical regions such as hippocampus and basolateral amygdala (Figure 1J–L).
Figure 1. Efficient Labeling of CSNs by Spinal Injection of HiRet Vectors at P4.
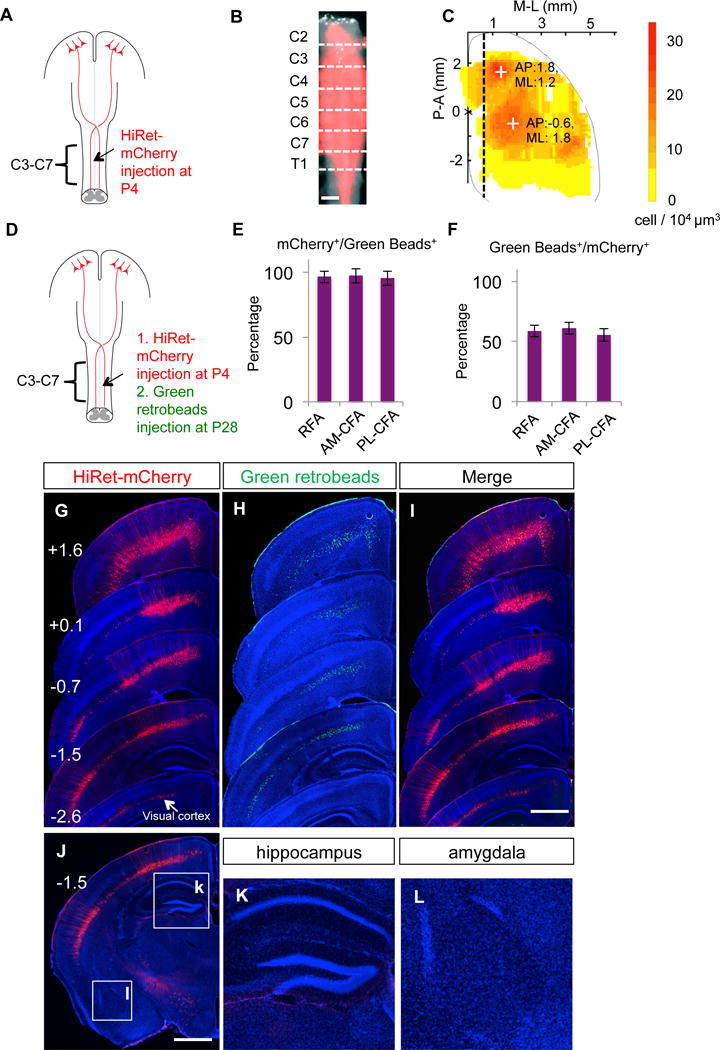
(A) Experimental paradigm for B–C.
(B) Representative whole spinal cord images showing the diffusion of HiRet-mCherry (red) in C2-T1. Scale bar: 1 mm.
(C) Heat map of the density of retrogradely labeled CSNs. The dotted line depicts the boundary between RFA/CFA and cingulate cortex (unfolded to the left). Two crosses mark the two centers of mass for CSNs with coordinates. N=8 mice.
(D) Experimental paradigm for E–L.
(E, F) Percentage of mCherry+/Green beads+ neurons (E) and Green beads+/mCherry+ neurons (F) in multiple cortical areas (RFA, anterior-medial (AM) CFA, and posterior-lateral (PL) CFA. 6 mice (4 sections of each area per mouse) were quantified.
(G–L) Images of a series of coronal brain sections showing HiRet-mCherry (G, injected at P4), green retrobeads (H, injected at P28) and their merge (I). The numbers (mm) in G indicated the position of the sections related to bregma. No labeling was seen in hippocampus (K) and basolateral amygdala (L). Scale bars: 1 mm. See also Figure S1.
In addition to motor cortex, this neonatal labeling method also labeled some cells in the visual cortex (Figure 1G). To assess their fate in the adult, we first injected HiRet-Cre to the spinal cord at P4, then AAV-FLEX-GFP to motor cortex (GFP) and AAV-FLEX-tdTomato to visual cortex (RFP) at 8–9 weeks (Figure S1A, S1B). We found that, despite many RFP+ cells in the visual cortex, no RFP+ axons could be detected at the pyramid where cortical axons enter the spinal cord (Figure S1F, S1G), consistent with reports that the spinal projections from the visual cortex undergo developmental pruning (Low et al., 2008; O’Leary, 1992; O’Leary and Koester, 1993). In contrast, there were comparable numbers of GFP+ cells in the motor cortex (Figure S1C, S1G) and GFP+ axons at the pyramid (Figure S1E, S1G), suggesting that most CSNs in the motor cortex labeled at neonatal age retain their spinal projections in the adult.
Phase Specificity and Functional Topography of Task-related CSN Activity
The high labeling efficiency of HiRet vectors offered an intersectional tool to achieve selective gene expression in CSNs. First, we introduced GCaMP6s, a fluorescent calcium indicator, to CSNs and examined their activation during behavior. Specifically, in the mice with neonatal spinal injection of HiRet-Cre, AAVs expressing Cre-dependent GCaMP6s (FLEX-GCaMP6s) (Chen et al., 2013) were injected into various cortical sites at P56–70 (Figure 2A; S2A). With a miniaturized fluorescent microscope (Ziv et al., 2013) mounted onto the mouse’s head (Figure 2B), we were able to image CSN activity through the apical dendritic trunk of CSNs in freely moving mice (Figures 2C,2D,S2B,S2C and S2D).
Figure 2. Phase Specificity and Functional Topography of CSN Activation Patterns during Pellet-Retrieval Task.
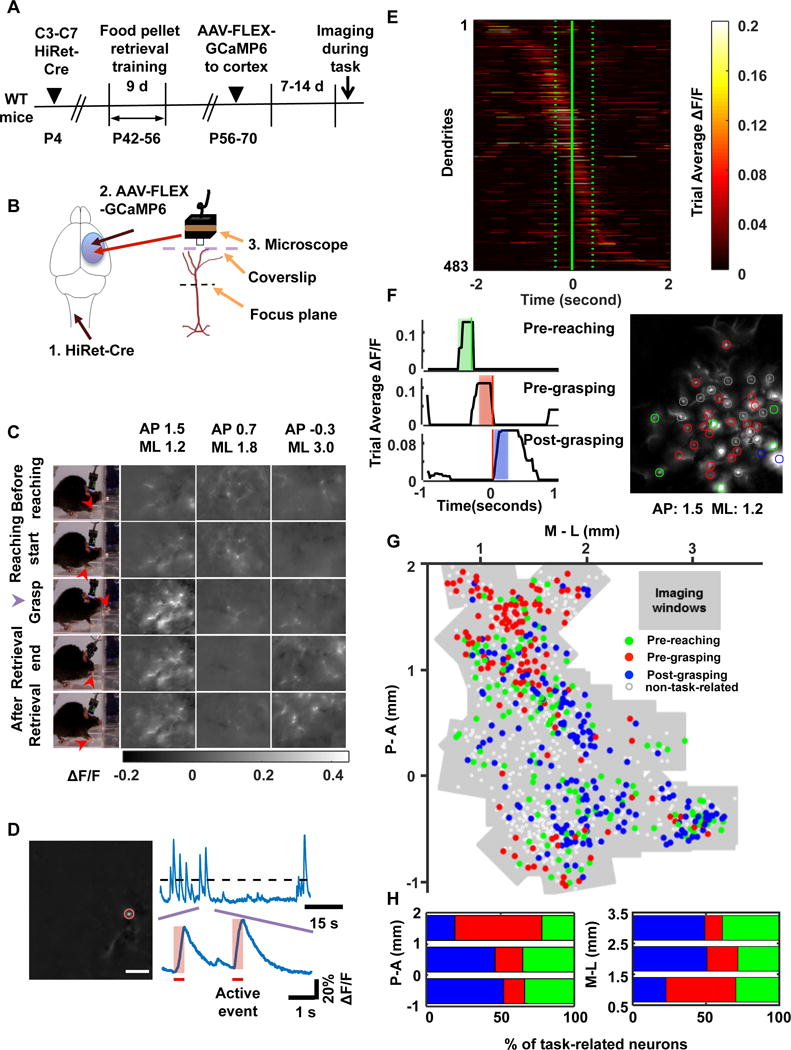
(A) Schematic drawing of the experimental procedure.
(B) Diagrams showing steps of GCaMP6s labeling and CSN imaging.
(C) First column: video frames showing a mouse at consecutive stages of pellet retrieval task (red arrow, animal’s forepaw position). Second, third and fourth columns: representative calcium movie frames showing dendritic activities of CSNs in AP: 1.5, ML: 1.2; AP: 0.7, ML: 1.8; and AP: −0.3, ML: 3.0 at consecutive stages of the food pellet retrieval task. Calcium signals are expressed as ΔF/F0 (F0 is the time average of the whole movie).
(D) Procedures for identifying the activation of CSN dendrites. The left image shows one example of dendrites identified from a calcium movie by ICA analysis. The brightest spot in a dendritic tree, corresponding to the trunk (highlighted by a red circle), is used as region of interest for temporal signal analysis. The upper trace shows the temporal signal of the dendrite. The bottom trace shows magnified calcium events. The horizontal bar indicates the rising phase of the calcium event, which is associated with neuronal activation and used in subsequent analysis.
(E) The trial-average activities of CSN dendrites during the pellet-retrieval task. The active event traces from different trials were aligned by the time when the forepaw was maximally extended prior to grasping (solid vertical line), then averaged across trials (number of trials per mouse: 12±1). All the task-related dendritic traces were sorted based on their peak activation time during the task and displayed in a temporal raster plot (483 dendrites in 28 mice). The average reaching-start or retrieval-end timing is indicated by dotted lines.
(F) Left: Examples of the trial-averaged activity traces of CSN dendrites. A 200 ms window up to reaching onset (green shading, pre-reaching), up to grasping (red shading, pre-grasping), or after grasping (blue shading, post-grasping) was used to calculate the average CSN activity in each of the three task phases. The reaching-start time is indicated by the green vertical line. The red vertical line indicates the time when the forepaw was maximally extended prior to grasping. Right: Example image showing the mixed distribution of CSNs with different phase preferences in the same cortical area. All the detected dendrites in a field of view are included through maximum projection, and the activation preference of each dendritic trunk is labeled by a circle colored according to the above RGB scheme. Grey circles indicate the dendrites whose activities are not related to the task. This image shows more pre-grasping activity at AP: 1.5 mm; ML: 1.2 mm.
(G) Functional topography of corticospinal neurons during goal-directed actions. An RGB color-coding scheme showed the preference of CSN activation for each phase of the task (e.g., green for pre-reaching, red for pre-grasping, blue for post-grasping, and white for non-task-related). The preferences of all the imaged CSNs (n = 983) were mapped onto a common spatial map, and the imaged areas (38 imaged areas from 28 mice) were indicated by grey rectangles. Scale bars in C, D and F: 100 μm.
(H) The percentage of task-related CSNs that show maximum activation for each of the three task phases along the anterior-posterior or medial-lateral axis of the cortex. The distribution of activation category is significantly dependent on spatial position (P < 0.0001, Chi-square test). See also Figure S2.
The behavioral assay that we used was a food-pellet retrieval task. After training, mice can reach through a narrow slit in a Plexiglas box to grasp and retrieve a food pellet (Azim et al., 2014; Xu et al., 2009). To determine the activation dynamics of CSNs, we imaged their calcium activity while mice repeatedly performed the task (Figure 2C; Supplementary movie S1). Since the movement of mouse forelimb is relatively fast, detecting movement-related CSN activation requires separating the calcium signal related to CSN activation from that reflecting intracellular calcium decay. We therefore identified the rising phase of each calcium transient as the active event of CSNs (Figure 2D). Then, we sorted these CSN active events according to their temporal activation patterns during behavior, grouped them in 200 ms pre-reaching, pre-grasping, or post-grasping windows (Figure 2E, 2F), and mapped them onto the cortical positions of CSNs (Figure 2G).
This analysis reveals a topographical distribution of CSN activation patterns: the percentage of pre-grasping activated CSNs increased in anterior and medial directions, and the percentage of pre-reaching and post-grasping activated CSNs increased in posterior and lateral directions (Figure 2H). Thus, CSN activity in the RFA (located anterior-medially) is dominated by the pre-grasping pattern, whereas that in the CFA (located posterior-laterally) is enriched for the pre-reaching or post-grasping pattern (Figure 2H). This trend is observed globally at the population average level, whereas neurons with preference for each movement phase appear to be mixed locally at different proportions (Figure 2G; S2E). These results suggest that region-specific CSNs encode the temporal phase of activation in the pellet-retrieval task.
Roles of CSNs in Specific Steps of Forelimb Motor Skills
We next examined the behavioral outcomes after ablation of the entire population of CSNs (Figure 3A–F; S3A–I). We injected HiRet vectors carrying flip-excision diphtheria toxin receptor (HiRet-FLEX-DTR) into the cervical spinal cord of cortex-specific Emx1-Cre mice (Emx1CreDTR) (Bareyre et al., 2005) (Figure 3A). Diphtheria toxin (DT) administration efficiently ablated CSNs, as indicated by lack of PKCγ immunoreactivity, which marks corticospinal tract axons (Liu et al., 2010), in the dorsal column of Emx1CreDTR mice (Figure 3B). While CSN ablation did not impair open-field walking performance (Figure S3A–C), it significantly reduced success rates in the food pellet retrieval task (Figure 3C). Furthermore, these CSN-ablated mice also showed deficits in another skilled forelimb task, Vermicelli handling (Allred et al., 2008; Xu et al., 2009) (Figure S3E). Such defects are not due to muscle strength alterations because their grip strength was not affected (Figure S3D). Thus, CSNs are required for the accurate execution of skilled motor tasks.
Figure 3. Differential and Overlapping Requirement of RFA or CFA-Corticospinal Neurons in Pellet-Retrieval Task.
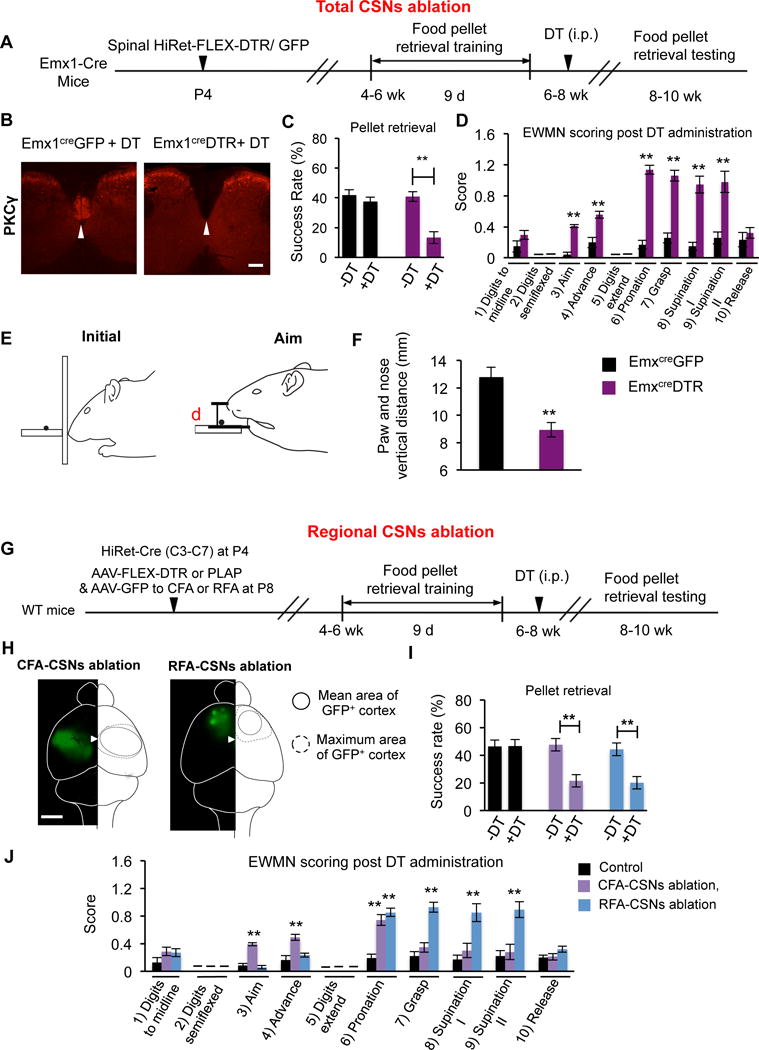
(A) Experimental paradigm for B–F.
(B) Transverse spinal section (C7) in Emx1Cre DTR or control Emx1Cre GFP mice showing PKCY immunostaining. The arrowheads indicate the location of main CST. Scale bar: 200 μm.
(C) The success rate of food pellet retrieval test of control and CSN-ablated mice at 1d pre (−DT) and 20d post DT (+DT) administration. **: p < 0.01, Student’s t test. N = 6 for each group.
(D) EWMN scoring results. **: p < 0.01, n=117 and 136 reaches for Emx1Cre DTR (n=6) and Emx1Cre GFP (n=6) mice respectively. Student’s t test.
(E) Cartoon illustrating sagittal views of initial and aiming stages during pellet-retrieval. Note that comparing to the initial stage, the head is lifted, leaving space for forepaw to advance and cross the slot during aiming.
(F) Distances between the nose and paw when the forepaw is crossing the slot (d in E) in different groups (F). **: p < 0.01, Student’s t test. n = 6 (43 reaching), 6 (47 reaching) for control and CSNs ablated mice, respectively.
(G) Experimental paradigm for H–J.
(H) Representative GFP images showing virally transduced areas in CFA (left) and RFA (right). The inner and outer circles represent the mean and maximal coverage areas in CFA and RFA, respectively. The arrowhead represents the location of bregma.
(I) Success rates of pellet-retrieval task. **: p < 0.01, n=6, 7 and 6 for control, CFA and RFA CSNs ablated mice.
(J) EWMN scores. **: p < 0.01 (comparing to control group), n=116, 139 and 124 for control, CFA and RFA ablated mice, respectively. One-way ANOVA followed by post hoc Student’s t test. See also Figure S3.
The pellet-retrieval task involves at least 10 sequential steps, including reaching-related moves (digits to midline, digits semiflexed, aim and advance, digit extend), transition from reaching to grasping (pronation), grasping, and retrieval (supination 1 and 2, release). With an established scoring method (Farr and Whishaw, 2002), we analyzed which steps were compromised by CSN ablation (Figure 3D). In the reaching stage, the CSN-ablated mice were defective in “aiming” and “advance” steps (Figure 3D), showing highly variable paw reaching trajectories and broad movement endpoint distributions (Figure S3F–I). When the forepaw is crossing the slot, the distance between the paw and nose was significantly shorter in CSN-ablated mice (Figure 3E–F), suggesting a defect in coordinating head lifting with paw reaching. In addition, CSN ablation also significantly disrupted the pronation, grasp, supination I and II steps of the task (Figure 3D). However, once the pellet was grasped and retrieved, CSN-ablated mice could release the pellet into their mouth in the final step of the retrieval (Figure 3D). Digit semiflexion and extension were also unaffected by CSN ablation (Figure 3D). Thus, CSNs are required for specific steps of this skilled task.
Differential Control of Sequential Skilled Movements by RFA and CFA CSNs
Knowing the function of the entire CSN population, we next determined the respective functions of two major clusters of CSNs in RFA and CFA in the pellet-retrieval task. Combining spinal injection of HiRet-Cre with cortical injection of AAV-FLEX-DTR to either RFA or CFA, we selectively ablated RFA-CSNs or CFA-CSNs upon DT treatment (Figure 3G, 3H). Each ablation significantly reduced the overall success rates (Figure 3I), but produced different types of errors (Figure 3J). RFA-CSN ablation significantly increased errors in grasping, pronation, but not reaching (Figure 3J). As a result, their reaching trajectories were still consistent from trial to trial (Figure S3J), but the positions of the endpoints significantly deviated from the pellet (Figure S3K–N). By contrast, CFA-CSN ablation led to higher errors in the aim and advance steps during reaching and the pronation step (Figure 3J). Their forepaw trajectories became highly variable from trial to trial (Figure S3J), resulting in a broad distribution of endpoints around the pellet (Figure S3K–N). Other steps of the task were not significantly affected by such regional ablation (Figure 3J). Thus, CFA- and RFA-CSNs have respective roles in reaching and grasping, with overlapping control of the transitional pronation step.
Topographical Organization of Joint Movements Evoked by Direct CSN Activation
We next examined whether direct activation of these CSNs would evoke distinct joint/muscle movements involved in the forelimb skill. As prolonged cortical stimulation has been used to elicit multiple joint movements resembling different behavioral types (Bonazzi et al., 2013; Brown and Teskey, 2014; Graziano et al., 2002; Harrison et al., 2012; Ramanathan et al., 2006), we labeled CSNs including their apical dendrites with light-sensitive channelrhodopsin with YFP tag (ChR2-YFP) (Figure 4A,4B), performed CSN opto-stimulation (500ms trains) in a broad cortical area (Figure 4C) and mapped resultant joint movements (Figure 4D). There is a remarkable topographic representation of different joints, with distal ones (digits and wrist) mainly in RFA and anterior medial CFA, and proximal ones (elbow and shoulder) in a broad cortical region including posterior lateral CFA. These opto-stimulation results are consistent with the results from imaging (Figure 2) and ablation studies (Figure 3), suggesting respective control by CFA-CSNs and RFA-CSNs in reaching (more dependent on proximal joints) and grasping (more dependent on distal joints). Intriguingly, not all of joint movements involved in the food pellet retrieval task could be seen after such CSN stimulation. For example, only the closure movement (in Grasping) was induced in digits. Several movements in the pellet-retrieval task, including digit extension (in Digits extended, and Release), elbow abduction and wrist rotational movements (in Pronation), were not observed after CSN stimulation (Supplementary Table 1). These results reveal that stimulation of CSNs could partially reconstitute the movement repertoire of the food pellet retrieval task.
Figure 4. Prolonged Opto-Stimulation of Labeled Corticospinal Neurons Elicited Patterned Forelimb Joint Movements.
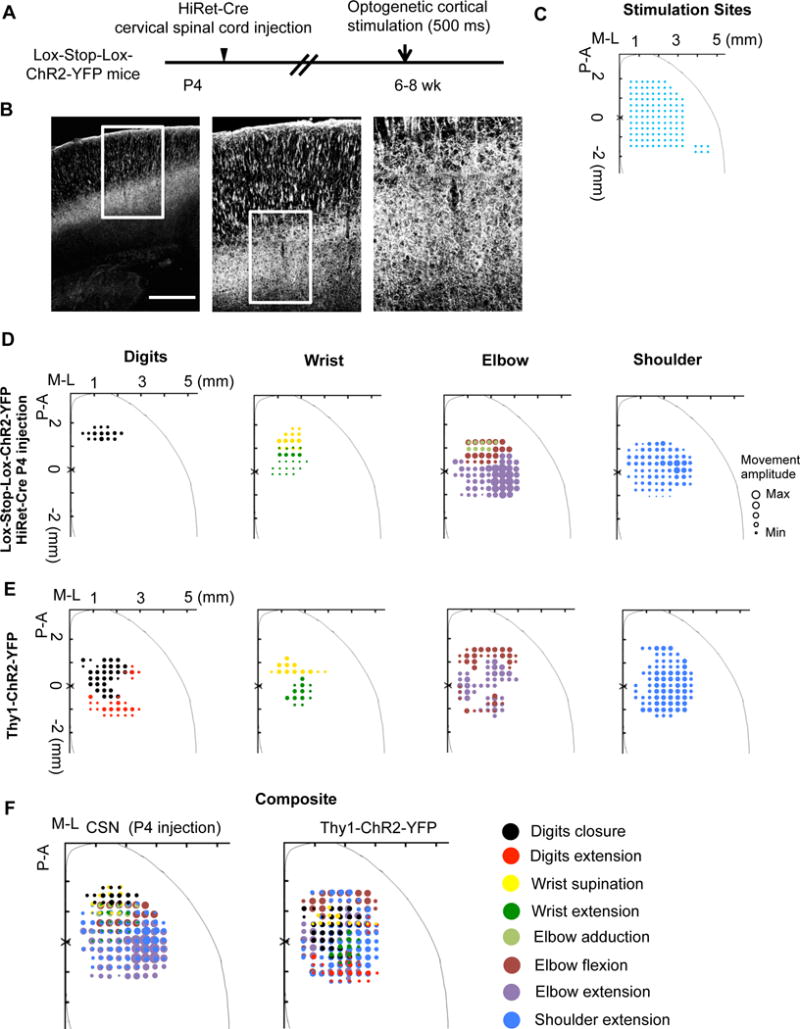
(A) Experimental paradigm.
(B) Representative images showing the specific ChR2-YFP expression in CSNs. Scale bars: 0.5 mm.
(C) Opto-stimulation sites (blue dots).
(D, E) Cortical motor maps for digits, wrist, elbow, and shoulder movements elicited by long-duration opto-stimulation of labeled CSNs (D) or cortical neurons in adult Thy1-ChR2-YFP mice (E). The diameters of circles at each stimulation site are proportional to the peak angle changes in individual joint movements: digit closure (30.6°), wrist supination (34.4°), wrist extension (10.3°), elbow flexion (14.3°), elbow adduction (9.6°), elbow extension (14.3°), and shoulder extension (28.9°).
(F) Composite motor maps of all joint movements elicited by opto-stimulation in the same groups as described above. See also Figure S7.
A possible explanation for the results above is that the other movement steps are mediated by CST-independent indirect pathways. To test this, we performed similar long-duration cortical stimulation in Thy1-ChR2 mice, in which most layer 5 pyramidal neurons express ChR2 (Arenkiel et al., 2007; Harrison et al., 2012). Consistent with previous studies (Harrison et al., 2012), cortical stimulation often elicited bilateral, multiple joint movements (Figure 4E), some of which were similar to those evoked by CSN stimulation (Figure 4D, 4F). Different from those induced by CSN-stimulation, Thy1-ChR2 elicited joint movements showed no distinct topographic representation. However, in these mice, stimulation at a relatively posterior region elicited digit extension (Figure 4E, 4F, and Supplementary Table 1), which was not found upon CSN stimulation (Figure 4D, 4F and Supplementary Table 1). Together with the data that the digit extension involved in pre-pronation and food pellet release steps were not affected by CSN ablation (Figure 3), these results suggested that digit extension is likely to be independent of CSNs. Thus, CSNs and indirect corticospinal pathways might have distinct roles in the skilled motor task.
Preferential Activation of Forelimb Muscles by Short Stimulation of Region-Specific CSNs
Different from long-duration stimulation, short stimulation at threshold are likely to activate more directly connected muscles. Thus, we used a short-duration opto-stimulation procedure (Ayling et al., 2009) to assess whether these CSNs exert differential controls over different groups of forelimb muscles. Specifically, we stimulated ChR2-expressing CSNs in four distinct sites: RFA (zone 1, AP: 1.8±0.3, ML: 1.2±0.2 mm to Bregma), intermediate area between RFA and CFA (zone 2, AP: 0.6±0.2, ML: 1.2±0.3), anterior-medial CFA (AM-CFA) (zone 3, AP: 0.2±0.2, ML: 2.1±0.3), and posterior-lateral CFA (PL-CFA) (zone 4, AP: −0.8±0.2, ML: 3.0±0.3) (Figure 5A) and recorded resultant EMG signals in different muscles in the forelimb (Figure 5B–D, no digit muscles because of their small size).
Figure 5. Distinct Forelimb Muscle Groups Preferentially Activated by Short-Duration Opto-Stimulation of Region-Specific CSNs.
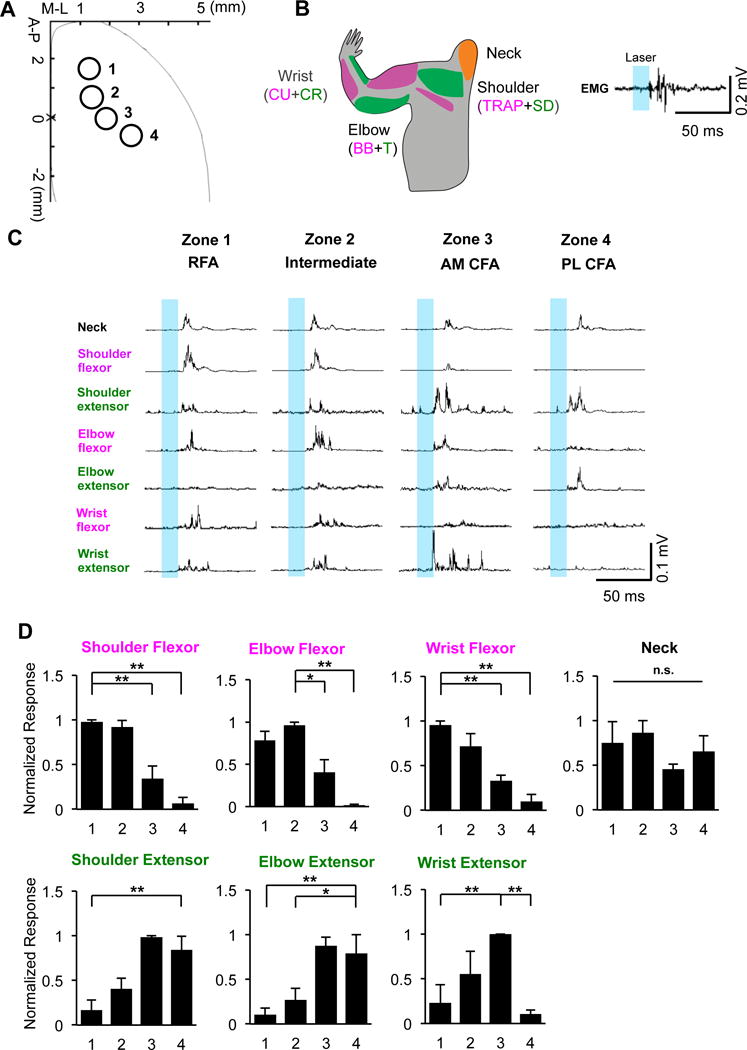
(A) Cortical areas of optic stimulation (473 nm laser pulse was delivered at 2-4 mW with 15 ms duration). Zone 1: RFA; Zone 2: intermediate area between RFA and CFA; Zone 3: anterior-medial (AM)-CFA; and Zone 4: posterior-lateral (PL)-CFA, respectively.
(B) Schematic drawing of muscles for EMG recording (left), and a representative EMG trace from elbow flexor induced by opto-stimulation (right). Neck muscles (biventer cervicis and sternomastoid), trapezius (T) and spinodeitoideus (SD) (shoulder flexor and extensor), biceps brachii (BB) and triceps (T) (elbow flexor and extensor), flexor carpi ulnaris (CU) and extensor carpi radialis (CR) (wrist flexor and extensor).
(C) Rectified and averaged EMG responses induced by optogenetic stimulation in each of 4 cortical zones. Signals were averaged from 6 repetitive stimulations at each zone.
(D) Normalized response of individual extensor/flexor elicited by short-duration CSN-specific opto-stimulation at 4 cortical zones. In each case, signals were normalized to maximal responses and averaged across three animals. *, ** and n.s., p < 0.05, p < 0.01 and no statistical significance, respectively. One-way ANOVA followed by post-hoc Tukey’s multiple comparisons tests. See also Figure S6.
Short-stimulation elicited muscle activation patterns largely correlated with the results of long-duration stimulation. For example, RFA-CSNs (zone 1) stimulation activated both distal and proximal muscles, but the stimulation of CSNs in PL-CFA (zone 4) preferentially engaged proximal muscles. However, a surprising yet striking finding is that stimulation of CSNs from RFA and CFA led to complementary muscle activation patterns in the extensors and flexors that control shoulder, elbow and wrist (Figure 5C and 5D): RFA-CSNs (zone 1) and CSNs in PL-CFA (zone 4) preferentially activated flexors and extensors, respectively, and CSNs in other areas (zones 2 and 3) showed mixed responses. This differential control of extensors and flexors by region-specific CSNs has not been reported before, but may underlie some of our functional observations from long-duration stimulation and ablation.
Topographical Terminations of CSN Axons in Cervical Spinal Cord
To complement the functional analyses, we next determined the anatomical basis of different functions of region-specific CSNs by analyzing their axonal projections. Thus, AAV-tdTomato-p2A-SypGFP (Oh et al., 2014) was injected into different cortical areas (similar to locations in Figure 5), in order to anterogradely label CST axons (RFP) and their synaptic structures (GFP) (Figure S4A, S4B). In the cervical spinal cord, these CSNs from different cortical sites exhibit remarkably distinct termination patterns, not only in different anterior-posterior (A-P) spinal cord levels (Figure 6A, 6B) but also in different locations along dorsal-ventral (D-V) and medial-lateral (M-L) axes (Figure 6A, 6C, 6D). For example, along the A-P axis, RFA CST axons terminate evenly at different levels from C2-C7, but those from posterior-lateral CFA terminate predominantly at C2–C3. On D-V axis, CST axons from zones 3 and 4 (AM- and PL-CFA) terminate in more dorsal laminae than those from zones 1 (RFA) and zone 2 (intermediate). On M-L axis, CST axons from PL-CFA show a more lateral distribution when compared to those from other areas.
Figure 6. Topographic Terminations of Region-Specific CST Axons in Cervical Spinal Cord.
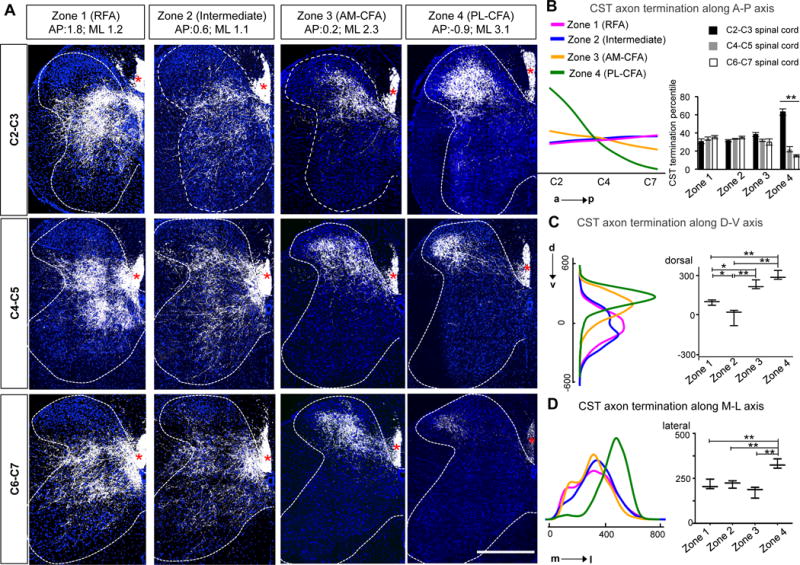
(A) Representative merged images of axons (RFP, white) and synaptic terminals (SypGFP, green) in different spinal cord sections (C2–C3, C4–C5 and C6–C7) showing termination patterns of CST axons from different cortical areas (injection site indicated on the top of images). Asterisks indicates CST main tract. Scale bar: 500 μm.
(B, C, D) Left: Density maps of CST axon termination along the anterior-posterior (A–P, B); dorsal-ventral (D–V, C); and medial-lateral (M–L, D) axes of the cervical spinal cord. The unit in C, D is μm. The integral of each curve equals 1. Right: (B) Quantification of CST termination percentile in different spinal cord levels at 4 different zones. **, p < 0.01, One-way ANOVA. (C, D) Medians of CST axon termination in dorsal-ventral (C) and medial-lateral (D) position. For C,D, the maximal and minimal values were marked as top and bottom error bars, respectively. ** and *, p < 0.01 and p < 0.05, One-way ANOVA, followed by Bonferroni post hoc correction for multiple comparisons. N= 5, 3, 3, and 4 mice for RFA, Intermediate, AM-CFA and PL-CFA zones, respectively. See also Figure S4, S6, S7.
To analyze the collaterals of CSNs in subcortical regions, we selectively labeled CSNs and examined their axonal projection and synapses by 3D reconstruction in a separate experiment. As expected, we observed some collaterals in a few brain regions, such as striatum, pretectal area (APT), pontine nuclei (Pn) and reticular formation (GiV) (Figure S4C, S4D, S4F). However, after quantifying the average synaptic densities per CSNs, we found that the terminal densities of CSNs in the spinal cord (about 90%) far outweigh those in subcortical regions (about 10% all together) (Figure S4G). This preferential termination pattern of CSNs is in contrast to the massive projections to various subcortical regions observed from non-selectively labeled layer V neurons (shown in Figure S4E, taken from Allen Brain Atlas), suggesting a major division between CSNs and other cortical neurons with corticofugal projections. Together, these results suggest that the spinal terminals of CSNs are likely to play a driving role in movement control.
Spatial Overlapping Between Premotor Neurons of Forelimb Muscles and Termination Zones of Region-Specific CSNs
Having revealed the spinal termination of region-specific CSNs and their functional connections with distinct muscle groups, we next analyzed the anatomical basis of such CST-muscle connections. Because of lack of mono-synaptic connection between CST and spinal motor neurons in rodents (Bareyre et al., 2005), the anatomically connected premotor neurons are expected to be the important targets for CSTs in regulating motor neuron activity (Lemon, 2008). As a proxy to the functional mediators between CSNs and motor neuron activity, we therefore mapped the last-order premotor neurons with an optimized recombinant rabies virus-based tracing method (Kim et al., 2016; Stachniak et al., 2014). Specifically, rabies virus ΔG-GFP/mCherry and AAV-FLEX-optimized Glycoprotein (AAV-FLEX-oG) were co-injected into different muscles of ChAT-Cre mice at P3 (Figure 7A, S5A). By doing this, ChAT+ motor neurons, but not sensory neurons, express G protein and further propagate rabies viruses from different muscles to their premotor neurons (data not shown).
Figure 7. Distribution of Premotor Neurons for Forelimb Muscles and Their Relationship with CST Terminations.
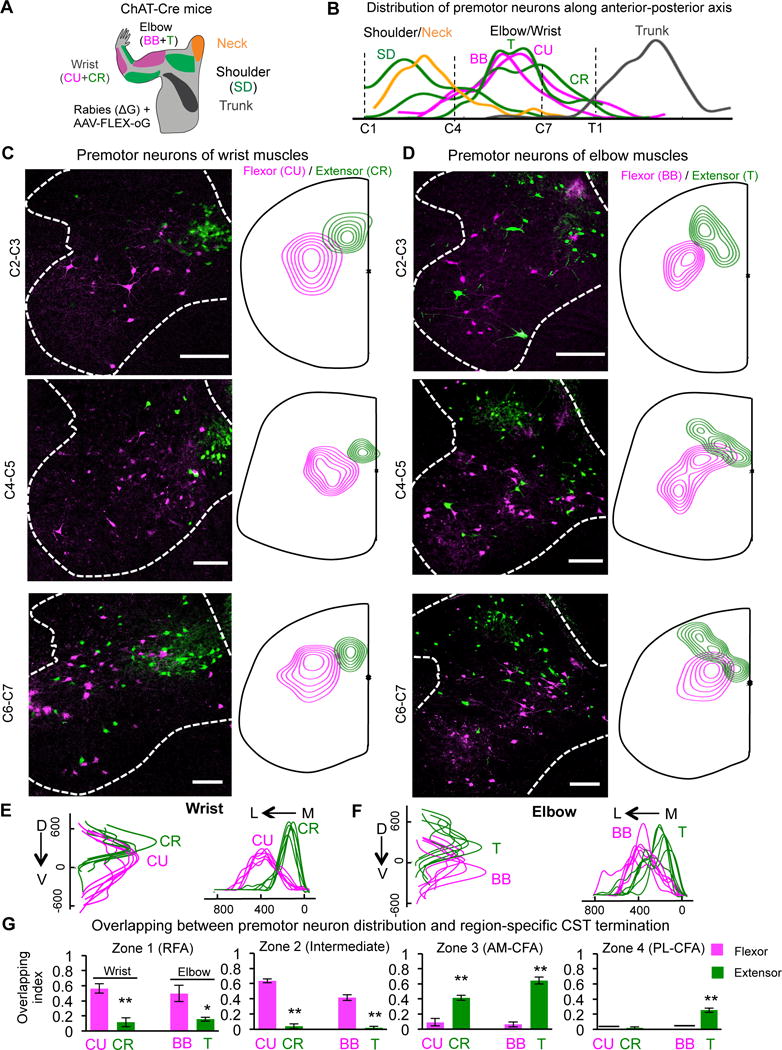
(A) Schematic drawing shows muscles that were co-injected with rabies (ΔG) and AAV-FLEX-oG viruses in ChAT-Cre mice for premotor neuron tracing. BB: biceps brachii, elbow flexor; T: triceps, elbow extensor; CU: carpi ulnaris, wrist flexor; CR: carpi radialis, wrist extensor, SD: spinodeitoideus, shoulder extensor and Neck (biventer cervicis and sternomastoid).
(B) The distribution of the premotor neurons for different muscles along the anterior-posterior axis of the spinal cord. Note that the premotor neurons of shoulder and neck muscles are located in C2–4, and those of the wrist and elbow in C4–7. The premotor neurons of the trunk muscle latissimus dorsi are mainly below T1.
(C, D) Representative images (Left panels) and density maps (right panels) of premotor neurons for wrist flexor (CU) and extensor (CR) (C) and elbow flexor (BB) and extensor (T) (D) at different cervical levels. Scale bar: 200 μm.
(E, F) Distributions of premotor neurons for wrist (E) (right, n = 6) and elbow (F) (left, n = 6) flexor (CU & BB in magenta) or extensor (CR & T in green) along the D–V and L–M axes in the cervical spinal cord of different mice. For wrist, Pd-v = 0.006, Pm-l < 0.001; For elbow, Pd-v = 0.002, Pm-l < 0.001.
(G) Quantification of the overlapping between the termination of CST axons from different cortical zones and the premotor neuron areas of wrist and elbow extensor (CR, T in green) and flexor (CU, BB in magenta) in the cervical spinal cord. The overlapping index is presented as the overlapping area between the core areas of CST termination and premotor neurons divided by the entire core area of CST termination along the cervical spinal cord. ** and *: p < 0.01 and p < 0.05, n = 3, 3 for each group, Student’s t test. See also Figure S5.
We noticed a remarkable segregation of premotor neurons for proximal vs. distal muscles along A-P axis (Figure 7B), and of those for extensors vs. flexors at different locations of the cervical spinal cord along D-V/M-L axes (Figure 7C–F). The premotor neurons of muscles in neck and shoulder are mainly located in C2–4, whereas those of distal muscles are located in C4–C7 (Figure 7B). At individual spinal cord levels, the premotor neurons for the extensors and flexors of wrist/elbow are differentially located in dorsal and intermediate laminae (Figure 7C–7F): premotor neurons of extensors are more dorsal/medial compared to those of the counterpart flexors (Figure 7E–7F), which is reminiscent of the segregation reported in hindlimb premotor neurons (Tripodi et al., 2011).
Importantly, these results revealed functionally relevant overlap between the premotor neurons of individual muscles and the termination zones of region-specific CSNs (Figure 7G). For example, RFA CST axons (zone 1) showed significant overlapping with the premotor neurons of the flexors of wrist and elbow, but not their extensors, consistent with the short-stimulation results showing the preferential activation of flexors by RFA-CSNs. Similarly, CST from posterior-lateral CFA (PL-CFA, zone 4) mainly terminated in the lateral-dorsal spinal cord in upper spinal levels (Figure 6) and preferentially overlapped with the premotor neurons for the extensors of elbow and shoulder (Figure 7G, S5B, S5D), consistent with the effects of these CSNs on preferentially activating forelimb extensors. Moreover, these CSNs from PL-CFA have predominant termination in C2–3 (Figure 6A,6B), consistent with their functional relevance to proximal muscles (Figures 2–5). In contrast, the premotor neurons of neck muscles distributed broadly in the cervical spinal cord and overlapped with CSNs from different cortical regions (Figure S5C, S5E), explaining the effects of their activation elicited by opto-stimulation in both RFA and CFA (Figure 5C, 5D).
Functional Assessment of Differential Spinal Termination of CSNs
Finally, we performed two sets of experiments to assess the correspondence between these anatomical and functional data. First, we selectively and retrogradely labeled CST axons projecting to the lower cervical spinal cord (C6–7) (Figure S6A). We found that labeled CSNs are mainly in RFA, with only a few in PL-CFA (Figure S6B), consistent with the anterograde tracing data shown in Figure 6. Interestingly, these RFA-CSNs labeled from C6–7 elaborated fewer collaterals in the upper spinal cord levels (C2–3) compared to the lower levels (C6–7) (Figure S6C). Consistent with this, opto-stimulation of these labeled RFA-CSNs preferentially activated the flexors of wrist and elbow (Figure S6D–F), providing additional verification of the topographic connections of region-specific CSNs and distinct muscle groups.
Second, we used a DREADD-mediated presynaptic silencing method (Mahler et al., 2014) to selectively silence CST axonal terminals at different segments (C3 or C7) of the spinal cord, and examined the joint movements elicited by long-duration stimulation of CSNs in different cortical sites (Figure S7A, S7B). We first expressed both ChR2 and hM4Di in total CSNs (Figure S7A, S7B). As shown in Figure S7C–F, CNO application at C7 compromised digit closure elicited by the stimulation of RFA CSNs, also reduced the elbow flexion elicited by stimulation of AM-CFA, but not elbow and shoulder extension elicited by PL-CFA. In contrast, CNO application at C3 significantly inhibited both the elbow flexion elicited by stimulation of AM-CFA and elbow and shoulder extension elicited by the stimulation of PL-CFA, but not the digit closure elicited by opto-stimulation in RFA (Figure S7C–F). Therefore, the distal joint movements were predominantly controlled by CST at lower (around C7) cervical spinal cord, while the proximal joint movements were more influenced by CST at upper (around C3) cervical spinal cord.
DISCUSSION
By analyzing the anatomy and function of CSNs, we have identified spatially defined neuronal populations in secondary motor cortex (RFA), primary motor cortex or somatosensory cortex (different parts of CFA), which have distinct spinal projections linking to different musculature groups and function in specific phases of a skilled forelimb motor task. These findings provide direct evidence for a motor circuit design with strong parallel features. This is different from the classical view of a hierarchical organization of sensorimotor cortical areas. While emphasizing the information flow between cortical regions, such a hierarchical view does not explain the long-standing observation that in addition to the primary motor cortex, other cortical regions such as somatosensory cortex and secondary motor cortex also send direct projection to the spinal cord (Dum and Strick, 2002; Nudo and Masterton, 1990). As CST axons are the direct cortical outputs to the spinal cord, our findings that distinct groups of CSNs encode different movement modules provide a foundational framework for future research to understand the relationship between the natural behavior repertoire (Graziano and Aflalo, 2007) and the somatotopy in the cerebral cortex (Penfield and Boldrey, 1937). Other contributing factors, including the modulatory effects of sensory inputs, cortical-cortical interactions, and the indirect corticofugal projections, such as the relay pathway mediated through the brainstem nucleus medullary reticular formation ventral part (MdV) (Esposito et al., 2014), may provide hierarchical integration of information in motor control.
Parallel pathways from CSN clusters to muscle groups
How CSN functions are organized spatially and temporally during skilled motor tasks has remained unclear (Graziano and Aflalo, 2007; Harrison and Murphy, 2014). Here we showed that the CSNs in different cortical regions terminate in different spinal levels along the A-P axis and different locations along D-V and M-L axes in a topographic manner. This topographical distribution of CSN terminals corresponds with the distribution of the last-order premotor neurons for different forelimb muscle groups, resulting in preferential regulation of different muscle groups by different populations of CSNs. Although our data did not rule out the contribution of other premotor neurons, these findings provide insights into the role of region-specific CSNs in executing different yet complementary controls of motor functions.
For CSNs in RFA, they terminate in the entire C2–7 levels. At C2–4 level, they connect to the premotor neurons of neck and shoulder muscles. At C4–7 levels, they preferentially connect with the premotor neurons of the flexor muscles of the contralateral forelimb. Consistent with this, RFA stimulation evokes EMG responses of flexors of wrist and elbow. When RFA-CSNs are selectively ablated, specific defects in goal-directed grasping/pronation are observed, which are critically dependent on wrist/digit flexors. On the other hand, RFA ablation did not affect reaching and retrieval steps, which involve shoulder and elbow extensors and could be compensated by CFA-CSN as well as other tracts, such as indirect subcortical relay pathways. CSNs in CFA preferentially connect with premotor neurons of the extensors of proximal muscle groups in C2–4. Consequently, their ablation led to deficits in goal-directed reaching but spared grasping functions. Together, these data suggest that CSNs are spatially segregated according to both the functions (flexor vs. extensor) and the positions (proximal vs distal) of the muscles that they control. Such embedding of functional features in somatotopic maps seems to be present in both the spinal cord and the motor cortex levels, suggesting a general organizing principle for the motor system.
We found that the majority of terminal/synapses formed by these CSNs are located in the spinal cord, suggesting a key role of the spinal terminals of CSNs in movement control. Based on their anatomical features such as direct projection from cortex to spinal cord and less collaterals than other descending tracts, CST has been proposed to exert more focused actions and mediate more fractionated movements typical for the use of the distal extremities (Kuypers, 1981). Consistent with this, studies in primates showed that although the axons of a small subset of pyramidal tract neurons sparsely branch to the striatum and claustrum, these neurons do not innervate other forebrain or midbrain regions (Parent and Parent, 2006). In rodents, the branching patterns of CSNs have been under debate due to limited sampling and mixed populations (Shepherd, 2014; Smith et al., 2014). With selective labeling of CSNs, our results suggested an evolutionarily conserved organization in mice that favors spinal innervation over other subcortical collateralizations. However, our data do not rule out the functional contributions of CSN collaterals in subcortical regions.
A corticospinal code and its implications for motor control
Together, our results suggested that during skilled motor tasks, subgroups of CSNs are activated in specific cortical locations and in precise temporal orders. Through their descending axonal projections, these CSNs preferentially connect with specific premotor neurons in the spinal cord and recruit specific muscle groups responsible for specific movement steps of the skilled task. Since CST axons are broadly terminated in dorsal horn and intermediate laminae, they likely act by modulating both sensory and motor processing in the spinal cord (Lemon, 2008).
Although our current studies analyzed several relatively broad cortical regions, RFA and different areas of CFA, in a single task, CSNs might have further anatomical and functional specifications. Indeed, there is a fair amount of functional heterogeneity in individual neuron activities within each of the broad areas. For example, while grasping related activity dominates in RFA-CSNs, there are also cells showing reaching and retrieval-related activity in this region. Therefore, different groups of CSNs may code different movement modules. Constructing a multiple step behavior will then involve the recruitment of individual CSN groups in correct order, analogous to composing a sentence (behavior) by stringing together different words (CSN groups). In addition, these CSNs might be functionally connected to the muscle synergy modules identified in the spinal cord (Bizzi et al., 2008; Levine et al., 2014). Future studies should identify the mechanisms through which different groups of CSNs are activated in specific locations and correct sequences.
Finally, the functional circuit architecture revealed here will likely provide significant insights for translational studies. For example, our results identified both CST-dependent and -independent movements, which should inform approaches to develop tailored neural repair strategies for stroke and spinal cord injury. In addition, despite recent advances in brain machine interface studies and prosthesis control (Courtine and Bloch, 2015; Lebedev and Nicolelis, 2017), the functional outcomes are still suboptimal. These approaches mainly rely on the signals extracted from un-specified cortical neurons. However, whether these signals control the activity of individual muscles to generate the causal forces for movement or directly specify the spatiotemporal trajectories of movement remain unclear (Kalaska, 2009; Lemon, 2008; Miri et al., 2013; Shenoy et al., 2013). Current computational models for motor cortex function and prosthesis control have not considered the striking diversity and specificity of corticospinal circuits revealed in this study. Thus, our results about specific functions of CSNs might provide a framework to advance such studies.
EXPERIMENTAL PROCEDURES
STAR*METHODS
KEY RESOURCE TABLE
| REAGENT or RESOURCE | SOURCE | IDENTIFIER |
|---|---|---|
| Antibodies | ||
| Chicken monoclonal anti-GFP | Abcam | Cat#ab1397 0 |
| Rabbit polyclonal anti-RFP | Abcam | Cat#ab3477 1 |
| Mouse monoclonal anti-NeuN | Millipore | Cat#MAB37 7 |
| Rabbit polyclonal anti-PKC gamma | Santa Cruz | Cat#sc211 |
| Goat polyclonal cholinergic acetyltransferase | Millipore | Cat#AB144 P |
| Biological Samples | ||
| N/A | N/A | N/A |
| Chemicals, Peptides, and Recombinant Proteins | ||
| Diphtheria toxin | Sigma | Cat# D0564 |
| Green Retrobeads™ | Lumafluor | Cat#N/A |
| Clozapine N-oxide | Enzo Life Sciences | Cat#BML-NS105-0025 |
| Critical Commercial Assays | ||
| N/A | N/A | N/A |
| Deposited Data | ||
| N/A | N/A | N/A |
| Experimental Models: Cell Lines | ||
| N/A | N/A | N/A |
| Experimental Models: Organisms/Strains | ||
| Mouse/C57Bl/6 | Charles River | Strain code#027 |
| Mouse/Emx1Cre | The Jackson Laboratory | Jax#5628 |
| Mouse/Rosa-LSL-ChR2EYFP | The Jackson Laboratory | Jax#12569 |
| Mouse/ChAT-Cre | The Jackson Laboratory | Jax#028861 |
| Mouse/Thy1-ChR2EYFP | The Jackson Laboratory | Jax#7612 |
| Recombinant DNA | ||
| AAV-GFP | This paper | Cat#N/A |
| AAV-FLEX-DTR | This paper | Cat#N/A |
| AAV-FLEX-PLAP | This paper | Cat#N/A |
| AAV-syn-FLEX-GCaMP6 | UPenn | Cat#PV2821 |
| AAV-syn-FLEX-hM4Di-mCitrine | Addgene | Cat#44362 |
| AAV-CAG-FLEX-GFP | Addgene | Cat#28304 |
| AAV-EF1α-FLEX-tdTomato | Addgene | Cat#50462 |
| AAV-tdTomato-P2A-SypEGFP | This paper | Cat#N/A |
| AAV-FLEX-tdTomato-P2A-SypEGFP | Addgene | Cat# 51509 |
| AAV-CAG-FLEX-oG-WPRE-SV40pA | Addgene | Cat#74292 |
| Lenti-HiRet-GFP | This paper | Cat#N/A |
| Lenti-HiRet-mCherry | This paper | Cat#N/A |
| Lenti-HiRet-Cre | This paper | Cat#N/A |
| Lenti-HiRet-FLEX-DTR | This paper | Cat#N/A |
| Rabies-ΔG-mCherry | Kim et al., 2016 | Cat#N/A |
| Rabies-ΔG-GFP | Kim et al., 2016 | Cat#N/A |
| Sequence-Based Reagents | ||
| N/A | N/A | N/A |
| Software and Algorithms | ||
| Matlab 2016b | Mathworks | https://www.mathworks.com/ |
| pClamp 10 | Molecular Devices | https://www.moleculardevices.com/systems/conventional-patch-clamp/pclamp-10-software |
| ImageJ2 | NIH | https://imagej.nih.gov/ij/index.html |
| ImageJ Stabilizer | N/A | http://www.cs.cmu.edu/~kangli/code/Image_Stabilizer.html |
| Imaris 8.0 | Bitplane | http://www.bitplane.com/imaris/imaris |
| Matlab CellSort toolbox | Matlab central | https://www.mathworks.com/matlabcentral/fileexchange/25405-emukamel-cellsort |
| Matlab fastICA toolbox | Matlab central | https://www.mathworks.com/matlabcentral/linkexchange/links/2115-the-fastica-package-for-matlab |
| Inscopix nVista 2.0.32 | Inscopix | https://www.inscopix.com/ |
| Mosaic | Inscopix | https://www.inscopix.com/ |
| Other | ||
| N/A | N/A | N/A |
CONTACT FOR REAGENT AND RESOURCE SHARING
Further information and requests for reagent will be addressed by the lead author Zhigang He (Zhigang.He@childrens.harvard.edu).
EXPERIMENTAL MODEL AND SUBJECT DETAILS
Mice Strains
All experimental procedures were performed in compliance with animal protocols approved by the Institutional Animal Care and Use Committee at Boston Children’s Hospital or National Institutes of Health. C57Bl/6 wild type mouse (Charles River, Strain code#027), Lox-Stop-Lox-ChR2-YFP (Jax#12569), Emx1-Cre (Jax#5628), Thy1-chR2-YFP (Jax#7612), ChAT-Cre (Jax#028861) mouse strains were maintained on C57Bl/6 genetic background. For behavioral measurement, experimental animals (C57Bl/6 wild type mouse) used were from different littermates. The body weight and sexes were randomized and assigned to different treatment groups, and no other specific randomization was used for the animal studies. Behavioral tests were videotaped and examined blindly.
Chemicals and Antibodies
For diphtheria toxin mediated cell ablation and inhibitory DREADD-based cell activity inhibition, we purchased the diphtheria toxin and Clozapine N-oxide from Sigma (D0564) and Enzo Life Sciences (BML-NS105-0025), respectively. For immunostaining, the primary antibody used are chicken anti-GFP [Abcam (Cat: ab13970), 1:1000], rabbit anti-RFP [Abcam (Cat: ab34771, 1:1000), mouse anti-NeuN [Millipore (MAB377), 1:1000], rabbit anti-PKCγ [Santa Cruz (sc211),1:100], anti-cholinergic acetyltransferase (ChAT) [Millipore (AB144P), 1:100].
METHOD DETAILS
Virus production and injection
AAV2/8-GFP, AAV2/8-FLEX-GFP, AAV2/8-FLEX-tdTomato, AAV2/8-FLEX-DTR, AAV2/8-FLEX-PLAP, AAV2/9-FLEX-syn-GCaMP6s, and AAV2/9-tdTomato-p2A-SypGFP, AAV 2/8-FLEX-tdTomato-p2A-SypGFP, AAV2/6-Flex-oG (all AAV titers were adjusted to 0.5–5×10¹³ copies/ml for injection) were produced and injected to the mouse cortex as described previously.
The attenuated rabies viruses (Rabies-ΔG-GFP & Rabies-ΔG-mCherry and AAV2/6-Flex-oG were co-injected into forelimb and neck/trunk muscles according to Greene 1935 at postnatal day 3 as described previously (Tripodi et al., 2011). Mice were euthanized 7 days post injection for histological analysis. Vectors of HiRet-GFP, HiRet-mCherry, HiRet-Cre, and HiRet-FLEX-DTR (all lenti-virus titers were adjusted to 1.6–2×10¹² copies/ml for injection) were constructed based on the HiRet-lenti backbone (Kinoshita et al., 2012). To retrogradely target supraspinal neurons, HiRet-lenti viruses were produced and injected to the spinal cord of mice as described before (Arlotta et al., Neuron 45, 207, 2005). Briefly, injection of HiRet-lenti-GFP/mCherry or Cre viruses to C3–C7 spinal cord of mice were guided by ultrasound and carried out at postnatal day 4 (P4). To determine the retrograde labeling efficiency of the lenti-viruses, Green retrobeads (Lumafluor, 3 μl) was injected into C3–C7 spinal cord of mice at P28. Mice were sacrificed 2 weeks following injections by cardiac perfusion with PBS and subsequently 4% paraformaldehyde.
Immunohistochemistry and Imaging
Mice were perfused transcardially with 4% paraformaldehyde (PFA) in phosphate-buffered saline (PBS) followed by 4% PFA in PBS postfixation for 24 hours. The tissue was cryo-protected with 30% sucrose and processed using cryostat (section thickness 30 μm for spinal cord and 60 μm for brain). Sections were intensively washed with PBS and then treated with a blocking solution containing 10% normal goat serum, 0.5 % Triton-100 for 2 hours at room temperature before staining. Floating brain tissue sections (60 μm) were incubated with primary antibodies overnight at 4°C and washed three times for 10 min with PBS before incubation with secondary antibodies (1:400 dilution) for 2 hours. Secondary antibodies, including Alexa Fluor 488-conjugated goat anti chicken, Alexa Fluor 594-conjugated goat anti rabbit, and Alexa Fluor 405-conjugated goat anti mouse were purchased from Invitrogen. After being thoroughly washed with PBS, sections were mounted with ProLong anti-fade mounting medium with or without DAPI for imaging and analysis. Sections were imaged with a confocal laser-scanning microscope (Zeiss 700), a Perkin Elmer UltraVIEW VoX spinning disc confocal microscope, or Nikon Ti Eclipse Inverted Microscope. For Figures 1G–L (10×, Ti), Figure 4B (20×, Spin disc), Figure 6 (20×, Spin disc), pictures were taken by the Ti or VoX spinning disc microscope with automatic image stitching software NIS-Elements (Ti) or Volocity (for Spin disk, PerkinElmer).
For Figures S1C–F (40×, Spin disc), Figures S2A (10×, LSM 700), S4B (20× Spin disc), S5C (10×, LSM 700), S6B (20× Spin disc), S6C (10×, LSM 700) and S7B (10×, LSM 700), pictures were taken by Spin disc or LSM 700 and stitched automatically by Volocity (for Spin disk, PerkinElmer) or ImageJ (for LSM, NIH). For Figures S1B, S4C, S4D, series images were taken by Ti (10×) and aligned, stacked by Imaris (Bitplane).
Quantification of Retrogradely Targeted CSN Number in the Cortex and Their Axon Projection Number at the Pyramid
To assess whether cells labeled by neonatal intraspinal injection remain as corticospinal neurons in the adult, HiRet-Cre was injected into the cervical spinal cord (C3–C7) at postnatal day 4 (P4) and AAV-FLEX-GFP or tdTomato were injected into the motor (RFA or CFA) or visual cortex at adult age (P56–P63). By doing this, we visualized and quantified cell bodies in the cortex and their spinal axon projections at the pyramid. The total number in one animal was obtained from quantifying the numbers of GFP+ or RFP+ neurons in all brain sections imaged by a 40× objective lens. To quantify the total axon number in the pyramid, we used a standard method described by Liu et al., 2010 with slight modification. Briefly, the area of labeled pyramid was first measured by a whole pyramid image with 40× objective magnification. Then, at 100× objective magnification, the axon numbers in 12 squares throughout the pyramid in a single section were counted and averaged to get the average axon number density. The total number of axon in the whole pyramid was extrapolated by multiplying the average axon number density with the area of labeled pyramid. The axon number was averaged from 4 sections of every 4th in a series. 5 animals were quantified.
Specific Ablation of Total, RFA, or CFA Corticospinal Neurons
To ablate total CSNs, 2 μl HiRet-FLEX-DTR or HiRet-GFP (control) virus (2×10¹² copies/ml) were injected to C3–C7 spinal cord of Emx1-Cre mice at the age of P4. For regional CSNs ablation, 2 μl HiRet-Cre virus (2×10¹² copies/ml) was injected to C3–C7 spinal cord of mice at the age of P4. 4 days later, 1 μl AAV2/8-FLEX-DTR viruses (5×10¹² copies/ml) or AAV2/8-FLEX-PLAP viruses (5×10¹² copies/ml) as control were injected to RFA or CFA of the mouse brains bilaterally guided by ultrasound. To verify injection position and track spreading areas, all mice are co-injected with AAV2/8-GFP (5×10¹² copies/ml) in the experimental and control groups. To ablate specific CSNs, diphtheria toxin (DT) was administered (i.p., Sigma, D0564, 50 μg/kg) in adult animals (4–6 week) either prior (for learning study) or after single pellet retrieval training.
For total CSNs ablation, the ablation efficiency was verified by the absence of PKCγ staining in the dorsal funiculus of the spinal cord. To verify the efficiency and specificity of RFA or CFA CSNs ablation, 2 μl HiRet-Cre virus (2×10¹² copies/ml) were injected to C3–C7 spinal cord of mice at the age of P4. After 4 days, 1 μl viral solution containing AAV2/8-FLEX-DTR (5×10¹² copies/ml) AAV2/8-GFP (viral expression label, 5×10¹² copies/ml) injected to RFA or CFA, respectively. AAV2/8-FLEX-RFP (CSNs label, 5×10¹² copies/ml) virus was injected to both RFA and CFA to visualize CSNs neurons. Six weeks later, 6 mice were sacrificed to examine the RFP expression in the GFP+ CFA or RFA (3 mice for each zone). Meanwhile, 8 mice were intraperitoneally administrated with DT. 2 weeks after DT administration, mice were sacrificed and we verified the ablation of the FLEX-RFP+ CSNs in the GFP+ (with FLEX-DTR) and GFP− (without FLEX-DTR) areas (4 mice for each RFA or CFA ablation group).
In addition, we performed a separate experiment in which HiRet-FLEX-DTR or HiRet-GFP (control) was injected to multiple sites of cervical spinal cord at the age of P28 in Emx1-Cre mice, when CST axon pruning is completed. We discovered that CSN ablation efficiency varied in individual mice, underlying the difficulty in achieving reproducible CSN ablation at the mature ages. However, consistent with the results from P4 CSN ablation, the successful rate of single pellet food retrieval significantly dropped in HiRet-FLEX-DTR group, when compared with that in the control group (p = 0.043, Student’s t test, n=8, 8 for each group). Importantly, the extents of CSN ablation in each animal correlated well with its behavioral performance [the co-efficient of determination (R2) between ablation efficiency and the change of success rate pre- and post-DT administration is 0.76], further supporting the notion that CSNs in non-visual cortical areas are required for this skilled forelimb task.
Calcium Imaging in Behaving Mice
Animals used for calcium imaging experiments were first labeled with HiRet-lenti-Cre lentivirus in spinal cord at P4 and trained in the pellet-retrieval task during P42–56 as described above. AAV2/9-FLEX-syn-GCaMP6s (titer 5×10¹³ copies/ml) was then injected into the cortex contralateral to the preferred side of forelimb usage, and a cranial window was installed over the injected area following previously published procedures (Cao et al., 2015; Mastwal et al., 2014). During these procedures, mice were anesthetized with Avertin (1.5% solution given at 0.01 ml/g, i.p.) and treated with dexamethasone (0.2 mg/kg, s.c.) and carprofen (5 mg/kg, s.c.) to prevent brain swelling and inflammation. A piece of skull (3.5 mm in diameter) over the contralateral cortex was removed after high-speed dental drilling. AAV2/9-FLEX-syn-GCaMP6s (0.5 μl per animal) was injected into a series of cortical sites throughout forelimb motor cortex in different animals using a micro-syringe pump. A 3-mm coverslip was used to seal the cranial window and the exposed scalp was sutured. After 7–14 days, the baseplate of a miniaturized integrated fluorescent microscope (Inscopix) (Ziv et al., 2013) was fixed on top of the coverslip. Animals were then habituated to the attachment of the microscope and retrained for the pellet-retrieval task for 2 days. A major advantage of the miniaturized microscopy is that it can be conducted in freely behaving mice without head fixation. Mice carrying the miniaturized microscope are capable of performing the pellet-retrieval task (success rate: 31±0.03%; total trial number: 12±1).
Calcium imaging was performed in freely moving mice using the head-attached microscope (Inscopix; LED power: 0.6 – 1.0 mW; camera resolution: 1440 ×1080 pixels). Images were acquired at 50 Hz using nVista HD software (Inscopix). At the beginning of each imaging session, the protective cap of the previously implanted baseplate was removed and the microscope was attached. The imaging field of view was approximately 650 × 520 μm2 at 0.65 m/pixel resolution and the imaging depth was selected by adjusting the focus of the microscope until clear dendritic trunk signals were observed, which appeared as bright spots in the images. The focal plane was 150–250 μm below the lens. Out-of-focus light from laterally extending dendritic tufts could be detected as dim signals branching out from the bright trunks. Mouse behavior was recorded with a video camera (Canon), which was synchronized with calcium imaging using the trigger-out signal from nVista HD.
Calcium imaging videos were analyzed by using Mosaic software (Inscopix) and custom-written scripts in Matlab following published algorithms(Hyvarinen and Oja, 2000; Mukamel et al., 2009). Raw videos were first down-sampled by two-fold along spatial dimensions to reduce file size and noise. The mean fluorescence intensity of each pixel during a recording session (~ 2 min) was calculated as F0 and changes in pixel intensity at time t were expressed as (Ft − F0)/F0 or ΔF/F0. To extract active dendritic signals, principal component and independent component analysis (PCA-ICA) was applied to the spatial-temporal data matrices of ΔF/F0 using CellSort and fastICA toolboxes (These toolboxes are freely downloadable from Matlab central)(Hyvarinen and Oja, 2000; Mukamel et al., 2009). This analysis decomposes a spatiotemporal data matrix into independent components based on the skewness of data distribution. Each component has a characteristic spatial filter over the imaged area and a corresponding temporal signal during the imaging period. The spatial filter and the temporal signal of each component were graphically displayed and inspected by human observers who were blind to the experimental conditions of each video. If the spatial filter for a component overlapped with the dark shadows casted by blood vessels in the F0 image, this component was likely contributed by blood flow and was therefore rejected. In addition, since calcium signals show characteristic fast-rising and slow-decaying time course (Chen et al., 2013), the temporal skewness of calcium signals is expected to be positive and those components with skewness less than 1 were rejected (Mukamel et al., 2009). For each selected component, the location of the dendritic trunk was identified as the brightest spot (3 × 3 pixel) of the spatial filter. The corresponding temporal signal of the dendritic trunk was calculated from the ΔF/F0 video by subtracting the median value of the background area (outside the dendritic tree) from the average value of the dendritic trunk area.
Under antidromic spinal cord electrical stimulation, the dendritic trunk and tuft signals of CSNs were both strongly activated and phase-locked to the stimuli (Figure S4B). We interpret this correlation as reflecting back-propagating action potentials, based on previous studies that used simultaneous in vivo two-photon imaging and intracellular recording from individual layer 5 pyramidal neurons of motor cortex (Hill et al., 2013). In contrast, the correlation between tuft and trunk activity was weaker in freely behaving animals (Figure S2C), consistent with the notion that trunks integrate inputs from multiple tufts (Hill et al., 2013). To directly examine the relationship between trunk and soma activity of CSNs, we embedded a microprism lens (Andermann et al., 2013; Murayama et al., 2007) in motor cortex to reach the soma and imaged it together with the trunk from the side (Figure S2D). This method showed that the calcium activity in dendritic trunks tightly correlated with that in the soma in freely behaving mice, similar to what has been reported before by two-photon microscopy (Hill et al., 2013). We did not use this microprism lens routinely, because its insertion damaged the motor cortex. Instead, we used the less invasive epidural positioning of the lens to record CSN activity from their apical trunks.
To identify periods of increased neuronal activity, we searched for the rising phase of each calcium event (peak ΔF/F0 > 3 standard deviation of baseline fluctuation), which has been shown closely associated with neuronal spiking activities(Chen et al., 2013; Yang et al., 2014). The start of this rising phase is detected when the 1st derivative of ΔF/F0 (calculated in 200 ms moving window) rises above 0 and continues to increase above 5 standard deviation of baseline fluctuation, and the end of this rising phase is detected when the 1st derivative of ΔF/F0 falls below 0. Task-related CSNs were determined by comparing calcium events in video frames when animals were performing the task to that outside the performance window. Neurons with significant task-dependent increase (P<0.05, ranksum test) of calcium activity were detected (n = 483 out of 987 cells from 38 imaged areas of 28 mice). To visualize the activity patterns of detected dendrites during the pellet-retrieval task, the active event traces of each CSN were aligned by the time when the forepaw was maximally extended prior to grasping, and averaged across trials. The resulting traces from all the CSNs were sorted based on their peak activation time during the task and displayed in temporal raster plots.
Previous studies have reported that movement-related neural activity in motor cortex precedes the actual movement by up to 200 ms (Kalaska, 2009). We therefore used 200 ms windows to quantify task phase-related activation of cells. We calculated the average CSN activity in each of the three task phases using a 200ms window up to reaching onset (pre-reaching), up to grasping (pre-grasping), and after grasping (post-grasping). The phase in which maximum activation occurred was color-coded for each cell (green, pre-reaching; red, pre-grasping; blue, post-grasping; white, non-task-related). Using this color code, we mapped the preferences of all the detected CSNs onto a common spatial reference frame and indicated the imaged areas with gray rectangles.
Light-based Motor Mapping
The HiRet-Cre virus (2×10¹² copies/ml) was intraspinally injected into Lox-Stop-Lox-ChR2-YFP mice to retrogradely label corticospinal neurons. After 6–8 weeks, the animals were subjected to optical stimulation experiments. Isoflurane anesthesia (1~3%) was used during craniotomy surgery, and was replaced by ketamine-xylazine (100 mg/kg ketamine, 10 mg/kg xylazine) in order to restore muscle tone prior to motor mapping. By monitoring animal’s breathing rate (~100/min), the animals were maintained in a constant level of anesthesia during the mapping process. Supplemental doses of ketamine/xylazine at 1/10 of the initial dose were administrated every 30 min or when the breathing rate dramatically increased.
A digital stereotaxic frame was used to fix the animal and direct a multimode fiber optic cable (numerical aperture 0.22, diameter 105 μm; Thorlabs, NJ) coupled with a 473 nm laser (2–4 mW at fiber tip, 5 ms pulse, 100 Hz; Crystalaser) to an array of cortical sites (with 300 or 600 μm spacing between sites) in a broad cortical area (0.6–3 mm lateral from mid-line, 2 mm anterior and posterior of bregma). The diameter of individual activation area at the depth of cortical layer V (~500 μm underneath cortical surface) was estimated to be 265 μm. The exposed brain was covered with 2% agarose dissolved in PBS before the mapping process. Before stimulation, the forelimbs were suspended above the ground, hanging freely. Laser stimulations (500-ms train, 6 trains with 2-s interval between train) were delivered to the cortical sites in a random order to obtain a mean value for each site in the map. A mirror was placed on the side of the animals with a 45-degree to obtain the side view. A high-speed camera (up to 500 fps) was positioned in the front to record movements on the front view. Movement amplitude was defined as joint angle changes compared to resting posture. Digital videos were examined by an assessor blinded to the stimulation sites.
Short laser stimulations (15-ms pulse, 6 repetitions with 2-s interval) were delivered over the defined areas of RFA, intermediate, anterior-medial CFA and posterior-lateral CFA while recording EMG. To perform EMG recording, an incision was first made on forelimb to expose the muscles while fascia remained intact. Nichrome wires (762000, A–M Systems, WA) were deinsulated at the tip for 1 mm, and customized for a small hook that secures its position within the muscle. A pair of electrodes were then inserted into the motor endplate area of each muscle using a 25G needle. EMG signals were acquired using differential AC amplifier (1700, A–M Systems, WA) with 10–1000 Hz filtration, sampled at 5 kHz using a digitizer (Digidata 1440A, Axon Instruments), and analyzed by pClamp Software. EMG traces were rectified and averaged among traces, then the area under curve (AUC) in a window of 50~100 ms from stimulation onset was calculated to define EMG response. To compare EMG response between muscles and animals, AUCs for individual muscles were normalized to the maximum response among all stimulation sites.
Analysis of Forelimb CSNs Projection Patterns in the Cervical Spinal Cord
To detect the synaptic contact of the corticospinal axons descending from cortex in the spinal cord, 100 nl AAV2/9-tdTomato-p2a-SypGFP (1×10¹³ copies/ml) was injected to a series of cortical sites throughout RFA and CFA in right sensorimotor cortex at the age of P56–P70 in different animals. Briefly, mice were anesthetized using an isoflurane-oxygen mixture and placed in a custom stereotactic apparatus. A small hole (approximately 0.5–1 mm in diameter) was drilled into the skull, allowing insertion of a pulled glass pipette (internal tip diameter approximately 50 μm). Injections (50 nl each) were carried out at two depths, 500 μm and 600 μm from the pial surface. The pipette was allowed to remain in the brain for 2 min before being retracted slowly to prevent backflow of the virus along the shaft. 14 days after AAV virus injection, the animals were sacrificed for histological analysis. Mosaic images of the sections of cervical spinal cord (Zeiss Axioimager microscope, 10× magnification) were obtained to identify axon projection pattern. Whole brain images of the dissected mice brains were taken by a Nikon dissecting microscope to verify tdTomato-p2A-SypGFP expression and the location of labeled area. The images were then analyzed by custom-written scripts in Matlab blindly by a separate analyzer. The boundaries of spinal cord lamina were generated by superimposing the spinal cord images with spinal cord atlas. The number of GFP+ boutons in different spinal cord segments and laminae were counted for individual injection sites. At least three sections in the same spinal cord segment with the corticospinal axons per animal were examined.
Premotor neuron distribution analysis and correlation with CST axon termination in the cervical spinal cord
To trace the premotor neuron of different muscles in the spinal cord, forelimb muscles of P3 ChAT-Cre mice were co-injected with rabies (ΔG) and AAV-FLEX-oG viruses. The injected muscles include BB: biceps brachii, elbow flexor; T: triceps, elbow extensor; CU: carpi ulnaris, wrist flexor; CR: carpi radialis, wrist extensor, SD: spinodeitoideus, shoulder extensor. The muscles in the neck (biventer cervicis and sternomastoid) also received viral injection. However, because of viral diffusion, these muscles were analyzed as neck muscles, without extensor/flexor differentiation. The mice were terminated 7 days after injection for histological analysis. To reconstruct the position of virally labeled neurons in a three-dimensional Cartesian space, which allows the comparison of multiple specimens, the transverse sections of cervical spinal cord from single animals were aligned using the Imaris software with manual corrections, by defining a set of Cartesian axes interactively over all frames of a z-series with the zero centered on the central canal, the y axis parallel to the midline of the spinal cord and the x axis orthogonal to it. The position of virally labeled premotor neurons is transformed (translation and rotation) to a common coordinate system. For linear density distributions, integral of curve always equals 1. Two-dimensional kernel density estimations were graphically displayed as contour plots, with the contour lines connecting points of equal densities and drawn for density values between 40% and 100% of the estimated density range, in steps of 10% (Matlab). To calculate the overlapping rate between the CST termination pattern and premotor neurons of flexor/extensor of multiple muscles, images from rabies labeled premotor neurons and CST presynaptic boutons were transformed into the same coordinates. The percentage of CST termination core regions (60%) that overlaps with premotor neuron core regions (60%) was then calculated (Matlab).
Quantification of Collaterals of CSNs in Subcortical Regions and Spinal Cord
To trace the projection of CSNs in RFA and CFA, HiRet-Cre vectors were injected into the entire cervical spinal cord (C3–C7) at P4. At adult (P56–P63), AAV-FLEX-tdTomato-p2A-SypGFP was injected to motor cortex (RFA or CFA). In 2 weeks, the mice were terminated for anatomical analysis. The brains and spinal cords were cut into 40 μm thick sections (about 350 sections per animal). The sections were stained with anti-RFP and GFP antibody and then imaged by a fluorescence microscope (10× objective lens) under the same condition. The GFP positive boutons in each subcortical areas of individual animal in all sections were detected by the spot detection function of Imaris software and added up. The number of total positive boutons in each subcortical region was normalized by the number of total labeled mature corticospinal neurons. The boundaries of each subcortical area were drawn by superimposing those images on Allen mouse brain atlas, Mouse, P56, coronal. 4 and 5 mice with CSNs labeling from RFA or CFA were quantified respectively.
DREADD-mediated Axon Branch-selective Presynaptic Silencing
Lox-Stop-Lox-ChR2-YFP mice were injected with HiRet-Cre at cervical spinal cord at neonatal age (P4) and AAV-FLEX-hM4Di at bilateral motor cortex at P21. After 6 weeks, animals were subjected to anesthesia and craniotomy as described in light-based motor mapping experiments. In addition, cervical spinal cord was also exposed for subsequent drug administration. Long train opto-stimulation (5-ms pulse, 100 Hz, 500 ms) was delivered to an array of cortical sites, and the forelimb movements were captured by high speed camera to represent baseline. CNO (0.1 μg/μl, 0.5 μl each site) or saline was then infused into C3 or C7 level of spinal cord (bilateral, 0.5 mm lateral to midline, 0.5 mm depth, the distance between two sides: 2.5 mm). Within 15 to 60 min after infusion, forelimb movements induced by opto-stimulation in the same sites were recorded. Animals received drug infusion at one level were allowed to fully recover and drug washout for at least 24 hours prior to being tested at another spinal cord level. Individual joint movements were quantified by calculating joint angle changes or displacement elicited by optogenetic stimulation in order to compare between baseline and post-silencing conditions.
Behavioral experiments
Grip Strength Analysis
Mice forelimb grip strength was measured using a grip strength meter (TSE Systems) according to manufacturer’s instructions. Each mouse was tested on 4–5 consecutive trials to obtain the average force (g).
Single-pellet Reaching Task
The single-pellet reaching task was carried out following previously established procedures with slight modification (Xu et al., 2009). The training chamber modified from previous literature(Xu et al., 2009) was built from clear Plexiglas (1 mm thickness, dimensions 20 cm × 15 cm × 8.5 cm). Three vertical slits (0.5 cm wide; 13 cm high) were located on the front wall of the box: in the center, on the left side, and on the right side. An exterior shelf with 1.5 cm height was affixed to the wall in front of the slits to hold a sugar pellet (dustless precision pellet, 20 mg, bioserv). Food pellets were placed 1 cm away from the front wall and 0.4 cm away from the center of the slit to encourage mice to use their preferential paw for reaching. After one day of habituation to the chamber (d1) with sugar pellet inside the chamber, mice were food-restricted for one night before training (starting at d2) and were maintained above 90% of free feeding weight throughout the training session. A mirror was placed on the side of the chamber with a 45-degree angle to obtain the side view and individual pellets were placed as described above. Mice were digitally videotaped at 60 frames/sec while reaching for a maximum of 40 pellets within 20 min. The success rate was calculated as: number of successful retrievals/total attempts per trail *100. To further analyze specific defects of multiple joint movements during the skilled reaching, we scored the ten components of the reach based on Eshkol-Wachmann Movement Notation (EWMN) (for description of the 10 steps, see contents in the text and Supplementary Table 1)(Farr and Whishaw, 2002). Each movement was rated on a 3-point scale: 0 for normal movement, 1 for incomplete or moderate impairment of the movement, 2 for absence or severe impairment of the movement. Digital videos were examined by an assessor blinded to the treatment groups. The animals without intention to retrieve the sugar pellet or consistently using the tongue instead of the forelimb to retrieve the sugar pellet were excluded from further analysis.
Kinematic Quantification of Mouse Reaching
To measure the reaching movement trajectories, the most distal tip of the paw was tracked using ImageJ frame (60 frames/second) by frame from the moment the paw lifted from the ground until it touched the pellet or closed for grasping in a real-time manner. All reaching attempts (n = 8 – 10) in a trial were included for each animal (n = 3, 3, 3, 4 for control, total, RFA and CFA CSNs ablated animals, respectively) used for analysis. The pellet position was defined as (0, 0, 0), and the x-axis was defined as the reaching direction. Finally, the trajectories were drawn using MATLAB blindly by a technician.
Vermicelli Test
The vermicelli handling test was described elsewhere (Xu et al., 2009). Briefly, mice were food-restricted to maintain 90% of free feeding weight and habituated with vermicelli pieces (2.6 cm) for 3 – 4 days. At the test day, mice were videotaped (60 frames/second) while handling pasta with a camera positioned to optimize the view of paw movements. The consumption duration, times of forepaw adjustment, and atypical handling were quantified by analyzing the video in control, total, RFA and CFA CSNs ablated animals, and the treatment groups were kept blind to the analyzer.
QUANTIFICATION AND STATISTICAL ANALYSIS
The normality and variance similarity were measured by STATA (version 12, College station, TX, USA) before we applied any parametric tests. Error bars in all figures represent mean ± SEM, the number (n) of samples employed is indicated in legends. Student’s t test, One-way ANOVA with Bonferroni correction for multiple comparisons (all were shown in figure legends) were performed to determine the significance difference (p < 0.05) between different groups. The mice with different litters, body weights and sexes were randomized and assigned to different treatment groups, and no other specific randomization was used for the animal studies. For the food reaching test, the animals without intention to retrieve the sugar pellet or consistently using the tongue instead of the forelimb to retrieve the sugar pellet were excluded from further analysis.
Supplementary Material
(A) Experimental paradigm. HiRet-Cre vectors were injected into the cervical spinal cord (C3–C7) at P4. At adult (P56–P63), AAV-FLEX-GFP or AAV-FLEX-tdTomato was injected to motor cortex (RFA or CFA) or visual cortex, respectively. In 2 weeks, mice were terminated for anatomical analysis.
(B) A 3D image stack of whole brain sections (60 μm thick sections, about 115 sections) from a mouse with CSNs and their axons labeled with anti-GFP or RFP from motor cortex or visual cortex respectively. Please note that while GFP+ axons project from cortex to pyramid, RFP+ axons were only visible in the cortex and the midbrain regions, but not at the pyramid. Scale bar: 1 mm.
(C, D) Representative images of single cortical sections showing labeled neurons in the motor cortex (C) or visual cortex (D). For quantification in G, all labeled neurons in all cortical sections were counted in individual mice. Scale bar: 100 μm.
(E, E′, F) Representative images of a coronal pyramidal section showing the cortical axons labeled with anti-GFP (E) or RFP (F). Total numbers of GFP or RFP labeled axons were quantified at 100× magnification as shown in (E′). The circles in image (E′) indicate individual axons being counted. Scale bars: 50 μm; for E and F, 5 μm for E′.
(G) Percentages of axon number over total labeled cortical neuron number in motor (RFA or CFA) and visual cortex. 5 animals were quantified, ** p < 0.001, n = 5, Student’s t test.
(A) Confocal fluorescence images of coronal brain sections showing specifically labeled CSNs. HiRet-Cre viral vectors were injected into spinal cord and AAV9-FLEX-syn-GCaMP6s was injected into motor cortex. Left, 10× images showing labeled neurons and dendrites in the AAV-injected area; Right, 25× images showing magnified views of apical dendritic trunks in the AAV injected areas (dotted lines indicate the expected focal plane of head-mounted microscope). Scale bar: 100 μm.
(B) Left: Diagram showing the procedure to image the dendritic activity of CSNs in a deeply anesthetized state with antidromic spinal cord stimulation. Right: Example showing dendritic trunk and tuft signals are strongly correlated and phase-locked to the electrical stimuli during antidromic spinal cord stimulation. The upper image shows a dendrite identified by ICA analysis. The red circle indicates the dendritic trunk and the blue, green and magenta circles indicate apical tufts. The lower traces show the corresponding temporal signals of the dendritic trunk and apical tufts. AES: Antidromic Electrical Stimulation. Scale bar: 50 μm.
(C) Example showing dendritic trunk and apical tuft signals are less correlated during the freely moving state (Left and Middle). Right, Activity correlation between dendritic trunk and apical tuft is higher during antidromic stimulation compare to that in a freely moving state (P = 0.01, n = 10, 20 dendrites for antidromic stimulation and freely moving state, respectively). Scale bar: 50 μm.
(D) Diagram showing the procedure to image CSN activities by microprism lens in a freely moving state. The upper image shows a neuron identified by ICA analysis. The red circle shows the soma and the blue, green and magenta circles indicate dendritic trunk. The lower traces show that dendritic trunk signals are synchronized with the soma signal in freely moving state. Scale bar: 100 μm.
(E) Example images showing the mixed distribution of CSNs with different phase preferences in a local cortical area. Green for pre-reaching, red for pre-grasping, blue for post-grasping, and white for non-task-related. The left image showing more pre-grasping activity is re-plotted from Fig 2F for comparison with the other images in this panel that show more pre-reaching and post-grasping related activities.
(A, B, C) Overground stepping performance. Weight support (A) and excursion length (B) of forelimb (FL) and hindlimb (HL) and intralimb coordination (C) in control (Emx1Cre GFP, n=6) and CSN-ablated mice (Emx1Cre DTR, n = 7).
(D) Forelimb grip strength analysis of control Emx1Cre GFP or Emx1Cre DTR mice with pre (−DT) and post (+DT) administration.
(E) Performance on vermicelli handling test of control (Emx1Cre GFP) and CSN-ablated mice (Emx1Cre DTR). ** p < 0.01, when compared to the control. n = 6, 7 for control and CSNs-ablated animals respectively.
(F, G) Three-dimensional (x, y, z) paw closure positions relative to the pellet from representative control (F) and Emx1Cre DTR (G) mice pre- and post DT administration. The paw in cartoon shows the reaching direction. The ball represents the pellet, the center of which represents the coordinates (0,0,0).
(H, I) Mean (H) and standard deviation (I) of the distance (mm) between the paw closure position and the pellet center in control and corticospinal neuron ablated animals. ** in H, I, p < 0.01. Student’s t test. n = 3 for each group.
(J) Three-dimensional reaching trajectories from representative control, CFA and RFA-CSNs-DTR mice pre and post DT administration. The brown circles represent the position of pellets.
(K) Three-dimensional (x, y, z) paw closure positions relative to the pellet from representative control, CFA and RFA-CSNs-DTR pre and post DT administration. The paw in cartoon shows the reaching direction. The circle represents the pellet, the center of which represents the coordinates (0,0,0).
(L) The Hausdorff distance between multiple trajectories were calculated pre (−DT) or post (+DT) administration in control, CFA and RFA-CSNs-DTR mice.
(M–N) Mean (M) and standard deviation (N) of the distance (mm) between the paw closure position and the pellet in control, CFA and RFA-CSNs-DTR mice. ** and * in M–N, p < 0.01 and p < 0.05 when compared to that prior to DT treatment, respectively. Student’s t test. n= 3, 4, 3 for control, CFA and RFA corticospinal neuron ablated animals respectively.
(A) Experimental paradigm for (B) and Figure 6. Mice were injected with AAV-tdTomato-p2A-SypGFP into multiple cortical sites in different animals at 6–8 weeks old. In 2 weeks, those mice were sacrificed for histological analysis. As a result, all transduced cortical neurons including CSNs were labeled, but only CST axons from CSNs could be seen in the spinal cord.
(B) Representative images showing axons and synaptic terminals [merged from magenta (RFP) and green (SypGFP)] in the spinal cord. Scale bars: 100 (left) and 20 μm (middle), respectively.
(C–G) The subcortical collaterals and spinal projections of selectively labeled CSNs. To trace the projection of CSNs in RFA, HiRet-Cre vectors were injected into entire cervical spinal cord (C3–C7) at P4. At adult (P56–P63), AAV-FLEX-tdTomato-p2A-SypGFP was injected to RFA. (C, D) A 3D image stack of whole brain (C) and cervical C2–C5 spinal cord (D) sections (40 μm thick sections, about 350 sections) from a mouse with CSNs at RFA and their axons labeled with anti-RFP. The spinal cord (D) was separated from the brain (C) and rotated so that CST collaterals could be clearly visualized in both subcortical regions and spinal cord. The white line delineated the main CST track. The regions of Striatum, Zona incerta (ZI), anterior pretectal nuclei (APT), Pontine nuclei (Pn), Reticular formation (GiV), Cuneate nucleus (CU) were marked in the image. Paxinos nomenclature was used for the description. Scale bar: 1 mm. (E) A 3D mouse brain image of GFP+ axonal projections from a cortical site, taken from Allen mouse brain connectivity atlas (Experiment ID: 180719293). The red line delineated the main CST track. (F) Representative images show GFP+ boutons in striatum, anterior pretectal nuclei (APT), pontine reticular nucleus (Pn), reticular formation (GiV), cuneate nucleus (CU), and spinal cord. Scale bar: 100 μm.
(G) Percentage of average GFP+ boutons per labeled CSN in the subcortical regions of striatum, thalamus (TH), subthalamic nucleus (STN), anterior pretectal nuclei (APT), zona incerta (ZI), red nucleus (RN), superior colliculus (SC), pontine reticular nucleus (Pn), reticular formation (GiV), spinal trigeminal nucleus (SP5), medullary reticular formation ventral part (MdV), cuneate nucleus (CU), and spinal cord. The GFP positive boutons in each subcortical areas of individual animal in all sections were detected by the spot detection function of Imaris software and added up. The total positive boutons in each subcortical region was normalized by the number of total labeled mature corticospinal neurons. The boundaries of each subcortical area were drawn by superimposing those images on Allen mouse brain atlas, Mouse, P56, coronal. 4 and 5 mice with CSNs labeling from RFA or CFA were quantified respectively.
(A) Representative images showing cells labeled with rabies virus-mediated fluorescence (mCherry for CU and GFP for CR, left), anti-ChAT (Middle) and both (Right) in the ventral horn of C6 spinal cord transverse sections. The quantities of labeled motor neurons (ChAT+) are comparable when rabies viruses were injected into the wrist extensor (CR) or flexor (CU), respectively. Scale bar: 20 μm.
(B,C) Representative images (left panels) and density maps (right panels) of premotor neurons of shoulder extensor spinodeitoideus (B) and neck (C) muscles (mixture of extensor and flexor). Scar bars: 500 μm.
(D, E) Quantification of the overlapping between CST axon termination from different cortical zones and the premotor neuron area of shoulder extensor spinodeitoideus (D) and neck (E) muscles in the rostral cervical spinal cord (C2–C4). The overlapping index is presented as the overlapping area between the core areas of CST termination and premotor neurons divided by the entire core area of CST termination in the rostral cervical spinal cord (C2–C4). ** and *: p < 0.01 and p < 0.05, n = 3 from shoulder and neck premotor neuron traced animals, respectively. One way ANOVA, followed by post hoc Student’s t test.
(A) Schematic drawing of the experimental procedure. To selectively label CST axons in C6–7 and their cell bodies in the cortex, HiRet-Cre vectors were injected into cervical spinal cord (C6–C7) at P28 and AAV-FLEX-GFP and AAV-FLEX-tdTomato were injected to Zone 1 and Zone 4 respectively at P56–P63. In 2 weeks, the mice were terminated for anatomical analysis. Bottom left: A representative whole spinal cord image (control experiment with HiRet-GFP injection) showing the injection site at C6–C7 spinal cord. Scale bar: 1 mm.
(B) Representative images of labeled CSNs in zone 1 (RFA) and zone 4 (posterior-lateral CFA) from the same mouse. Note that many neurons are labeled in Zone 1 but few in Zone 4. Scale bar: 0.5 mm.
(C) Representative images of CST axon termination in rostral (C2–C3) and caudal (C6–C7) spinal cord from labeled CSNs at zone 1 (left panels) and zone 4 (right panels). Scale bar: 200 μm.
(D) Stimulation sites: Zone 1 and Zone 4.
(E) Rectified and averaged EMG responses induced by opto-stimulation in each zone.
(F) Normalized EMG responses of individual muscle were averaged across 3 mice. **, p < 0.01, n=3. Student’s t tests.
(A) Experimental paradigm. With spinal HiRet-Cre injection at P4, whole cortical AAV-FLEX-hM4Di injection at P21, Lox-Stop-Lox-ChR2-YFP mice were subjected to long-duration optogenetic stimulation before and after (15–60 min) infusion of CNO or saline at C3 or C7 spinal cord level.
(B) Left, FLEX-hM4Di-mCitrine expression in CSNs located in RFA and CFA, scale bar 200 μm; Right, Cartoon drawing showing three stimulation zones (RFA, anterior-medial CFA, and posterior-lateral CFA). Crosses represent the centers of the three zones (n=6). (C–F) Changes of joint movements induced by optogenetic stimulation at three cortical zones (RFA, anterior-medial CFA, and posterior-lateral CFA) when CNO or saline was infused to the C3 or C7 cervical spinal cord. **, p < 0.01, n = 6, 6 for CNO and saline injected animals at both C3 and C7. Student’s t tests.
Supplementary Movie 1, Imaging CSN activity during food pellet retrieval behavior, Related to Figure 2
Supplementary Table 1 Topographical mapping of joint movements induced by optogenetic stimulation of CSNs or layer 5 pyramidal neurons, Related to Figure 4
Highlights.
Role of region-specific corticospinal neurons (CSNs) in distinct steps of motor skills
Sequential activation of region-specific CSNs during a forelimb motor skill
Parallel and distinct spinal terminations and muscle connections of CSNs
Spatially defined groups of CSNs encode different movement modules
Acknowledgments
We thank Dr. P. Arlotta for advice on ultrasound guided injection, Dr. K. Kobayashi for providing viral systems, and Drs. D. Leopold, S. Young, M. Andermann, J. Sanes, F. Wang, S. Mastwal, R. Wang, and C. Woolf for critical reading of the manuscript. This study was supported by grants from Craig Neilsen Foundation (XW and YL), NINDS (to ZH) and NIMH intramural research program ZIA MH002897 (KHW, XL) and ZIA MH002497 (CG). IDDRC and viral cores supported by the grants NIH P30 HD018655 and P30EY012196 were used for this study.
Footnotes
Publisher's Disclaimer: This is a PDF file of an unedited manuscript that has been accepted for publication. As a service to our customers we are providing this early version of the manuscript. The manuscript will undergo copyediting, typesetting, and review of the resulting proof before it is published in its final citable form. Please note that during the production process errors may be discovered which could affect the content, and all legal disclaimers that apply to the journal pertain.
SUPPLEMENTAL INFORMATION
Supplemental information includes Extended Experimental Procedures and seven figures.
AUTHOR CONTRIBUTIONS
X.W, Y.L., X.L., Z.Z., K.H.W. and Z.H. conceived and X.W, Y.L., X.L., Z.Z., H.Y., P.W., N.A., B.Y., C.W., C.G., H.D., Y.Z., and M.C. performed the experiments. Y.Z. and K.K. participated in data analysis, X.W., Y.L., X.L., K.H.W. and Z.H. prepared the manuscript with the inputs from all authors.
References
- Andermann ML, Gilfoy NB, Goldey GJ, Sachdev RN, Wolfel M, McCormick DA, Reid RC, Levene MJ. Chronic cellular imaging of entire cortical columns in awake mice using microprisms. Neuron. 2013;80:900–913. doi: 10.1016/j.neuron.2013.07.052. [DOI] [PMC free article] [PubMed] [Google Scholar]
- Arenkiel BR, Peca J, Davison IG, Feliciano C, Deisseroth K, Augustine GJ, Ehlers MD, Feng G. In vivo light-induced activation of neural circuitry in transgenic mice expressing channelrhodopsin-2. Neuron. 2007;54:205–218. doi: 10.1016/j.neuron.2007.03.005. [DOI] [PMC free article] [PubMed] [Google Scholar]
- Ayling OG, Harrison TC, Boyd JD, Goroshkov A, Murphy TH. Automated light-based mapping of motor cortex by photoactivation of channelrhodopsin-2 transgenic mice. Nature methods. 2009;6:219–224. doi: 10.1038/nmeth.1303. [DOI] [PubMed] [Google Scholar]
- Azim E, Jiang J, Alstermark B, Jessell TM. Skilled reaching relies on a V2a propriospinal internal copy circuit. Nature. 2014;508:357–363. doi: 10.1038/nature13021. [DOI] [PMC free article] [PubMed] [Google Scholar]
- Bareyre FM, Kerschensteiner M, Misgeld T, Sanes JR. Transgenic labeling of the corticospinal tract for monitoring axonal responses to spinal cord injury. Nat Med. 2005;11:1355–1360. doi: 10.1038/nm1331. [DOI] [PubMed] [Google Scholar]
- Bizzi E, Cheung VC, d’Avella A, Saltiel P, Tresch M. Combining modules for movement. Brain Res Rev. 2008;57:125–133. doi: 10.1016/j.brainresrev.2007.08.004. [DOI] [PMC free article] [PubMed] [Google Scholar]
- Brown AR, Teskey GC. Motor cortex is functionally organized as a set of spatially distinct representations for complex movements. J Neurosci. 2014;34:13574–13585. doi: 10.1523/JNEUROSCI.2500-14.2014. [DOI] [PMC free article] [PubMed] [Google Scholar]
- Chen TW, et al. Ultrasensitive fluorescent proteins for imaging neuronal activity. Nature. 2013;499:295–300. doi: 10.1038/nature12354. [DOI] [PMC free article] [PubMed] [Google Scholar]
- Courtine G, Bloch J. Defining ecological strategies in neuroprosthetics. Neuron. 2015;86:29–33. doi: 10.1016/j.neuron.2015.02.039. [DOI] [PubMed] [Google Scholar]
- Donoghue JP, Wise SP. The motor cortex of the rat: cytoarchitecture and microstimulation mapping. J Comp Neurol. 1982;212:76–88. doi: 10.1002/cne.902120106. [DOI] [PubMed] [Google Scholar]
- Dum RP, Strick PL. Motor areas in the frontal lobe of the primate. Physiology & behavior. 2002;77:677–682. doi: 10.1016/s0031-9384(02)00929-0. [DOI] [PubMed] [Google Scholar]
- Esposito MS, Capelli P, Arber S. Brainstem nucleus MdV mediates skilled forelimb motor tasks. Nature. 2014;508:351–356. doi: 10.1038/nature13023. [DOI] [PubMed] [Google Scholar]
- Farr TD, Whishaw IQ. Quantitative and qualitative impairments in skilled reaching in the mouse (Mus musculus) after a focal motor cortex stroke. Stroke. 2002;33:1869–1875. doi: 10.1161/01.str.0000020714.48349.4e. [DOI] [PubMed] [Google Scholar]
- Graziano MS, Aflalo TN. Mapping behavioral repertoire onto the cortex. Neuron. 2007;56:239–251. doi: 10.1016/j.neuron.2007.09.013. [DOI] [PubMed] [Google Scholar]
- Graziano MS, Taylor CS, Moore T. Complex movements evoked by microstimulation of precentral cortex. Neuron. 2002;34:841–851. doi: 10.1016/s0896-6273(02)00698-0. [DOI] [PubMed] [Google Scholar]
- Harrison TC, Ayling OG, Murphy TH. Distinct cortical circuit mechanisms for complex forelimb movement and motor map topography. Neuron. 2012;74:397–409. doi: 10.1016/j.neuron.2012.02.028. [DOI] [PubMed] [Google Scholar]
- Harrison TC, Murphy TH. Motor maps and the cortical control of movement. Curr Opin Neurobiol. 2014;24:88–94. doi: 10.1016/j.conb.2013.08.018. [DOI] [PubMed] [Google Scholar]
- Hill DN, Varga Z, Jia H, Sakmann B, Konnerth A. Multibranch activity in basal and tuft dendrites during firing of layer 5 cortical neurons in vivo. Proceedings of the National Academy of Sciences of the United States of America. 2013;110:13618–13623. doi: 10.1073/pnas.1312599110. [DOI] [PMC free article] [PubMed] [Google Scholar]
- Hyvarinen A, Oja E. Independent component analysis: algorithms and applications. Neural Networks. 2000;13:411–430. doi: 10.1016/s0893-6080(00)00026-5. [DOI] [PubMed] [Google Scholar]
- Iwaniuk AN, Whishaw IQ. On the origin of skilled forelimb movements. Trends Neurosci. 2000;23:372–376. doi: 10.1016/s0166-2236(00)01618-0. [DOI] [PubMed] [Google Scholar]
- Kalaska JF. From intention to action: motor cortex and the control of reaching movements. Adv Exp Med Biol. 2009;629:139–178. doi: 10.1007/978-0-387-77064-2_8. [DOI] [PubMed] [Google Scholar]
- Kamiyama T, et al. Corticospinal tract development and spinal cord innervation differ between cervical and lumbar targets. J Neurosci. 2015;35:1181–1191. doi: 10.1523/JNEUROSCI.2842-13.2015. [DOI] [PMC free article] [PubMed] [Google Scholar]
- Kato S, et al. A lentiviral strategy for highly efficient retrograde gene transfer by pseudotyping with fusion envelope glycoprotein. Human gene therapy. 2011;22:197–206. doi: 10.1089/hum.2009.179. [DOI] [PubMed] [Google Scholar]
- Kim EJ, Jacobs MW, Ito-Cole T, Callaway EM. Improved Monosynaptic Neural Circuit Tracing Using Engineered Rabies Virus Glycoproteins. Cell Rep. 2016 doi: 10.1016/j.celrep.2016.03.067. [DOI] [PMC free article] [PubMed] [Google Scholar]
- Kinoshita M, et al. Genetic dissection of the circuit for hand dexterity in primates. Nature. 2012;487:235–238. doi: 10.1038/nature11206. [DOI] [PubMed] [Google Scholar]
- Kuypers HG. Anatomy of the descending pathways. See Brookhart & Mountcastle. 1981;1981:597–666. [Google Scholar]
- Lemon RN. Descending pathways in motor control. Annual review of neuroscience. 2008;31:195–218. doi: 10.1146/annurev.neuro.31.060407.125547. [DOI] [PubMed] [Google Scholar]
- Levine AJ, et al. Identification of a cellular node for motor control pathways. Nat Neurosci. 2014;17:586–593. doi: 10.1038/nn.3675. [DOI] [PMC free article] [PubMed] [Google Scholar]
- Levine AJ, Lewallen KA, Pfaff SL. Spatial organization of cortical and spinal neurons controlling motor behavior. Curr Opin Neurobiol. 2012;22:812–821. doi: 10.1016/j.conb.2012.07.002. [DOI] [PMC free article] [PubMed] [Google Scholar]
- Liu K, et al. PTEN deletion enhances the regenerative ability of adult corticospinal neurons. Nat Neurosci. 2010;13:1075–1081. doi: 10.1038/nn.2603. [DOI] [PMC free article] [PubMed] [Google Scholar]
- Low LK, Liu XB, Faulkner RL, Coble J, Cheng HJ. Plexin signaling selectively regulates the stereotyped pruning of corticospinal axons from visual cortex. Proc Natl Acad Sci U S A. 2008;105:8136–8141. doi: 10.1073/pnas.0803849105. [DOI] [PMC free article] [PubMed] [Google Scholar]
- Madisen L, et al. A toolbox of Cre-dependent optogenetic transgenic mice for light-induced activation and silencing. Nat Neurosci. 2012;15:793–802. doi: 10.1038/nn.3078. [DOI] [PMC free article] [PubMed] [Google Scholar]
- Marshel JH, Mori T, Nielsen KJ, Callaway EM. Targeting single neuronal networks for gene expression and cell labeling in vivo. Neuron. 2010;67:562–574. doi: 10.1016/j.neuron.2010.08.001. [DOI] [PMC free article] [PubMed] [Google Scholar]
- Mastwal S, Ye Y, Ren M, Jimenez DV, Martinowich K, Gerfen CR, Wang KH. Phasic dopamine neuron activity elicits unique mesofrontal plasticity in adolescence. J Neurosci. 2014;34:9484–9496. doi: 10.1523/JNEUROSCI.1114-14.2014. [DOI] [PMC free article] [PubMed] [Google Scholar]
- Miri A, Azim E, Jessell TM. Edging toward entelechy in motor control. Neuron. 2013;80:827–834. doi: 10.1016/j.neuron.2013.10.049. [DOI] [PubMed] [Google Scholar]
- Mukamel EA, Nimmerjahn A, Schnitzer MJ. Automated analysis of cellular signals from large-scale calcium imaging data. Neuron. 2009;63:747–760. doi: 10.1016/j.neuron.2009.08.009. [DOI] [PMC free article] [PubMed] [Google Scholar]
- Murayama M, Perez-Garci E, Luscher HR, Larkum ME. Fiberoptic system for recording dendritic calcium signals in layer 5 neocortical pyramidal cells in freely moving rats. J Neurophysiol. 2007;98:1791–1805. doi: 10.1152/jn.00082.2007. [DOI] [PubMed] [Google Scholar]
- Nudo RJ, Masterton RB. Descending pathways to the spinal cord, III: Sites of origin of the corticospinal tract. J Comp Neurol. 1990;296:559–583. doi: 10.1002/cne.902960405. [DOI] [PubMed] [Google Scholar]
- O’Leary DD. Development of connectional diversity and specificity in the mammalian brain by the pruning of collateral projections. Curr Opin Neurobiol. 1992;2:70–77. doi: 10.1016/0959-4388(92)90165-h. [DOI] [PubMed] [Google Scholar]
- Oh SW, et al. A mesoscale connectome of the mouse brain. Nature. 2014;508:207–214. doi: 10.1038/nature13186. [DOI] [PMC free article] [PubMed] [Google Scholar]
- Parent M, Parent A. Single-axon tracing study of corticostriatal projections arising from primary motor cortex in primates. J Comp Neurol. 2006;496:202–213. doi: 10.1002/cne.20925. [DOI] [PubMed] [Google Scholar]
- Penfield W, Boldrey E. Somatic motor and sensory representation in the cerebral cortex of man as studied by electrical stimulation. Brain. 1937;60:389. [Google Scholar]
- Ramanathan D, Conner JM, Tuszynski MH. A form of motor cortical plasticity that correlates with recovery of function after brain injury. Proc Natl Acad Sci U S A. 2006;103:11370–11375. doi: 10.1073/pnas.0601065103. [DOI] [PMC free article] [PubMed] [Google Scholar]
- Shenoy KV, Sahani M, Churchland MM. Cortical control of arm movements: a dynamical systems perspective. Annu Rev Neurosci. 2013;36:337–359. doi: 10.1146/annurev-neuro-062111-150509. [DOI] [PubMed] [Google Scholar]
- Shepherd GM. Diversity and complexity in the pyramidal tract projectome. Nat Rev Neurosci. 2014;15:63. doi: 10.1038/nrn3469-c2. [DOI] [PubMed] [Google Scholar]
- Smith Y, Wichmann T, DeLong MR. Corticostriatal and mesocortical dopamine systems: do species differences matter? Nat Rev Neurosci. 2014;15:63. doi: 10.1038/nrn3469-c1. [DOI] [PMC free article] [PubMed] [Google Scholar]
- Stachniak TJ, Trudel E, Bourque CW. Cell-specific retrograde signals mediate antiparallel effects of angiotensin II on osmoreceptor afferents to vasopressin and oxytocin neurons. Cell Rep. 2014;8:355–362. doi: 10.1016/j.celrep.2014.06.029. [DOI] [PubMed] [Google Scholar]
- Tennant KA, Adkins DL, Donlan NA, Asay AL, Thomas N, Kleim JA, Jones TA. The organization of the forelimb representation of the C57BL/6 mouse motor cortex as defined by intracortical microstimulation and cytoarchitecture. Cerebral cortex (New York, NY: 1991) 2011;21:865–876. doi: 10.1093/cercor/bhq159. [DOI] [PMC free article] [PubMed] [Google Scholar]
- Tripodi M, Stepien AE, Arber S. Motor antagonism exposed by spatial segregation and timing of neurogenesis. Nature. 2011;479:61–66. doi: 10.1038/nature10538. [DOI] [PubMed] [Google Scholar]
- Xu T, Yu X, Perlik AJ, Tobin WF, Zweig JA, Tennant K, Jones T, Zuo Y. Rapid formation and selective stabilization of synapses for enduring motor memories. Nature. 2009;462:915–919. doi: 10.1038/nature08389. [DOI] [PMC free article] [PubMed] [Google Scholar]
- Yang G, Lai CS, Cichon J, Ma L, Li W, Gan WB. Sleep promotes branch-specific formation of dendritic spines after learning. Science. 2014;344:1173–1178. doi: 10.1126/science.1249098. [DOI] [PMC free article] [PubMed] [Google Scholar]
- Ziv Y, Burns LD, Cocker ED, Hamel EO, Ghosh KK, Kitch LJ, El Gamal A, Schnitzer MJ. Long-term dynamics of CA1 hippocampal place codes. Nat Neurosci. 2013;16:264–266. doi: 10.1038/nn.3329. [DOI] [PMC free article] [PubMed] [Google Scholar]
Associated Data
This section collects any data citations, data availability statements, or supplementary materials included in this article.
Supplementary Materials
(A) Experimental paradigm. HiRet-Cre vectors were injected into the cervical spinal cord (C3–C7) at P4. At adult (P56–P63), AAV-FLEX-GFP or AAV-FLEX-tdTomato was injected to motor cortex (RFA or CFA) or visual cortex, respectively. In 2 weeks, mice were terminated for anatomical analysis.
(B) A 3D image stack of whole brain sections (60 μm thick sections, about 115 sections) from a mouse with CSNs and their axons labeled with anti-GFP or RFP from motor cortex or visual cortex respectively. Please note that while GFP+ axons project from cortex to pyramid, RFP+ axons were only visible in the cortex and the midbrain regions, but not at the pyramid. Scale bar: 1 mm.
(C, D) Representative images of single cortical sections showing labeled neurons in the motor cortex (C) or visual cortex (D). For quantification in G, all labeled neurons in all cortical sections were counted in individual mice. Scale bar: 100 μm.
(E, E′, F) Representative images of a coronal pyramidal section showing the cortical axons labeled with anti-GFP (E) or RFP (F). Total numbers of GFP or RFP labeled axons were quantified at 100× magnification as shown in (E′). The circles in image (E′) indicate individual axons being counted. Scale bars: 50 μm; for E and F, 5 μm for E′.
(G) Percentages of axon number over total labeled cortical neuron number in motor (RFA or CFA) and visual cortex. 5 animals were quantified, ** p < 0.001, n = 5, Student’s t test.
(A) Confocal fluorescence images of coronal brain sections showing specifically labeled CSNs. HiRet-Cre viral vectors were injected into spinal cord and AAV9-FLEX-syn-GCaMP6s was injected into motor cortex. Left, 10× images showing labeled neurons and dendrites in the AAV-injected area; Right, 25× images showing magnified views of apical dendritic trunks in the AAV injected areas (dotted lines indicate the expected focal plane of head-mounted microscope). Scale bar: 100 μm.
(B) Left: Diagram showing the procedure to image the dendritic activity of CSNs in a deeply anesthetized state with antidromic spinal cord stimulation. Right: Example showing dendritic trunk and tuft signals are strongly correlated and phase-locked to the electrical stimuli during antidromic spinal cord stimulation. The upper image shows a dendrite identified by ICA analysis. The red circle indicates the dendritic trunk and the blue, green and magenta circles indicate apical tufts. The lower traces show the corresponding temporal signals of the dendritic trunk and apical tufts. AES: Antidromic Electrical Stimulation. Scale bar: 50 μm.
(C) Example showing dendritic trunk and apical tuft signals are less correlated during the freely moving state (Left and Middle). Right, Activity correlation between dendritic trunk and apical tuft is higher during antidromic stimulation compare to that in a freely moving state (P = 0.01, n = 10, 20 dendrites for antidromic stimulation and freely moving state, respectively). Scale bar: 50 μm.
(D) Diagram showing the procedure to image CSN activities by microprism lens in a freely moving state. The upper image shows a neuron identified by ICA analysis. The red circle shows the soma and the blue, green and magenta circles indicate dendritic trunk. The lower traces show that dendritic trunk signals are synchronized with the soma signal in freely moving state. Scale bar: 100 μm.
(E) Example images showing the mixed distribution of CSNs with different phase preferences in a local cortical area. Green for pre-reaching, red for pre-grasping, blue for post-grasping, and white for non-task-related. The left image showing more pre-grasping activity is re-plotted from Fig 2F for comparison with the other images in this panel that show more pre-reaching and post-grasping related activities.
(A, B, C) Overground stepping performance. Weight support (A) and excursion length (B) of forelimb (FL) and hindlimb (HL) and intralimb coordination (C) in control (Emx1Cre GFP, n=6) and CSN-ablated mice (Emx1Cre DTR, n = 7).
(D) Forelimb grip strength analysis of control Emx1Cre GFP or Emx1Cre DTR mice with pre (−DT) and post (+DT) administration.
(E) Performance on vermicelli handling test of control (Emx1Cre GFP) and CSN-ablated mice (Emx1Cre DTR). ** p < 0.01, when compared to the control. n = 6, 7 for control and CSNs-ablated animals respectively.
(F, G) Three-dimensional (x, y, z) paw closure positions relative to the pellet from representative control (F) and Emx1Cre DTR (G) mice pre- and post DT administration. The paw in cartoon shows the reaching direction. The ball represents the pellet, the center of which represents the coordinates (0,0,0).
(H, I) Mean (H) and standard deviation (I) of the distance (mm) between the paw closure position and the pellet center in control and corticospinal neuron ablated animals. ** in H, I, p < 0.01. Student’s t test. n = 3 for each group.
(J) Three-dimensional reaching trajectories from representative control, CFA and RFA-CSNs-DTR mice pre and post DT administration. The brown circles represent the position of pellets.
(K) Three-dimensional (x, y, z) paw closure positions relative to the pellet from representative control, CFA and RFA-CSNs-DTR pre and post DT administration. The paw in cartoon shows the reaching direction. The circle represents the pellet, the center of which represents the coordinates (0,0,0).
(L) The Hausdorff distance between multiple trajectories were calculated pre (−DT) or post (+DT) administration in control, CFA and RFA-CSNs-DTR mice.
(M–N) Mean (M) and standard deviation (N) of the distance (mm) between the paw closure position and the pellet in control, CFA and RFA-CSNs-DTR mice. ** and * in M–N, p < 0.01 and p < 0.05 when compared to that prior to DT treatment, respectively. Student’s t test. n= 3, 4, 3 for control, CFA and RFA corticospinal neuron ablated animals respectively.
(A) Experimental paradigm for (B) and Figure 6. Mice were injected with AAV-tdTomato-p2A-SypGFP into multiple cortical sites in different animals at 6–8 weeks old. In 2 weeks, those mice were sacrificed for histological analysis. As a result, all transduced cortical neurons including CSNs were labeled, but only CST axons from CSNs could be seen in the spinal cord.
(B) Representative images showing axons and synaptic terminals [merged from magenta (RFP) and green (SypGFP)] in the spinal cord. Scale bars: 100 (left) and 20 μm (middle), respectively.
(C–G) The subcortical collaterals and spinal projections of selectively labeled CSNs. To trace the projection of CSNs in RFA, HiRet-Cre vectors were injected into entire cervical spinal cord (C3–C7) at P4. At adult (P56–P63), AAV-FLEX-tdTomato-p2A-SypGFP was injected to RFA. (C, D) A 3D image stack of whole brain (C) and cervical C2–C5 spinal cord (D) sections (40 μm thick sections, about 350 sections) from a mouse with CSNs at RFA and their axons labeled with anti-RFP. The spinal cord (D) was separated from the brain (C) and rotated so that CST collaterals could be clearly visualized in both subcortical regions and spinal cord. The white line delineated the main CST track. The regions of Striatum, Zona incerta (ZI), anterior pretectal nuclei (APT), Pontine nuclei (Pn), Reticular formation (GiV), Cuneate nucleus (CU) were marked in the image. Paxinos nomenclature was used for the description. Scale bar: 1 mm. (E) A 3D mouse brain image of GFP+ axonal projections from a cortical site, taken from Allen mouse brain connectivity atlas (Experiment ID: 180719293). The red line delineated the main CST track. (F) Representative images show GFP+ boutons in striatum, anterior pretectal nuclei (APT), pontine reticular nucleus (Pn), reticular formation (GiV), cuneate nucleus (CU), and spinal cord. Scale bar: 100 μm.
(G) Percentage of average GFP+ boutons per labeled CSN in the subcortical regions of striatum, thalamus (TH), subthalamic nucleus (STN), anterior pretectal nuclei (APT), zona incerta (ZI), red nucleus (RN), superior colliculus (SC), pontine reticular nucleus (Pn), reticular formation (GiV), spinal trigeminal nucleus (SP5), medullary reticular formation ventral part (MdV), cuneate nucleus (CU), and spinal cord. The GFP positive boutons in each subcortical areas of individual animal in all sections were detected by the spot detection function of Imaris software and added up. The total positive boutons in each subcortical region was normalized by the number of total labeled mature corticospinal neurons. The boundaries of each subcortical area were drawn by superimposing those images on Allen mouse brain atlas, Mouse, P56, coronal. 4 and 5 mice with CSNs labeling from RFA or CFA were quantified respectively.
(A) Representative images showing cells labeled with rabies virus-mediated fluorescence (mCherry for CU and GFP for CR, left), anti-ChAT (Middle) and both (Right) in the ventral horn of C6 spinal cord transverse sections. The quantities of labeled motor neurons (ChAT+) are comparable when rabies viruses were injected into the wrist extensor (CR) or flexor (CU), respectively. Scale bar: 20 μm.
(B,C) Representative images (left panels) and density maps (right panels) of premotor neurons of shoulder extensor spinodeitoideus (B) and neck (C) muscles (mixture of extensor and flexor). Scar bars: 500 μm.
(D, E) Quantification of the overlapping between CST axon termination from different cortical zones and the premotor neuron area of shoulder extensor spinodeitoideus (D) and neck (E) muscles in the rostral cervical spinal cord (C2–C4). The overlapping index is presented as the overlapping area between the core areas of CST termination and premotor neurons divided by the entire core area of CST termination in the rostral cervical spinal cord (C2–C4). ** and *: p < 0.01 and p < 0.05, n = 3 from shoulder and neck premotor neuron traced animals, respectively. One way ANOVA, followed by post hoc Student’s t test.
(A) Schematic drawing of the experimental procedure. To selectively label CST axons in C6–7 and their cell bodies in the cortex, HiRet-Cre vectors were injected into cervical spinal cord (C6–C7) at P28 and AAV-FLEX-GFP and AAV-FLEX-tdTomato were injected to Zone 1 and Zone 4 respectively at P56–P63. In 2 weeks, the mice were terminated for anatomical analysis. Bottom left: A representative whole spinal cord image (control experiment with HiRet-GFP injection) showing the injection site at C6–C7 spinal cord. Scale bar: 1 mm.
(B) Representative images of labeled CSNs in zone 1 (RFA) and zone 4 (posterior-lateral CFA) from the same mouse. Note that many neurons are labeled in Zone 1 but few in Zone 4. Scale bar: 0.5 mm.
(C) Representative images of CST axon termination in rostral (C2–C3) and caudal (C6–C7) spinal cord from labeled CSNs at zone 1 (left panels) and zone 4 (right panels). Scale bar: 200 μm.
(D) Stimulation sites: Zone 1 and Zone 4.
(E) Rectified and averaged EMG responses induced by opto-stimulation in each zone.
(F) Normalized EMG responses of individual muscle were averaged across 3 mice. **, p < 0.01, n=3. Student’s t tests.
(A) Experimental paradigm. With spinal HiRet-Cre injection at P4, whole cortical AAV-FLEX-hM4Di injection at P21, Lox-Stop-Lox-ChR2-YFP mice were subjected to long-duration optogenetic stimulation before and after (15–60 min) infusion of CNO or saline at C3 or C7 spinal cord level.
(B) Left, FLEX-hM4Di-mCitrine expression in CSNs located in RFA and CFA, scale bar 200 μm; Right, Cartoon drawing showing three stimulation zones (RFA, anterior-medial CFA, and posterior-lateral CFA). Crosses represent the centers of the three zones (n=6). (C–F) Changes of joint movements induced by optogenetic stimulation at three cortical zones (RFA, anterior-medial CFA, and posterior-lateral CFA) when CNO or saline was infused to the C3 or C7 cervical spinal cord. **, p < 0.01, n = 6, 6 for CNO and saline injected animals at both C3 and C7. Student’s t tests.
Supplementary Movie 1, Imaging CSN activity during food pellet retrieval behavior, Related to Figure 2
Supplementary Table 1 Topographical mapping of joint movements induced by optogenetic stimulation of CSNs or layer 5 pyramidal neurons, Related to Figure 4