Abstract
High resolution total internal reflection (TIRF) microscopy (TIRFM) together with detailed computational modeling provides a powerful approach towards the understanding of a wide range of Ca2+ signals mediated by the ubiquitous inositol 1,4,5-trisphosphate (IP3) receptor (IP3R) channel. Exploiting this fruitful collaboration further requires close agreement between the models and observations. However, elementary Ca2+ release events, puffs, imaged through TIRFM do not show the rapid single-channel openings and closings during and between puffs as are present in simulated puffs using data-driven single channel models. TIRFM also shows a rapid equilibration of 10ms after a channel opens or closes which is not achievable in simulation using standard Ca2+ diffusion coefficients and reaction rates between indicator dye and Ca2+. Furthermore, TIRFM imaging cannot decipher the depth of the channel with respect to the microscope, which will affect the change in fluorescence that the microscope detects, thereby affecting its sensitivity to fast single-channel activity. Using the widely used Ca2+ diffusion coefficients and reaction rates, our simulations show equilibration rates that are eight times slower than TIRFM imaging. We show that to get equilibrium rates consistent with observed values, the diffusion coefficients and reaction rates have to be significantly higher than the values reported in the literature, and predict the channel depth to be 200–250nm. Finally, we show that with the addition of noise, short events due to 1–2ms opening and closing of channels that are observed in computational models can be missed in TIRFM.
Introduction
Calcium (Ca2+) is a universal signaling ion that controls diverse cellular functions. [3, 4, 13]. Elucidating Ca2+ signaling mechanism is therefore crucial for not only normal cell function but also understanding a wide range of pathological conditions such as neurological diseases [2, 5, 10, 11, 30], heart diseases [32], and mitochondrial dysfunction [15, 20, 30, 33, 34].
High resolution fluorescence microscopy and patch-clamp are the two main experimental techniques used for investigating wide range of Ca2+ signals from single channel events called blips to puffs due to concerted opening of multiple channels in a cluster of a few channels to whole cell waves. Recent advances in imaging techniques enable us to resolve Ca2+ signals at the single channel level within the intact environment [9, 10, 25, 29]. Nevertheless, they are unable to disect the coupling between individual channels as a function of their spatial organization, and connecting the single channel function to global Ca2+ signals. Patch-clamp techniques on the other hand, provide exquisite resolution of channel gating, but provide no spatial information [24]. Patch-clamp techniques are also bounded by the intracellular location of IP3R which causes them to be inaccessible to patch-clamp recording within intact cells. Other studies involving excised nuclei or lipid bilayer reconstitution provide no spatial information and disrupt Ca2+-induced Ca2+ release (CICR) processes that determines interactions between channels in a cluster [13, 29]. None of these techniques is capable of addressing the full spectrum of Ca2+ signals. Modeling approaches can bridge these scales, but on the other, require step-by-step validation by experiments to make meaningful predictions.
Over the last twenty five years several models for the kinetics of single IP3R have been developed [7, 8, 14, 22, 27, 28, 31, 36, 37]. Two models in particular replicate all observations about single IP3R including the gating of the channel in 3 distinct gating modes over a broad range of ligand dependencies, dwell-times, and latency distributions [7, 22, 28, 36]. Both these models were built on extensive single-channel patch-clamp data on IP3R [17, 18, 23, 39].
Cluster models built on Ullah’s and Siekmann’s models reproduce many observations about puffs [6, 7, 36, 38]. However, one major discrepancy between these models and experimental studies exists. Simulated puffs exhibit high amount of single-channel activity as compared to experimental TIRFM signals. Unlike experimental data, both models exhibit, fast (1–2ms duration) opening and closings of single channels between and during puffs. While investigating this discrepancy was a motivating factor for this study, we found that besides the possible missed single-channel events in TIRFM experiments, the widely accepted values of the free Ca2+ diffusion coefficient (DCa), and the binding/unbinding rates of Ca2+ to dye (αf, βf) are too slow to account for experimentally observed single-channel TIRFM signals. Experimental values of DCa in cytoplasm have ranged from 530µm2/s [12] to the most widely accepted and cited value of 223µm2/s [1]. Here, we show that the accepted values of DCa, αf, and βf used in computational studies are incompatible with experimentally observed TIRFM events, and examine the implications on TIRFM of these new parameters through simulated puffs. We find that to replicate single channel and puff TIRFM signals, larger values of DCa and on/off rates must be used. We also show that such short 1–2ms opening and closings of channels can be missed in TIRFM when the optimal experimental signal-to-noise ratio (SNR) of greater than or equal to 8 is considered.
Computational Methods
The Model
We follow the protocol outlined in [26] and simulate the diffusion of Ca2+ throughout the cuboid cytosolic space as shown in Fig. 1a in [26]. The bottom of the cubic box represents the ER membrane where a single Ca2+ channel is placed at the center. No-flux boundary conditions are applied to the plasma membrane while the other five sides of the box are held at a constant resting concentration for all signaling species.
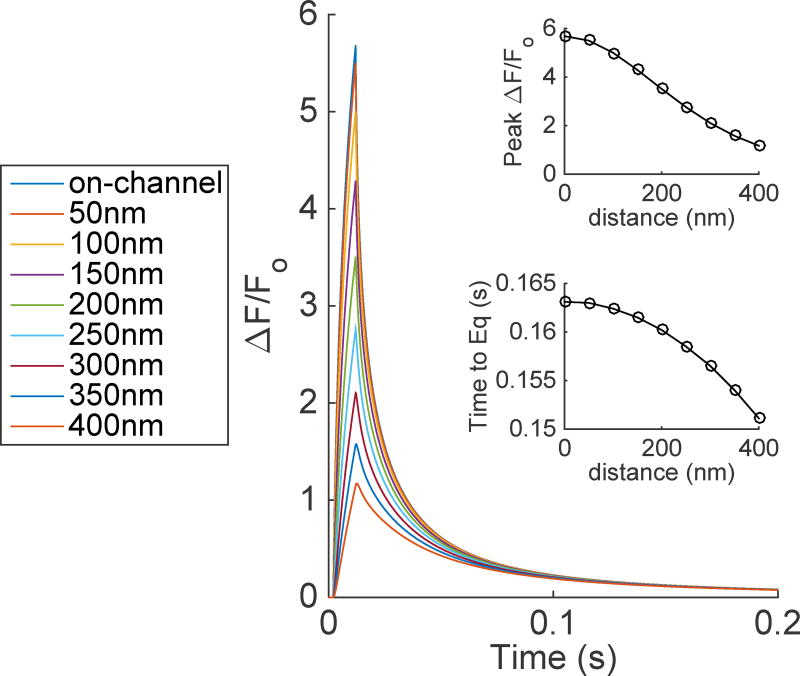
Figure 1.
Time evolution of TIRFM signals from a 10ms single Ca2+-channel opening. The distance in the positive x-direction was varied to show how ΔF/Fo is dependent upon distance from the channel. The top and bottom insets show the peak ΔF/Fo and time to equilibrate (Time to Eq.) after the channel has closed as a function of distance from the channel. Using standard conditions: DCa=223µm2/s, DCaF=15µm2/s, αf=150 µM−1s−1, and βf=450 s−1.
The model includes the following species [26]: cytosolic free calcium ions (Ca2+), free stationary buffer (S), Ca2+-bound S (CaS), free cytosolic Ca2+ indicator dye (Cal), and Ca2+-bound cal (CalCa). In Figs 6 and 7, we evaluate the effect of mobile buffer (M), EGTA, on the simulation results. CalCa can represent any fluorescent Ca2+ indicator dye, but our parameter values listed in Table 1 correspond to Cal-520. Indicator dye Cal-520 has recently been shown to be the optimal indicator for faithfully detecting Ca2+ puffs [21].
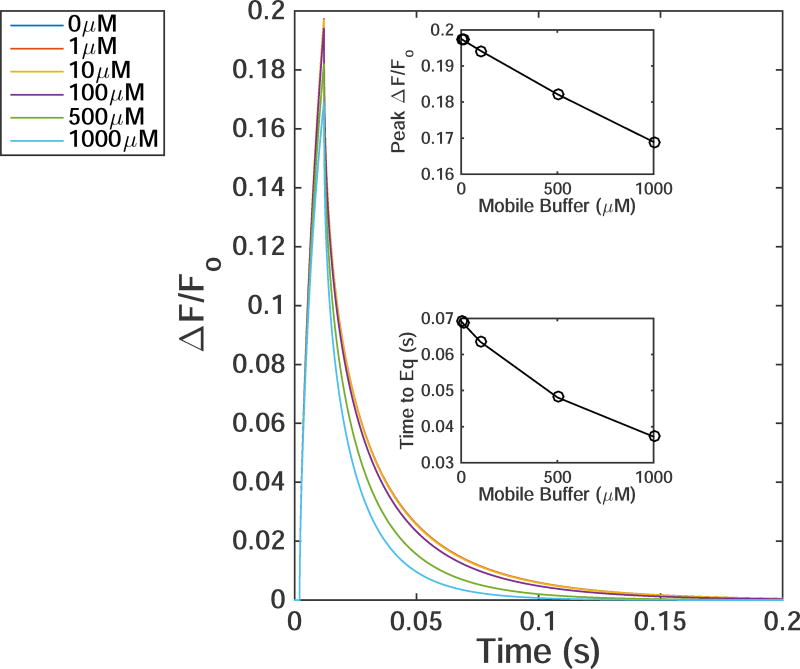
Figure 6.
Time evolution of TIRFM signals from a 10ms single Ca2+-channel opening with increasing value of [EGTA]. For all simulations DCa=223µm2/s, DCaF=74µm2/s, αf=100/(µMs), and βf=33/s was used. The top and bottom-inset shows the peak ΔF/Fo and time to equilibrate after the channel closes as a function of mobile buffer, respectively.
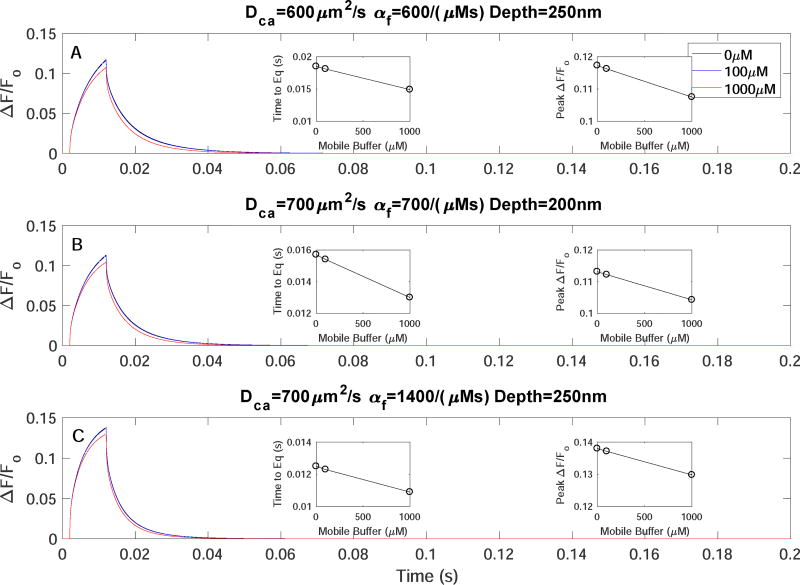
Figure 7.
Mobile buffer EGTA does not affect the kinetics of TIRFM signals. Time evolution of TIRFM signals from a 10ms single Ca2+-channel opening with increasing [EGTA]=0 (black),100 (blue), 1000µM (red) for A) DCa=600µm2/s, αf=600/(µMs), depth=250nm, B) DCa=700µm2/s, αf=700/(µMs), depth=200nm, and C) DCa=700µm2/s, αf=1400/(µMs), depth=250nm.
Table 1.
Parameter values used for simulations
| Parameters | Values |
|---|---|
|
| |
| Height of cytosol box | 2.05µM |
| Length of cytosol box | 4.05 µM |
| Width of cytosol box | 4.05 µM |
|
| |
| Free Ca2+ diffusion coefficient (Dca) | 200–700 µm2s−1 |
| Resting Ca2+ concentration ([Ca2+]rest) | 0.05 µM |
|
| |
| Bound indicator dye and Ca2+ diffusion coefficient (DCaF) | Dca/3 |
| Total indicator dye concentration ([Cal]T) | 40µM |
| Dissociation constant (κF) | 0.3 µM |
| Smoluchowski capture radius (rc) | 0.00005–0.0008µm |
| On-rate (αf) | see eq. 3 µM−1s−1 |
| Off-rate (βf) | κF*αf |
|
| |
| Mobile Buffer (EGTA) diffusion Coefficient (DCaM) | 200 µm2s−1 |
| Total mobile buffer concentration ([EGTA]) | 0µM – 1000µM |
| Dissociation constant (κM) | 0.15 µM |
| On-rate (αm) | 5 µM−1s−1 |
| Off-rate (βm) | 0.75 s−1 |
|
| |
| Total stationary buffer concentration ([S]T) | 300 µM |
| Dissociation constant (κT) | 2 µM |
| On-rate (αs) | 400 µM−1s−1 |
| Off-rate (βs) | 800 µM−1s−1 |
|
| |
| Maximum Ca2+ current (IMax) | 0.1 pA |
| Endoplasmic Reticulum concentration ([Ca2+]Er) | 600 µM |
We consider reactions of S, M, and Cal with free Ca2+ as
| (1) |
where X represents S, M, or Cal, α and β are the forward and backward binding rate, and [] represents the concentration of different species, respectively.
The reaction-diffusion equations for free Ca2+ with diffusion coefficient DCa is:
| (2) |
in which the channel distribution function δ0 is 1 at the grid element containing the channel and 0 otherwise. The binding rate, αf is given by the equation:
| (3) |
where rc is the Smoluchowski capture radius of dye for free Ca2+. DCa and DCaF are the diffusion coefficients for free Ca2+ and Ca2+-bound dye, respectively [35]. Note that typical units for rate constants are 1/(µMs), while typical units for rc are length (10−3µm) and diffusion coefficients are typically given in µm2/s. To convert αf from units of µm3/s to 1/(µMs) we multiply the right hand side of eq. 3 by 602/(µm3µM). The rate equation for [CalCa] is given as
| (4) |
For Ca2+-bound M, CaM with diffusion coefficient DCaM, we have
| (5) |
CaS is given by the rate equation,
| (6) |
The total concentrations for Ca2+ indicator ([Cal]T), EGTA ([M]T), and stationary buffer ([S]T) are given in Table 1. The channel flux is expressed as
| (7) |
where F=9.65×10⁻¹¹ CFmol−1, δV is the small cytosolic volume around the channel pore (dx3 where dx = 50nm) and the single channel current is given by ICh=υCh([Ca2+]Er−[Ca2+]) where [Ca2+]Er is Ca2+ concentration in the ER and υCh is the maximum Ca2+ flux through the channel. The maximum value of the channel current (IMax) that would flow immediately upon opening of the channel is IMax=υCh[Ca2+]Er because the resting free cytosolic [Ca2+] is negligible (50nM).
The resting values of [CalCa], [CaM], and [CaS] are given as:
| (8) |
| (9) |
and
| (10) |
The finite difference method was used to solve the partial differential equations given in this section. We used a time increment, Δt=0.5µs and spatial grid Δx=50nm. Thus, the cytosolic space was represented by a lattice of 81×81×41 grid elements as in [26].
Calculating fluorescence signals
Our aim is to simulate TIRFM signals from a single IP3R channel and compare them to signals recorded in [21, 29]. The model takes into account changes in [CalCa] that occur in 4 dimensions (x,y,z,time). We assume that fluorescence is linearly proportional to [CalCa] in which free [Cal] is non-fluorescent and a calculated weighted average of [CalCa] throughout the cytosolic volume corresponding to the microscope point-spread-function (p.s.f.) is used to predict changes in fluorescence that would be imaged experimentally. Representative p.s.f.’s of TIRF microscopes can be found in Fig. 5B in [26] in which the p.s.f. follows a Gaussian function in the lateral plane, but decays exponentially in the axial (z) dimension. In the simulations presented here, we focus the microscope on the plane of the ER membrane (bottom of the box in [26]). The TIRFM signal at any given point (x,y,z) is given by:
| (11) |
where σx=σy=0.0225µm2 and γz=0.15µm2 which replicates the experimentally observed lateral full width at half maximum (FWHM) of 250 nm and an e-fold decline over 150nm in the axial direction. VTIRF is defined as the weighted volume at the channel point:
| (12) |
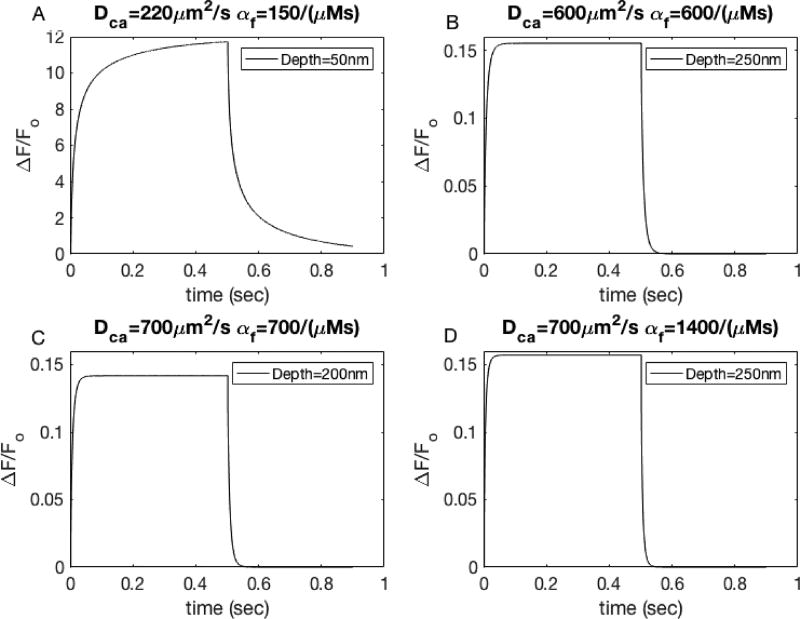
Figure 5.
Higher diffusion coefficients and on- and off-rates for Ca2+ binding to dye lead to single channel events that resemble those observed experimentally. Simulation of 500ms channel opening under (A) standard conditions of DCa=223µm2/s, αf=150/(µMs), depth=50nm, (B) DCa=600µm2/s, αf=150/(µMs), depth=250nm, (C) DCa=700µm2/s, αf=700/(µMs), depth=200nm, and (D) DCa=700µm2/s, αf=1400/(µMs), depth=250nm.
Results
Fig. 1 shows the time evolution of TIRFM signals originating from a single Ca2+-channel located on the plasma membrane (bottom of the box). We let the channel open for 10ms - typical mean open time for single IP3R [26, 29]. The diffusion coefficients used in Fig. 1 for free Ca2+ and Ca2+ bound fluorescent dye are the values that have been widely accepted and cited. We will call these standard conditions (see Table 2) [1]. In this figure, we vary the microscope distance with respect to the positive x-direction in order to illustrate how the peak change in fluorescence (ΔF/Fo) and time to equilibration is inversely proportional to the lateral distance of the microscope from the channel.
Table 2.
Standard Condtions for Ca2+ signaling
| Parameters | Values |
|---|---|
|
| |
| Free Ca2+ diffusion coefficient | 223 µm2s−1 |
| Bound indicator dye and Ca2+ diffusion coefficient | 15 µm2s−1 |
| Dissociation constant (κF) | 3.0 µM |
| On-rate (αf) | 150 µM−1s−1 |
| Off-rate (βf) | κF*αf |
It has been shown experimentally that fluorescence signals due to single channel events from IP3R termed ’unitary blip’ show a maximum ΔF/Fo of 0.11 ± 0.01 [21, 29] for both widely used Ca2+ fluorescent dyes Fluo-4 and Cal-520. Multiple channel events, puffs, have higher ΔF/Fo of approximately 2–3. It is clear from the top-inset of Fig. 1 that the peak ΔF/Fo is much higher when we focus directly on the single Ca2+-channel. Furthermore, it was reported that a blip displays a ”rectangular” signal, demonstrating equilibration between the Ca2+ through the channel and the fluorescent dye in the cytoplasm of 10–15ms (see Fig. 2 of [29]). It is clear from Fig. 1 that unlike experimental observations, ΔF/Fo does not reach equilibrium in 10ms. Once the channel has closed, we see a rapid drop in ΔF/Fo. The bottom-inset of Fig. 1 shows the time till equilibration is reached, which is taken to be ΔF/Fo=0.01, as this is below the baseline noise observed experimentally. As expected, the time to equilibration is inversely proportional to the distance from the channel. Just 400nm from the channel, the time far exceeds the experimentally observed values of 10–15ms [21, 29].
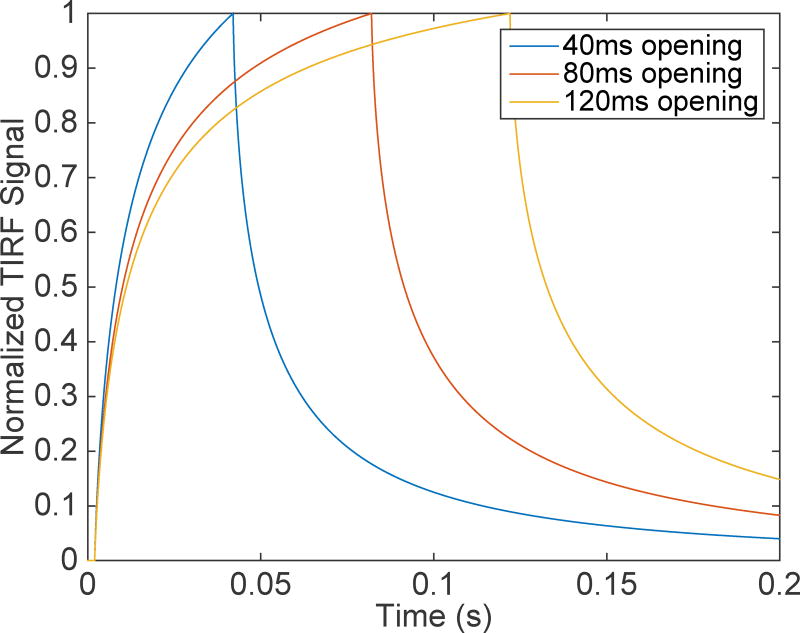
Figure 2.
Time evolution of normalized TIRF signals for 40ms (Blue), 80ms (Red), and 120ms (yellow) single Ca2+-channel openings.
To further illustrate the point that standard conditions and on-/off- rates widely used in simulation are too slow, Fig. 2 shows normalized single Ca2+-channel events for various open times of the channel. We allow the channel to remain open for 40ms (blue), 80ms (red), and 120ms (yellow). It is clear that even with the longer duration, the TIRF signal does not equlibrate with channel openings 12 times longer than the mean open time reported in experiments.
Channel depth analysis
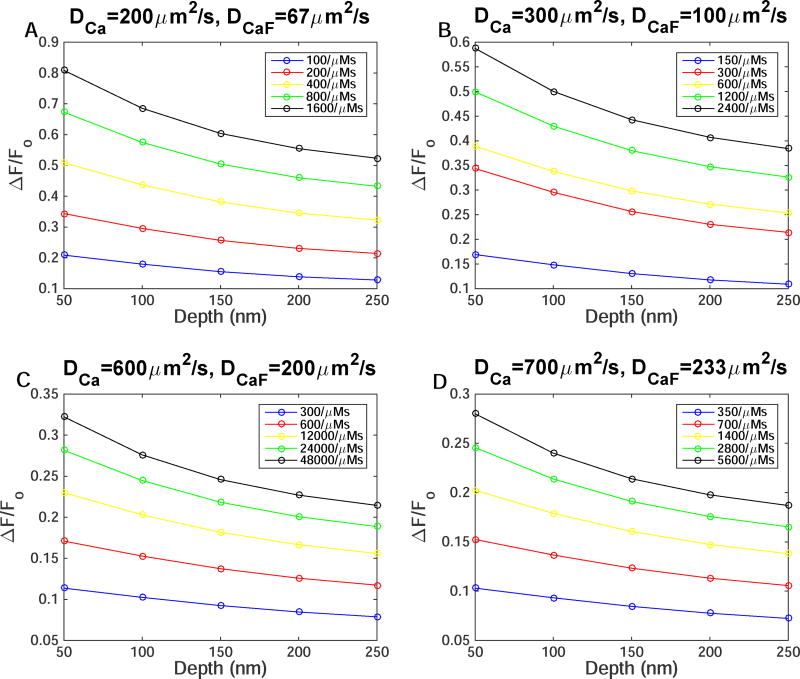
In TIRFM experiments, the user has control of the microscope stage in the (x,y) direction, but the depth of the channel or cluster that is being focused on is somewhat unknown. In the following, we vary the depth of the channel with respect to the microscope to evaluate the effect of the channel depth on TIRFM signal. We also vary the reaction rate for Ca2+ binding to the dye and the diffusion coefficients of free Ca2+ (eq 3) to look for the conditions where the dye kinetics from simulation would match experimental observations. For the remaining of this paper, we keep the diffusion coefficients of Ca2+-bound dye to be one-third of DCa. Fig. 3 shows peak ΔF/Fo after a 10ms single Ca2+-channel opening for DCa=200 (Fig. 3a), 300 (Fig. 3b), 600 (Fig. 3c), and 700 µm2/s (Fig. 3d). Lines with different colors represent different on- and off -rates for Ca2+ binding to the dye. For example, the blue line represents rc=0.00005µm, and we double rc each time so that the red line represents rc=0.0001µm and so on up to rc=0.0008µm (black line). The legend for each box shows the on-rate (αf) for each set of simulations. We then vary the depth of the channel but keep the microscope focused on the (x,y) grid of the channel (unlike Fig. 1). We vary rc within a reasonable range to vary αf. Note that βf changes accordingly in order to keep the dissociation constant fixed at experimentally observed values. As expected, the maximum ΔF/Fo decreases as the depth increases. Fig. 3 also shows an inverse relation between DCa and ΔF/Fo. That is, as we increase DCa, peak ΔF/Fo decreases. Increasing αf increases ΔF/Fo. We can pick out several combinations for DCa, αf, and depth of the channel that would result in experimentally observed ΔF/Fo for single Ca2+-channel events (~ 0.11 ΔF/Fo) but the time to equilibration must also be accounted for in order to make a comparison between theoretical and experimental values.
Figure 3.
The effect of diffusion coefficients, depth of the channel, on- and off-rates of Ca2+ binding to the dye on peak fluorescence. Maximum ΔF/Fo as a function of depth as αf increases due to increasing rc with (A) DCa=200µm2/s, (B) DCa=300µm2/s, (C) DCa=600µm2/s, and (D) DCa=700µm2/s.
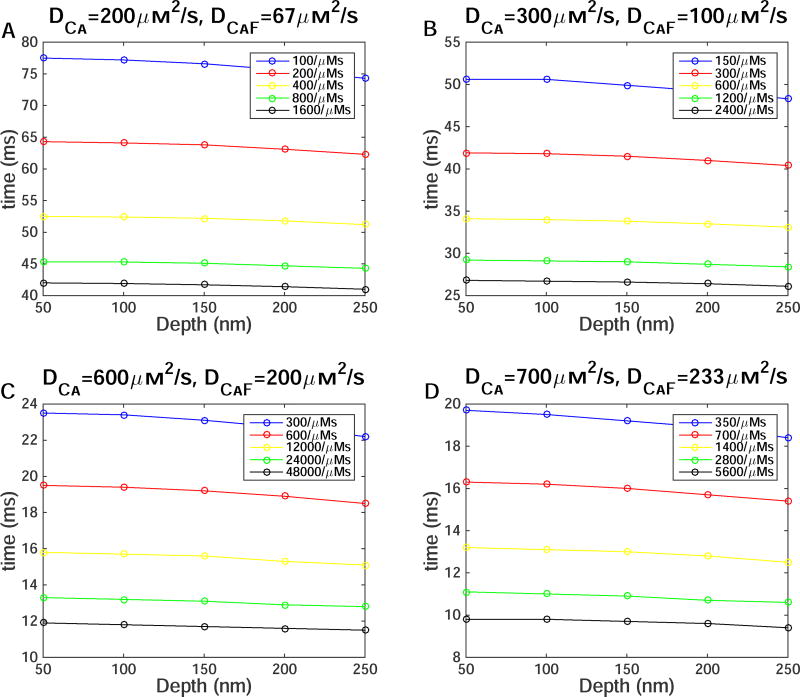
Fig. 4 shows the duration that the TIRFM signal takes to equilibrate after the channel closes in simulations from Fig. 3. The equilibration time decreases as we increase DCa and αf. We can use Fig. 3 and Fig. 4, to map the parameters DCa, αf, and depth of the channel that would replicate experimentally observed fluorescence signals. As discussed above, experimental TIRFM during blips reach peak ΔF/Fo ~ 0.11 and equilibrate in 10–15ms after the channel closes. These simulations show that DCa and αf must be much higher than the widely used values. Furthermore, the depth of the channel clearly makes a difference in the peak ΔF/Fo value that is recorded in experiments. The parameter values that most closely reproduce the kinetics of indicator dye used in TIRFM are 1) DCa=600µm2/s, αf=600/(µMs), depth=250nm, 2) DCa=700µm2/s, αf=700/(µMs), depth=200nm, and 3) DCa=700µm2/s, αf=1400/(µMs), depth=250nm.
Figure 4.
The effect of diffusion coefficient, depth of the channel, on- and off-rates of Ca2+ binding to dye on equilibration time. Time to equilibration after the channel closes as a function of depth as the αf increases due to increasing rc with (A) DCa=200µm2/s, (B) DCa=300µm2/s, (C) DCa=600µm2/s, and (D) DCa=700µm2/s.
To illustrate how these parameters result in fluorescence signals that closely resemble the experimentally observed TIRF signals, we simulate a 900ms experiment in which a channel is open for 500ms. Fig. 5A shows standard conditions. Like Fig. 2, the signal continues to rise even if we let the channel stay open longer than 500ms. Furthermore, the ΔF/Fo is 2 orders of magnitude higher than the unitary signal. Fig. 5B–D shows the 500ms channel-opening simulation for the 3 sets of parameters mentioned above. It is clear, that the larger values of DCa, αf, and depth of the channel produce a signal that more closely resembles the unitary signal seen in the experiments. The signal equilibrates and plateaus in around 10ms and once the channel closes, the decay is within the same time period. Also, the peak value of ΔF/Fo is much closer to the 0.11 value. Later, these parameter sets will be used for simulating puffs to determine possible missed events in TIRFM signals.
The effect of mobile buffer EGTA on peak fluorescence and equilibration time
The above simulations did not consider any mobile Ca2+ buffer other than the Cal-520 indicator dye. In the following, we include mobile buffer EGTA to see if it changes the conclusions above. Fig. 6 shows the time trace of simulated single-channel TIRFM signals in the presence of various concentrations of EGTA. For each simulation DCa=223µm2/s, DCaF=74µm2/s, αf=100/(µMs) are used. The top and bottom insets show the peak ΔF/Fo and time to equilibrate, respectively for each simulation as a function of [EGTA]. For [EGTA] of 1–10µM the difference in peak ΔF/Fo and time to equilibrate is essentially negligible. At 100µM the peak ΔF/Fo and time to equilibrate is 10% and 28% smaller respectively, as compared to control conditions (no EGTA). Increasing [EGTA] to 1000µM increases these differences to 15% and 33%, respectively. Thus, even adding a 1000µM [EGTA] wouldn’t result in dye kinetics consistent with experimental observations at standard parameter values. To further illustrate the point that the mobile buffer does not change our final conclusions, we show the effect of 100µM and 1000µM [EGTA] on TIRFM signals using the 3 optimal parameter sets deduced above (Fig. 7). The insets in each panel show the time to equilibrate once the channel is closed (left) and the peak ΔF/Fo (right) for the corresponding parmaters with varying [EGTA]. The same modest change in kinetics of TIRFM signal is observed.
Possible Experimentally Missed Events
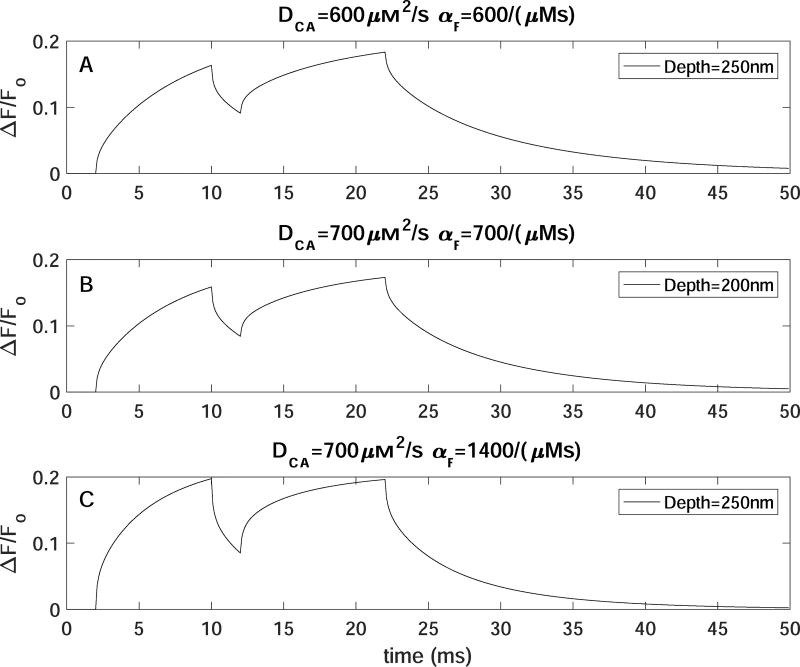
Fig. 8A–C shows a simulated time trace from two channels in a cluster in which the microscope is focused on the first channel at the center of the box and the second channel is located 100nm in the negative x-direction. We use the three optimal sets of parameters in the conditions with no EGTA. We simulate a situation in which the second channel opens 2ms after the first channel closes. In Fig. 8A–B, ΔF/Fo reaches ~0.15 during the 8ms opening of 1st channel. Once the first channel closes at t=10ms, ΔF/Fo drops to 0.9 before the second channel opens at 12ms where ΔF/Fo starts increasing again. Within 5ms of a channel closing and another channel opening 2ms later, the TIRFM signal reaches its peak value from the first opening. Fig. 8C shows the same sequence of events, except the peak ΔF/Fo from the first channel opening is ~0.2. These simulations have an infinite SNR which is unrealistic for TIRFM experiments. We thus expand this experiment to include 5 channels on a cluster and add a SNR of 8 in the same manner as the molecular shot noise in section 4.3 of [26]. We choose a SNR of 8 because that is the optimal SNR achieved in experiments for Cal-520 when comparing different fluorescent dyes [21]. The channels are laid out so that the first channel is in the center of the box, the other 4 channels are placed at (x,y) coordinates of (−100,0), (100,0), (0,−100), and (0,100) in nm with respect to the center channel. With this set-up, we simulate a puff such that at the peak of the puff, a single channel closes, and another opens 2ms later, just as in Fig. 8.
Figure 8.
Simulating two channels with optimal conditions. Time trace simulation of 2 channels in which the second channel located 100nm away from the center channel opens 2ms after the first channel closes with (A) DCa=600µm2/s, αf=150/(µMs), depth=250nm, (B) DCa=700µm2/s, αf=700/(µMs), depth=200nm, and (C) DCa=700µm2/s, αf=1400/(µMs), depth=250nm
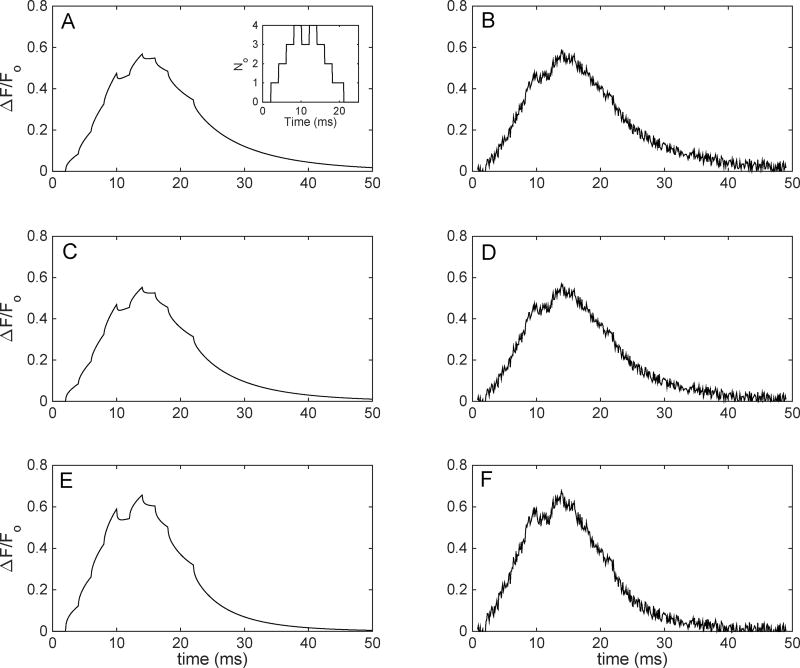
Fig. 9 shows time traces of the number of channels open and the TIRFM signal for the simulated puffs as described above. As the inset in Fig. 9 shows, the first channel opens at t=2ms, with the next 3 opening at 2ms intervals afterwards. At t=8ms we have 4 channels open, then the first channel closes at 10ms, leaving 3 channels open. At 12ms, the last channel opens, which creates the same situation at the peak of the puff as in Fig. 8. The remaining channels close at 14ms, 16ms, 18ms, and 22ms. Time traces for these events for the 3 optimal conditions without and with noise are shown in the left and right column, respectively. With noise, the 2ms closing and opening that happens between 12 and 14ms creates a plateau in the TIRFM signal as is regularly seen in experimental TIRFM signals [29]. These plateaus have been attributed to a single channel that stays open until the next channel opens or closes which would change the TIRFM signal and would be detected by the experiment. Thus, at 10ms the TIRFM experiment would determine that 4 channels are open, whereas only 3 are open until 12ms when the 4th channel opens without noise, where in experiment this would be mistaken for a 5th channel opening. Without noise, (Fig. 9A,C,E) the closure of the channel at 10ms is clearly visible but is washed out by the addition of noise (Fig. 9B,D,F) as is present in TIRFM experiment. Thus, we believe that a closure of one channel and reopening of another within 2ms would result in a missed event. As mentioned before, the depth of the cluster is unknown to the user and any cluster at a depth greater than 250nm could lead to many single-channel events that occur within 2ms to be washed out by the noise in the system. Furthermore, with the addition of high concentrations of [EGTA] (not shown), ΔF/Fo would decrease further, and thus would make it relatively more difficult to experimentally estimate the number of open channels and short openings and closings.
Figure 9.
Time traces of a 5 channel puff simulation under various conditions with-out and with noise with a SNR equal to 8. Puff simulation at DCa=600µm2/s, αf=150/µMs, depth=250nm (A, B), DCa=700µm2/s, αf=700/µMs, depth=200nm (C, D), and DCa=700µm2/s, αf=1400/µMs, depth=250nm (E, F). Panels in left column are without noise, while those in the right columns are with noise.
Discussion
A close agreement between computational and experimental tools is crucial in developing a clear picture of the mechanisms of Ca2+-release through IP3R and bridging several spatiotemporal scales of Ca2+ signaling ranging from single channel events to waves at whole cell and tissue levels. Recent advances in patch clamp and imaging techniques have enabled us to develop realistic models of Ca2+ signaling. Predictions from these models are quantitative in nature and allow direct comparison with experiments. Optical approaches such as TIRFM in particular have made it possible to provide information about channels that are inaccessible to patch clamp techniques. These high resolution imaging techniques also provide spatial information about channel locations, and allow simultaneous recordings through multiple channels. Studying Ca2+-release through IP3R channels with TIRFM is especially helpful because of their location on the ER membrane. However, some discrepancies between the detailed biophysical models and TIRFM exist that need to be addressed. In particular, we report that the widely accepted values of diffusion coefficient of Ca2+ and the binding and unbinding rates of Ca2+ to the imaging dye lead to inconsistencies between experimental and theoretical results. All these parameters are key to Ca2+ signaling and interpreting experimental results.
Previously, Ca2+ range of action was determined by measurement of its diffusion coefficient in cytosolic extract from Xenopus laevis oocytes [1]. In Allbritton et al., 1992, the authors take precautions to avoid sequestration of Ca2+ by internal stores, that was not previously done in [16] when measuring movements of Ca2+. In [1], the Ca2+ was layered on top of cytosolic extract in a thin tube and allowed to diffuse for various periods of time. Once the tube was frozen, concentrations of the labeled radioactive Ca2+ was measured and the value of DCa was determined. The value of DCa was dependent upon the amount of free Ca2+ added to the cytosolic extract. The value of DCa=223µm2/s reported in [1] is the standard value that is widely accepted and used in theoretical studies. While many precautions were taken to measure DCa without sequestration, Fig. 3 of [1] shows the dependance of DCa on free Ca2+ added to the system and does not show signs of saturation at the reported value of 223µm2/s. Furthermore, the Allbritton et al., 1992 study did not cite a previous study [12] where similar sequestration precautions were taken and a value of DCa ~ 530µm2/s was reported.
As shown in Fig. 1 and Fig. 2, this widely accepted value for DCa used in many studies simulating blips and puffs, does not produce the results seen in single channel TIRFM. A theoretical study by Shuai and Parker in 2005 using the same modeling methods as used here, shows a similar result in which 10ms channel openings do not equilibrate and ΔF/Fo is much larger than experimental TIRFM single-channel openings. Although, this is not addressed in the study, they claim that under standard conditions, TIRFM should resolve single Ca2+-channel events as brief as 1 ms with a SNR ≥10 [26]. With these standard conditions that produce a larger TIRFM signal in simulations, the resolution of 1ms appears to be achievable; although they note that previously published experimental records do not achieve this resolution [26]. Making the DCa significantly larger (600–700µm2/s), as well as speeding up the on-/off- rates of Ca2+ binding to fluorescent dye, and considering the depth of the channel close to 200nm as in Fig. 3 and 4, allows us to determine parameters that closely resemble the experimental TIRFM signal for single-channel Ca2+-release through IP3R. To our knowledge, the ’standard values’ for DCa is being widely used in most computational studies, although a value off DCa=600µm2/s was recently used to explore the link between bioenergetics and motor neuron degeneration [19]. A TIRFM study by [9], imaged Ca2+-permeable channels on the plasma membrane of Xenopus oocytes where they were able to simultaneously resolve gating kinetics, voltage dependance, and localization of channels. In the experimental set-up, the authors estimated a ~200nm distance between the cover glass of the microscope and the membrane. This estimate supports the channel distance estimated in our simulations. Fig. 5 shows the TIRFM time traces using the optimal parameters (DCa=600–700µm2/s, αf =600–1400/(µMs), channel depth=200–250nm) that more closely resemble the experimental results for a single-channel opening as seen in [29] where single-channel TIRFM signal plateaus within 10–15ms of opening. The equilibration of the signal within 10–15ms upon the channel opening and closing and the max ΔF/Fo in Fig. 5B–D provide an optimal parameter set to model TIRFM signals from puffs.
One overlooked discrepancy between experimental TIRFM signals from puffs and simulations is the high amount of single channel activity that occurs in simulation (see Fig. 2 of [6]). Instead of having no channel activity to a sudden cooperative opening of IP3R channels as seen in experiments, simulations show ’flickering’ of single-channels before the puff occurs. There is also significantly more single channel activity in simulated puffs as compared to observed puffs. Additionally, during a puff, TIRFM signals plateau quickly which appears to equilibrate before another channel opens [29]. With this in mind, we wanted to determine whether the TIRFM experiments can in fact detect single channel openings within a 2 ms time interval. That is, can TIRFM experiments using the best dye available, Cal-520 detect every channel closing and opening within 2ms resolution? We find that with the optimal values of DCa and on-/off- rates for Ca2+ binding to the dye that produce a TIRFM signal closer to experimental results, these 2ms events will be most likely missed for a SNR≥8. This could lead to reporting more channels open than interpreted by experiment.
Conclusion
Through computational modeling and comparison with experimental observations, we determine that DCa in the range of 600–700µm2/s yields a much better comparison with the TIFRM data. Similarly, the binding rate of Ca2+ with fluorescent dye yields a better comparison when the on rate is in the 600–1400/(µMs) range. While these parameters are much larger than previously reported, we find that these values lead to results that closely resemble TIRFM signals. Moreover, we are aware of no compelling physical arguments against the higher αf and DCa rates. We also found that single channel events with duration less than 2ms will likely be missed.
Elementary Ca2+ release events imaged through total internal reflection fluorescence (TIRF) microscopy differs from those simulated through data-driven single channel models. We simulate TIRF signals due to single and cluster channels and determine diffusion coefficients and binding/unbinding rates for fluorescence dyes that display TIRF signals that more closely resemble experiment.
Acknowledgments
This work was supported by the National Institute of Health grant numbers R01AG053988 and a startup grant from College of Arts and Sciences at University of South Florida (GU). And RO1 GM065830 (JEP).
Footnotes
Publisher's Disclaimer: This is a PDF file of an unedited manuscript that has been accepted for publication. As a service to our customers we are providing this early version of the manuscript. The manuscript will undergo copyediting, typesetting, and review of the resulting proof before it is published in its final citable form. Please note that during the production process errors may be discovered which could affect the content, and all legal disclaimers that apply to the journal pertain.
We report no conflict of interest.
References
- 1.Allbritton NL, Meyer T, Stryer L. Range of messenger action of calcium ion and inositol 1, 4, 5-trisphosphate. Science. 1992;258:1812–1812. doi: 10.1126/science.1465619. [DOI] [PubMed] [Google Scholar]
- 2.Berridge MJ. Calcium hypothesis of Alzheimer’s disease. Pflugers Arch., EJP. 2010;459:441–449. doi: 10.1007/s00424-009-0736-1. [DOI] [PubMed] [Google Scholar]
- 3.Berridge MJ, Bootman MD, Lipp P. Calcium-a life and death signal. Nature. 1998;395:645–648. doi: 10.1038/27094. [DOI] [PubMed] [Google Scholar]
- 4.Berridge MJ, Lipp P, Bootman MD. The versatility and universality of calcium signalling. Nature reviews Molecular cell biology. 2000;1:11–21. doi: 10.1038/35036035. [DOI] [PubMed] [Google Scholar]
- 5.Bezprozvanny I. Calcium signaling and neurodegenerative diseases. Trends in molecular medicine. 2009;15:89–100. doi: 10.1016/j.molmed.2009.01.001. [DOI] [PMC free article] [PubMed] [Google Scholar]
- 6.Cao P, Donovan G, Falcke M, Sneyd J. A stochastic model of calcium puffs based on single-channel data. Biophysical journal. 2013;105:1133–1142. doi: 10.1016/j.bpj.2013.07.034. [DOI] [PMC free article] [PubMed] [Google Scholar]
- 7.Cao P, Tan X, Donovan G, Sanderson MJ, Sneyd J. A deterministic model predicts the properties of stochastic calcium oscillations in airway smooth muscle cells. PLoS Comput Biol. 2014;10:e1003783. doi: 10.1371/journal.pcbi.1003783. [DOI] [PMC free article] [PubMed] [Google Scholar]
- 8.De Young GW, Keizer J. A single-pool inositol 1, 4, 5-trisphosphate-receptor-based model for agonist-stimulated oscillations in Ca2+concentration. Proc. Natl. Acad. Sci. USA. 1992;89:9895–9899. doi: 10.1073/pnas.89.20.9895. [DOI] [PMC free article] [PubMed] [Google Scholar]
- 9.Demuro A, Parker I. Imaging the activity and localization of single voltage-gated Ca2+ channels by total internal reflection fluorescence microscopy. Biophysical journal. 2004;86:3250–3259. doi: 10.1016/S0006-3495(04)74373-8. [DOI] [PMC free article] [PubMed] [Google Scholar]
- 10.Demuro A, Parker I. Optical patch-clamping single-channel recording by imaging Ca2+ flux through individual muscle acetylcholine receptor channels. The journal of general physiology. 2005;126:179–192. doi: 10.1085/jgp.200509331. [DOI] [PMC free article] [PubMed] [Google Scholar]
- 11.Demuro A, Parker I, Stutzmann GE. Calcium signaling and amyloid toxicity in Alzheimer’s disease. Journal of Biological Chemistry. 2010;285:12463–12468. doi: 10.1074/jbc.R109.080895. [DOI] [PMC free article] [PubMed] [Google Scholar]
- 12.Donahue BS, Abercrombie R. Free diffusion coefficient of ionic calcium in cytoplasm. Cell calcium. 1987;8:437–448. doi: 10.1016/0143-4160(87)90027-3. [DOI] [PubMed] [Google Scholar]
- 13.Foskett JK, White C, Cheung K-H, Mak D-OD. Inositol trisphosphate receptor Ca2+ release channels. Physiological reviews. 2007;87:593–658. doi: 10.1152/physrev.00035.2006. [DOI] [PMC free article] [PubMed] [Google Scholar]
- 14.Fraiman D, Dawson SP. A model of the IP3 receptor with a luminal calcium binding site: stochastic simulations and analysis. Cell calcium. 2004;35:403–413. doi: 10.1016/j.ceca.2003.10.004. [DOI] [PubMed] [Google Scholar]
- 15.Giacomello M, Drago I, Pizzo P, Pozzan T. Mitochondrial Ca2+ as a key regulator of cell life and death. Cell Death Differ. 2007;14:1267–1274. doi: 10.1038/sj.cdd.4402147. [DOI] [PubMed] [Google Scholar]
- 16.Hodgkin A, Keynes R. Movements of labelled calcium in squid giant axons. The journal of physiology. 1957;138:253. doi: 10.1113/jphysiol.1957.sp005850. [DOI] [PMC free article] [PubMed] [Google Scholar]
- 17.Ionescu L, Cheung K-H, Vais H, Mak D-OD, White C, Foskett JK. Graded recruitment and inactivation of single IP3R receptor Ca2+-release channels: implications for quartal Ca2+ release. J Physiol. 2006;573:645–662. doi: 10.1113/jphysiol.2006.109504. [DOI] [PMC free article] [PubMed] [Google Scholar]
- 18.Ionescu L, White C, Cheung K-H, Shuai J, Parker I, Pearson JE, Foskett JK, Mak D-OD. Mode switching is the major mechanism of ligand regulation of InsP3 receptor calcium release channels. The journal of general physiology. 2007;130:631–645. doi: 10.1085/jgp.200709859. [DOI] [PMC free article] [PubMed] [Google Scholar]
- 19.Le Masson G, Przedborski S, Abbott L. A computational model of motor neuron degeneration. Neuron. 2014;83:975–988. doi: 10.1016/j.neuron.2014.07.001. [DOI] [PMC free article] [PubMed] [Google Scholar]
- 20.Lim D, Fedrizzi L, Tartari M, Zuccato C, Cattaneo E, Brini M, Carafoli E. Calcium homeostasis and mitochondrial dysfunction in striatal neurons of Huntington’s disease. Journal of Biological Chemistry. 2008;283:5780–5789. doi: 10.1074/jbc.M704704200. [DOI] [PubMed] [Google Scholar]
- 21.Lock JT, Parker I, Smith IF. A comparison of fluorescent Ca2+ indicators for imaging local Ca2+ signals in cultured cells. Cell calcium. 2015;58:638–648. doi: 10.1016/j.ceca.2015.10.003. [DOI] [PMC free article] [PubMed] [Google Scholar]
- 22.Mak D-OD, Cheung K-H, Toglia P, Foskett JK, Ullah G. Analyzing and quantifying the gain-of-function enhancement of IP3 receptor gating by familial Alzheimer’s disease causing mutants in presenilins. PloS Comp. Biol. 2015;84:143–152. doi: 10.1371/journal.pcbi.1004529. [DOI] [PMC free article] [PubMed] [Google Scholar]
- 23.Mak D-OD, Pearson JE, Loong KPC, Datta S, Fernández-Mongil M, Foskett JK. Rapid ligand-regulated gating kinetics of single inositol 1, 4, 5-trisphosphate receptor Ca2+ release channels. EMBO reports. 2007;8:1044–1051. doi: 10.1038/sj.embor.7401087. [DOI] [PMC free article] [PubMed] [Google Scholar]
- 24.Mak D-OD, Vais H, Cheung K-H, Foskett JK. Patch-clamp electrophysiology of intracellular Ca2+ channels. Cold Spring Harbor protocols. 2013;2013 doi: 10.1101/pdb.top066217. pdb–top066217. [DOI] [PMC free article] [PubMed] [Google Scholar]
- 25.Sanderson MJ, Smith I, Parker I, Bootman MD. Fluorescence microscopy. Cold Spring Harbor Protocols. 2014;2014:1042–1065. doi: 10.1101/pdb.top071795. [DOI] [PMC free article] [PubMed] [Google Scholar]
- 26.Shuai J, Parker I. Optical single-channel recording by imaging Ca2+ flux through individual ion channels: theoretical considerations and limits to resolution. Cell calcium. 2005;37:283–299. doi: 10.1016/j.ceca.2004.10.008. [DOI] [PubMed] [Google Scholar]
- 27.Shuai J, Pearson JE, Foskett JK, Mak D-OD, Parker I. A kinetic model of single and clustered IP3R receptors in the absence of Ca2+ feedback. Biophysical journal. 2007;93:1151–1162. doi: 10.1529/biophysj.107.108795. [DOI] [PMC free article] [PubMed] [Google Scholar]
- 28.Siekmann I, Wagner LE, Yule D, Crampin EJ, Sneyd J. A kinetic model for type i and ii IP3R accounting for mode changes. Biophysical journal. 2012;103:658–668. doi: 10.1016/j.bpj.2012.07.016. [DOI] [PMC free article] [PubMed] [Google Scholar]
- 29.Smith IF, Parker I. Imaging the quantal substructure of single IP3R channel activity during Ca2+ puffs in intact mammalian cells. Proceedings of the National Academy of Sciences. 2009;106:6404–6409. doi: 10.1073/pnas.0810799106. [DOI] [PMC free article] [PubMed] [Google Scholar]
- 30.Supnet C, Bezprozvanny I. Neuronal calcium signaling, mitochondrial dysfunction, and Alzheimer’s disease. J. Alzheimer’s Disease. 2010;20:487–498. doi: 10.3233/JAD-2010-100306. [DOI] [PMC free article] [PubMed] [Google Scholar]
- 31.Swillens S, Champeil P, Combettes L, Dupont G. Stochastic simulation of a single inositol 1, 4, 5-trisphosphatemsensitive Ca2+ channel reveals repetitive openings during blip-like Ca2+ transients. Cell calcium. 1998;23:291–302. doi: 10.1016/s0143-4160(98)90025-2. [DOI] [PubMed] [Google Scholar]
- 32.Territo P, French S, Balaban R. Simulation of cardiac work transitions, in vitro: effects of simultaneous Ca2+ and ATPase additions on isolated porcine heart mitochondria. Cell calcium. 2001;30:19–27. doi: 10.1054/ceca.2001.0211. [DOI] [PubMed] [Google Scholar]
- 33.Toglia P, Cheung K-H, Mak D-OD, Ullah G. Impaired mitochondrial function due to familial Alzheimer’s disease-causing presenilins mutants via Ca2+ disruptions. Cell calcium. 2016 doi: 10.1016/j.ceca.2016.02.013. [DOI] [PMC free article] [PubMed] [Google Scholar]
- 34.Toglia P, Ullah G. The gain-of-function enhancement of IP3-receptor channel gating by familial Alzheimer’s disease-linked presenilin mutants increases the open probability of mitochondrial permeability transition pore. Cell calcium. 2016;60:13–24. doi: 10.1016/j.ceca.2016.05.002. [DOI] [PubMed] [Google Scholar]
- 35.Ullah G, Demuro A, Parker I, Pearson JE. Analyzing and modeling the kinetics of amyloid beta pores associated with Alzheimer’s disease pathology. PloS one. 2015;10:e0137357. doi: 10.1371/journal.pone.0137357. [DOI] [PMC free article] [PubMed] [Google Scholar]
- 36.Ullah G, Mak D-OD, Pearson JE. A data-driven model of a modal gated ion channel: The inositol 1, 4, 5-trisphosphate receptor in insect Sf9 cells. J Gen. Physiol. 2012;140:159–173. doi: 10.1085/jgp.201110753. [DOI] [PMC free article] [PubMed] [Google Scholar]
- 37.Ullah G, Parker I, Mak D-OD, Pearson JE. Multi-scale data-driven modeling and observation of calcium puffs. Cell calcium. 2012;52:152–160. doi: 10.1016/j.ceca.2012.04.018. [DOI] [PMC free article] [PubMed] [Google Scholar]
- 38.Ullah G, Ullah A. Mode switching of inositol 1, 4, 5-trisphosphate receptor channel shapes the spatiotemporal scales of Ca2+ signals. Journal of biological physics. 2016;42:507–524. doi: 10.1007/s10867-016-9419-2. [DOI] [PMC free article] [PubMed] [Google Scholar]
- 39.Wagner I, Larry E, Yule DI. Differential regulation of the Ins3P receptor type-1 and-2 single channel properties by Ins3P, Ca2+ and ATP. The Journal of physiology. 2012;590:3245–3259. doi: 10.1113/jphysiol.2012.228320. [DOI] [PMC free article] [PubMed] [Google Scholar]


