

SUMMARY
Clearance of apoptotic cells (ACs) by phagocytes (efferocytosis) prevents post-apoptotic necrosis and dampens inflammation. Defective efferocytosis drives important diseases, including atherosclerosis. For efficient efferocytosis, phagocytes must be able to internalize multiple ACs. We show here that uptake of multiple ACs by macrophages requires dynamin-related protein 1 (Drp1)-mediated mitochondrial fission, which is triggered by AC uptake. When mitochondrial fission is disabled, AC-induced increase in cytosolic calcium is blunted owing to mitochondrial calcium sequestration, and calcium-dependent phagosome formation around secondarily encountered ACs is impaired. These defects can be corrected by silencing the mitochondrial calcium uniporter (MCU). Mice lacking myeloid Drp1 showed defective efferocytosis and its pathologic consequences in the thymus after dexamethasone treatment and in advanced atherosclerotic lesions in fat-fed Ldlr−/ − mice. Thus, mitochondrial fission in response to AC uptake is a critical process that enables macrophages to clear multiple ACs and to avoid the pathologic consequences of defective efferocytosis in vivo.
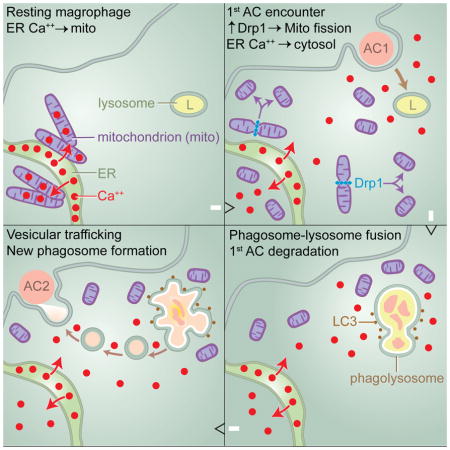
Graphical Abstract
INTRODUCTION
Phagocytic clearance of apoptotic cells (ACs), or efferocytosis, is a critical process in normal physiology that prevents necrosis of dead cells and triggers anti-inflammatory and pro-resolving responses in phagocytes (Vandivier et al., 2006; Arandjelovic and Ravichandran, 2015). Efferocytosis can become defective in certain pathologic settings, e.g., autoimmune disease and atherosclerosis, where it promotes disease progression (Vandivier et al., 2006; Arandjelovic and Ravichandran, 2015; Khanna et al., 2010; Thorp and Tabas, 2009). Efferocytosis involves recognition of ACs by cell receptors and then phagocytosis and phagolysosomal digestion of the ACs (Hochreiter-Hufford and Ravichandran, 2013). While there has been great progress in understanding these processes, much less is known about the mechanisms that enable phagocytes to internalize multiple ACs over relatively short periods of time. In settings where cell death is rampant, the high ratio of ACs to phagocytes demands multiple, rapid AC uptake by individual phagocytes, which raises two key questions: (1) what regulates cellular membrane recycling to allow new phagosome formation after a previous round of phagocytosis (Aderem, 2002); and (2) how do phagocytes process the metabolic cargo of multiple ACs (Han and Ravichandran, 2011).
While investigating these areas, we made the surprising observation that AC uptake by macrophages triggers a mitochondrial fission response that was associated with and dependent on a marked increase in the mitochondrial fission protein dynamin-related protein 1 (Drp1) (Chan, 2012; Ishihara et al., 2009). Most importantly, when mitochondrial fission was prevented in macrophages exposed to a first round of ACs, subsequent AC uptake was compromised. Moreover, mice with compromised mitochondrial fission in myeloid cells showed evidence of defective efferocytosis and its pathologic consequences in vivo. Mechanistic studies revealed that mitochondrial fission enables efficient AC corpse degradation in phagolysosomes as well as calcium-dependent vesicular trafficking, both of which are required for continued AC phagocytosis. These studies reveal a critical series of intracellular reactions during efferocytosis that facilitates multiple AC uptake and demonstrate the importance of this process in clearance of ACs in vivo.
RESULTS
Interaction of Macrophages with Apoptotic Cells Leads to an Increase in Drp1-Mediated Mitochondrial Fission
When macrophages are incubated with ACs, some of the macrophages take up the ACs (AC+) and some do not (AC−). We observed that the mitochondria were shorter and more fragmented in AC+ vs. AC− macrophages (Figure 1A), which was accompanied by an increase in the mitochondrial fission protein Drp1 both in the cytoplasm and mitochondria (Figure 1B–C). The source of the increased Drp1 was the phagocyte, not the AC, because the Drp1 increase was similar when phagocytes were exposed to Drp1-deficient ACs vs. control ACs, i.e., apoptotic macrophages from Drp1fl/fl Lysmcre+/− (Cre+/−) vs. control Cre−/− mice (Ishihara et al., 2009) (Figure S1A; Figure S1B–E confirms Drp1 deficiency in Cre+/− macrophages). The increase in phagocyte Drp1 was not blocked by actinomycin D but was inhibited by cycloheximide, indicating post-transcriptional regulation (Figure S1F). To determine whether Drp1 was causally important in AC-induced mitochondrial fission, we treated macrophages with MDIVI-1, a selective inhibitor of Drp1 (Cassidy-Stone et al., 2008), or used macrophages from the aforementioned Cre+/− mice. In both cases, mitochondrial length was increased and, most importantly, not decreased in response to AC uptake (Figure 1D). Thus, efferocytosis triggers Drp1-induced mitochondrial fission in macrophages exposed to ACs.
Figure 1. Interaction of Macrophages with Apoptotic Cells Triggers Drp1- Mediated Mitochondrial Fission.

(A) Bone marrow-derived macrophages were incubated with PKH67-labeled apoptotic Jurkat cells (green) and MitoTracker Red FM (red) for 45 minutes at a 5:1 AC:macrophage ratio. Macrophages that had or had not engulfed an AC (AC+, AC−) were visualized by confocal microscopy. Asterisks show examples of elongated mitochondria, and arrowheads show clusters of small mitochondria. Bar, 2 μm. Mean mitochondrial length was measured in 0.5 μm z-sections (n=4 biologic replicates with > 10 cells quantified per group).
(B) Immunoblot of Drp1 and β-actin of lysates of macrophages incubated without or with ACs for 45 minutes. The bar graph shows densitometric quantification of immunoblots normalized to β-actin (n=3 biological replicates).
(C) Immunoblot of the indicated proteins in mitochondrial and cytosolic fractions of macrophages incubated without or with ACs for 45 minutes. The bar graph shows densitometric quantification of Drp1 expression in the mitochondrial fraction normalized to VDAC1 (n=3 biological replicates).
(D) Macrophages from control Drp1fl/fl Lysmcre−/− mice (Cre−/−), either untreated or treated with 10 μM MDIVI-1, and macrophages from Drp1fl/fl Lysmcre+/− mice (Cre+/−) mice were incubated with PKH67-labeled ACs (green) and MitoTracker Red FM (red) and analyzed as in (A) (n=3 with > 30 cells quantified per group). Asterisks show examples of elongated mitochondria, and arrowheads show clusters of small mitochondria. Bar, 2 μm.
For all panels, values are mean + S.E.M; *,#p < 0.05; n.s., not significant. For panel D, * indicates difference from the two other AC− groups, and # indicates difference from AC− Veh Cre−/− and from the two other AC+ groups.
Mitochondrial Fission-Defective Macrophages Have a Defect in High-Burden Efferocytosis
To explore the functional significance of these findings, we compared the interaction of Cre−/− and Cre+/− macrophages with Calcein AM-labeled ACs. At relatively early time points or low AC:macrophage ratios, AC association with Cre−/− and Cre+/− macrophages appeared similar, but this was decreased in Cre+/− macrophages at longer time points or higher AC:macrophage ratios (Figure 2A). These results were confirmed by flow cytometry using PKH67-labeled macrophages and CypHer5E-labeled ACs, which become fluorescent in acidic phagolysosomes (Figure S1G). Similar defects in efferocytosis were seen in MDIVI-1-treated mouse macrophages (Figure S1H) and in human monocyte-derived macrophages transfected with Drp1 siRNA (Figure 2B). Loss of Drp1 did not affect macrophage differentiation or polarization in response to LPS + IFNγ or IL-4 (Figure S2A–C).
Figure 2. Drp1-Deficient Macrophages Have a Defect in High-Burden Efferocytosis.

(A) Cre−/− or Cre+/− macrophages were incubated with Calcein AM-labeled ACs at various times at a 10:1 AC:macrophage ratio or at various ratios for 1 hour. Efferocytosis was quantified as the total percent of macrophages that were positive for PKH67-labeled ACs (n=3 biological replicates, using the average of technical duplicates for each).
(B) Similar to (A), except human monocyte-derived macrophages transfected with either scrambled RNA (ScrRNA) or Drp1 siRNA were used. Immunoblot for Drp1 is shown.
(C) Vehicle- and MDIVI-1-treated Cre−/−macrophages or vehicle-treated Cre+/− macrophages were incubated with PKH26-labeled ACs at a ratio of 5:1 ACs:macrophages for 45 minutes. The ACs were removed, and then, after a 120-minute interval, the macrophages were incubated with PKH67-labeled ACs at a ratio of 5:1 for 45 minutes. The unengulfed ACs were removed, and the percent PKH26+ PKH67+ macrophages of total macrophages was analyzed by epifluorescence microscopy (n=4 biological replicates).
(D) As in (C), except the macrophages were treated with 5 μM cytochalasin D 30 minutes before the addition of the 2nd AC (n=3 biological replicates, using the average of technical duplicates for each).
For all panels, values are mean + S.E.M.; *p < 0.05; n.s., not significant.
Based on these data, we hypothesized that mitochondrial fission enabled macrophages to internalize multiple ACs ("high-burden efferocytosis"). To test this hypothesis, we conducted a two-stage efferocytosis experiment in which macrophages were first incubated for 45 mins with ACs labeled with PKH26 and then, after AC removal and a 120-minute interval, incubated with a second round of ACs labeled with PKH67. Consistent with the hypothesis, the percentage of macrophages that had internalized both labels was significantly less in MDIVI-1-treated or Cre+/− macrophages than in control cells (Figure 2C). As designed, MDIVI-1 increased mitochondrial length in macrophages with 2 ACs to a level approaching that of macrophages with no ACs (Figure S2D). Note that MDIVI-1 did not further decrease 2nd AC uptake when added to Cre+/− macrophages (Figure S2E), as expected for an on-target effect of the inhibitor.
We next asked whether the defect in 2nd AC uptake was due to a decrease in AC binding or AC internalization. For this purpose, the actin polymerization inhibitor cytochalasin D was added after the first round to block 2nd AC internalization, i.e., to assay 2nd AC binding. The data show that 2nd AC binding was similar between Cre−/− and Cre+/− macrophages (Figure 2D), indicating that the decrease in 2nd AC efferocytosis in Drp1-deficient macrophages was due to a defect in AC internalization.
To verify that the above data were due to effects on mitochondrial fission rather than some other effect of Drp1, we silenced mitochondrial fission factor (Mff) (Otera et al., 2010) and confirmed that it impaired mitochondrial fission in AC+ macrophages (Figure S3A). As with Drp1 depletion, Mff silencing decreased 2nd AC uptake (Figure S3B). Further, silencing the fusion mediator Mfn1 resulted in hyper-fragmented mitochondria and enhanced efferocytosis (Figure S3C–E) at a 10:1 AC:macrophage ratio. These combined data indicate that mitochondrial fission per se enables efficient high-burden efferocytosis.
Mitochondrial Fission-Defective Macrophages Have a Defect in Phagosome Sealing
Although efferocytosis of a first-encountered AC appeared normal in mitochondrial fission-deficient macrophages, a subtle defect in phagosomal sealing could have escaped detection. To test for this possibility, we incubated WT or Drp1-deficient macrophages with ACs that were both PKH67-labeled and biotinylated. After 15, 30, or 60 minutes, unbound ACs were removed and the macrophages were fixed. Alexa Fluor 568-labeled streptavidin (SA-AF568) was then added to the cells, and macrophage AF568 labeling was quantified. This method distinguishes fully internalized from partially engulfed ACs, as fully engulfed ACs are not accessible to SA-AF568. We found that there was a higher fraction of AF568-labeled ACs in Drp1-deficient (Cre+/−) vs. Cre−/− control macrophages at 30 and 60 minutes, indicating a defect in phagosome sealing (Figure 3A). Similar results were found in macrophages in which Mff was silenced (Figure S3F).
Figure 3. Drp1-Deficient Macrophages Have a Defect in Phagosome Sealing.

(A) Cre−/− and Cre+/− macrophages were incubated with biotinylated and PKH67-labeled ACs at a ratio of 10:1 ACs:macrophages for either 15, 30, or 60 minutes. Unengulfed ACs were then removed. The cells were then fixed in 2% paraformaldehyde, incubated with streptavidin-Alexa fluor 568 (SA-AF568) for 30 minutes, and viewed by fluorescence microscopy. Representative PKH67, AF568, and merge images are shown; the 4th column shows a brightfield image taken from the merge series. Bar, 20 μm. The percent of PKH67+ macrophages not stained (sealed) or stained (unsealed) with AF568 was quantified (n=3 biological replicates, using the average of technical duplicates for each).
(B) Cre−/− and Cre+/− macrophages were incubated with CypHer5E and Hoechst-labeled apoptotic PMNs for 30 minutes at 4°C to allow AC bi nding but not internalization. Unbound ACs were removed by rinsing, fresh warm medium was added, and time-lapse fluorescence microscopic imaging was conducted. The graph shows the average time for the CypHer5E fluorescence to appear (n=4 sets of analyses).
(C) Cre−/− and Cre+/− macrophages were incubated for 45 minutes with PKH67-labeled ACs at a ratio of 10:1 ACs:macrophages. Unengulfed ACs were removed, and then, after a 120-minute interval, macrophages were incubated with a second round of biotinylated and fluorescently labeled ACs for either 15, 30, or 60 minutes, followed by analysis for sealing as in (A).
For all panels, values are mean + S.E.M.; *p < 0.05.
We reasoned that a defect in phagosome sealing would cause a delay in acidification of AC-containing phagosomes (Lu and Zhou, 2012). To test this prediction, we incubated macrophages with CypHer5E-labeled ACs and then recorded the time interval from initial AC-macrophage interaction to CypHer5E-positivity using live-cell fluorescence microscopic imaging. The data show a clear defect in time to CypHer5E-positivity in Cre+/− vs. Cre−/− macrophages (Figures 3B and S3G), consistent with a delay in acidification of AC-containing phagosomes. In contrast, there was no defect in lysosomal acidification in Cre+/− macrophages (Figure S3H). These combined data indicate that Drp1-deficient macrophages have a defect in phagosome sealing around newly encountered ACs.
To investigate the potential relevance of this finding to other types of phagocytosis, we assayed phagosome sealing in macrophages exposed to 10-μm latex beads, which are similar in size to the apoptotic Jurkat cells used in our assays. Cre+/− macrophages showed a defect in phagosome sealing around these latex beads, similar to the situation with ACs (Figure S3I, graph 1). Phagocytosis processes can differ dependent on size of cargo (Kubota et al., 1983). We therefore examined phagocytic sealing in macrophages exposed to 4-μm latex beads and similarly sized IgG-opsonized sheep red blood cells (IgG-sRBCs). As control for the IgG-sRBCs, we also tested larger sized IgG-coated Jurkat cells. In contrast to what we saw with 10-μm beads, and now shown as well for IgG-coated Jurkat cells (Figure S3I, graph 4), plasma membrane sealing around the smaller beads and sRBCs was similar in Cre−/− and Cre+/− macrophages (Figure S3I, graphs 2 and 3). Thus, the sealing defect in Drp1-deficient macrophages is specific to larger particles. Finally, to determine whether Cre+/− macrophages have defective sealing around a secondarily encountered AC, we used biotinylated 2nd ACs in the two-stage AC assay described in the previous section. The data show a marked increase in SA-AF568 accessibility in the Cre+/− cells, indicating a sealing defect around the 2nd AC (Figure 3C). In summary, mitochondrial fission is necessary for proper phagosome sealing during efferocytosis. This defect causes a subtle defect in efferocytosis when macrophages interact with a first AC and likely contributes to the more marked defect in efferocytosis when the phagocytes encounter additional ACs, as explained in the following sections.
Drp1-Deficient Macrophages Have a Defect in LC3-Associated Phagocytic Degradation of AC Corpses
We observed that in those Drp1-deficient macrophages that had successfully internalized an AC, there was less fragmentation of the labeled AC corpse compared with control macrophages, suggesting defective corpse degradation. To quantify corpse degradation, we incubated WT and Drp1 KO macrophages for 45 mins with PKH26-labeled ACs. After rinsing away unbound ACs, we then counted the percentage of AC+ macrophages that showed non-fragmented PKH26 staining over the ensuing 3 hours. Confirming our subjective observations, the percent of macrophages with non-fragmented ACs was greater in Cre+/- vs. Cre-/- macrophages (Figure 4A). Moreover, in a time-lapse fluorescence microscopy experiment, we observed that the first time point at which the internalized CypHer5E ACs showed evidence of fragmentation was significantly delayed in Cre+/− vs. Cre−/− macrophages (Figure S4A)
Figure 4. Drp1-Deficient Macrophages Have a Defect in LC3-Associated Phagocytosis and AC Corpse Degradation.

(A) Cre−/− and Cre+/− macrophages were incubated for 45 minutes with CypHer5E labeled ACs. Unengulfed ACs were removed, and the macrophages were incubated for another 3 hours. Cells were fixed with 2% formaldehyde, and AC fragmentation was quantified as the percent of macrophages that showed fragmented CypHer5E fluorescence (n=3 biological replicates, using the average of technical duplicates for each). Bar, 20 μm.
(B) Cre−/− and Cre+/− macrophages were incubated with PKH26-labeled ACs (red) for 45 minutes and then fixed in 4% formaldehyde for 15 minutes, incubated with 50 μg/ml digitonin for 5 minutes, and immunostained for LC3 (green). Some of the cells were viewed by confocal fluorescence microscopy (two examples of 0.5-μm z-step images from each group are shown), and others were detached and analyzed by flow cytometry for membrane-bound LC3 mean fluorescence intensity (MFI) in AC+ macrophages (n=3 biological replicates). Bar, 5 μm; arrowhead in each of the Cre−/− images depicts a ring of LC3 immunostain surrounding an AC-containing phagosome, which was not seen in in any of the z-steps of the Cre+/- images.
(C) Cre−/− and Cre+/− macrophages were incubated for 1 hour with ACs that were labeled with the ROS-sensitive dye, H2DCFDA, or vehicle control. The macrophages were detached and analyzed by flow cytometry for H2DCFDA fluorescence (n=3 biological replicates).
(D-E) Cre−/− and Cre+/− macrophages were incubated for 45 minutes with ACs loaded with the oxidant TBHP (50 μM). Analysis and quantification for membrane-bound LC3 and corpse degradation were conducted as in (B) and (A), respectively (n=3–4 biological replicates).
(F) Two-stage efferocytosis was quantified as in Figure 2C using first-round PKH26-labeled ACs that were loaded with TBHP (n=4 biological replicates).
For all panels, values are mean + S.E.M.; *p < 0.05.
To explain this observation, we considered whether preventing mitochondrial fission leads to defective LC3-associated phagocytosis (LAP), a process by which LC3-II conjugation to phagosomes enables phagosome-lysosome fusion and AC corpse degradation (Martinez et al., 2011; Martinez et al., 2016). To test this idea, Cre−/− and Cre+/− macrophages were incubated with CellVue Claret-labeled ACs for 1 hour. After removal of non-attached ACs, the macrophages were fixed, treated with digitonin to remove non-membrane-bound LC3, and immunostained for LC3. Fluorescence microscopic imaging showed the expected decoration of corpse-containing phagosomes with LC3 in control macrophages (Martinez et al., 2011), while this feature appeared markedly decreased in Drp1-deficient macrophages (Figure 4B, images). Furthermore, Cre+/− macrophages had decreased membrane-bound LC3 as quantified by flow cytometry (Figure 4B, graph). Importantly, Drp1 deficiency did not reduce the number of LC3 punctae in macrophages treated with rapamycin, which induces a different LC3-mediated process, macroautophagy (Blommaart et al., 1995) (Figure S4B).
When macrophages encounter ACs, lysosomal NADPH oxidase-mediated reactive oxygen species (ROS) is elevated, which is necessary for LC3 conjugation to maturing phagosomes, phagolysosomal fusion, and AC corpse degradation (Martinez et al., 2015). To determine whether ROS of AC-containing phagosomes was decreased in Cre+/− macrophages, we incubated Cre−/− and Cre+/− macrophages with ACs labeled with the ROS probe 2’,7’-dichlorofluorescin diacetate (H2DCFDA). Cre+/− macrophages showed a 40% decrease in H2DCFDA fluorescence compared with Cre−/− macrophages (Figure 4C). To determine whether this decrease in ROS was functionally relevant, we increased the ROS in phagosomes in Cre+/− macrophages by incubating the cells with ACs loaded with the oxidant tert-butyl hydroperoxide (TBHP), which restored ROS in Cre+/− macrophages (Figure S4C). This manipulation increased membrane-bound LC3 conjugation, corpse degradation, and high-burden efferocytosis (Figure 4D–F). Thus, the defect in LAP-mediated corpse degradation in Drp1-deficient macrophages can be linked to a defect in phagosomal ROS.
The Defects in Phagosome Sealing and Corpse Degradation in Drp1-Deficient Macrophages Are Linked to MCU-Mediated Mitochondrial Calcium Sequestration
In exploring how a defect in mitochondrial fission might be linked to defective efferocytosis, we first considered that mitochondrial fission was required for sufficient ATP production. However, ATP levels in macrophages were similar in control and Drp1-deficient macrophages under both basal conditions and after the addition of ACs (Figure S4D). We next considered the role of cytoplasmic calcium because (a) cytoplasmic calcium is increased when macrophages encounter ACs, and this process is necessary for efficient AC clearance (Cuttell et al., 2008; Gronski et al., 2009); and (b) in certain settings, cytosolic calcium is decreased by direct transfer of endoplasmic reticulum (ER) calcium to fused mitochondria (de Brito and Scorrano, 2008; Maltecca et al., 2012; Luchsinger et al., 2016). We therefore hypothesized that defective mitochondrial fission causes impairment of AC-induced increase in cytosolic calcium, i.e., via excessive mitochondrial calcium sequestration, which then contributes to defective efferocytosis.
We first determined whether Drp1 deficiency altered cytosolic calcium levels induced by AC exposure. Cre-/− and Cre+/− macrophages were transduced with a lentivirus encoding the cytosolic calcium indicator GCaMP6f (Cyto-GCaMP6f) (Shang et al., 2014), followed by incubation with CellVue Claret-labeled ACs. As expected, GCaMP6f fluorescence remained at basal levels in both Cre−/− and Cre+/− AC− macrophages, but there was a significant decrease in GCaMP6f fluorescence in AC+ Cre−/− Mϕs vs. AC+ Cre+/− Mϕs (Figures 5A and S4E). Conversely, mitochondrial calcium, which was assayed in macrophages transduced the mitochondrial calcium indicator 2x-COX8-GCaMP6f (Mito-GCaMP6f), was higher in AC+ Cre+/− vs. AC+ Cre+/− macrophages (Figures 5B and S4F). Finally, ER calcium was assayed in macrophages transduced with ER-GCaMP6f-150 (de Juan-Sanz et al., 2017). As predicted (Cuttell et al., 2008; Gronski et al., 2009), ACs led to an early decrease in ER calcium. However, the overall pattern was similar between AC+ Cre−/− and Cre+/− macrophages (Figure S4G), which is consistent with Drp1 deficiency causing a change in distribution of ER−released calcium, i.e., mitochondrial vs. cytosol, but not in ER calcium release itself.
Figure 5. Excessive MCU-Mediated Mitochondrial Calcium Sequestration Contributes to the Defects in Phagosome Sealing and LAP-Mediated Corpse Degradation In Drp1-Deficient Macrophages.

(A–B) Cyto-GCaMP6f- or Mito-GCaMP6f-transduced Cre−/− and Cre+/− macrophages were incubated with CellVue Claret-labeled ACs. Confocal microscopy was used to capture time-lapse images every 5 minutes, with measurements beginning when an AC fell into the plane of focus of a macrophage in the case of AC+ cells (t = 0). Data are presented as fold-increase in mean GCaMP6f fluorescence intensity (MFI)/cell divided by MFI/cell at time 0 (n=3 cells for AC- macrophages and n=7–12 cells for AC+ macrophages, with 2 plates of cells examined for each condition).
(C–D) Cre−/− macrophages were incubated with 5 μM BAPTA-AM, or Cre−/− and Cre+/− macrophages were incubated with 2 μM ionomycin (Iono) or vehicle control (Veh). Phagosome sealing was assayed 45 minutes after incubation with ACs as in Figure 3 (n=4 biological replicates).
(E) Cytosolic calcium was assessed using Cyto-GCaMP6f-transduced macrophages as in (A), except the macrophages were also treated with Mcu siRNA or scrambled RNA (ScrRNA) control (n=4–8 cells, with 2 plates of cells examined for each condition). Also shown is an immunoblot of MCU.
(F) Time course of phagosome sealing was conducted as in Figure 3 in Cre−/− and Cre+/− macrophages transfected with scrambled RNA or Mcu siRNA (n=3 biological replicates).
(G) Phagosomal H2DCFDA mean fluorescence intensity (MFI) was quantified by flow cytometry as in Figure 4C in Cre−/− and Cre+/−macrophages transfected with scrambled RNA or Mcu siRNA (n=3 biological replicates).
(H–J) Cre−/− and Cre+/− macrophages transfected with scrambled RNA or Mcu siRNA were assayed for membrane-bound LC3 MFI as in Figure 4C; the percentage of macrophages with non-fragmented ACs as in Figure 4A; and two-stage efferocytosis as in Figure 2C (n=3–4 biological replicates).
For all panels, values are mean ± S.E.M. For A, *p < 0.05 for the AC+ Cre−/− group relative to the other 3 groups. For B, *p < 0.05 for the AC+ Cre+/− group relative to the other 3 groups. For E, *p < 0.05 for the scrambled RNA Cre−/− groups relative to the scrambled RNA Cre+/− group, and #p < 0.05 for the Mcu siRNA Cre+/− group relative to the scrambled RNA Cre+/− group. For panels C and G-J, *p < 0.05. For panel D, values marked by different symbols are p < 0.05 relative to each other and to the Cre−/− value. For panel F, values marked by different symbols are p < 0.05 relative to each other and to the Cre−/− value within each time group.
Because calcium facilitates vesicular membrane transport from lysosomes to developing phagosomes (Czibener et al., 2006), a defect in this process could contribute to the phagosome sealing defect and its consequences in Drp1-deficient macrophages. In support of this idea, we found that the calcium chelator BAPTA-AM reduced plasma membrane sealing and membrane-bound LC3 (LAP) in Cre−/− macrophages (Figures 5C and S5A). Conversely, adding the calcium ionophore ionomycin to Cre+/− macrophages restored plasma membrane sealing and membrane-bound LC3 to the control levels (Figures 5D and S5B).
The uptake of ER calcium by mitochondria is mediated by the mitochondrial calcium uniporter MCU (Drago et al., 2012). We therefore asked whether silencing of MCU could prevent the phagosome sealing defect observed in Cre+/− macrophages. We found that transfecting Cre+/− macrophages with siRNA targeting MCU, which resulted in a marked decrease in MCU protein, partially restored both AC-induced cytosolic calcium levels and phagosome sealing (Figure 5E–F). Note that loss of Drp1 did not increase MCU expression (Figure S5C). Furthermore, MCU silencing was unable to restore AC-induced mitochondrial fission in Cre+/− macrophages (Figure S5D), indicating that MCU functions downstream of fission. These data suggest that preventing mitochondrial fission lowers AC-induced cytosolic calcium increase owing to MCU-mediated mitochondrial calcium sequestration. This impairment in cytosolic calcium response then contributes to defective phagosome sealing around the AC.
Finally, we questioned whether the MCU-mediated blunting of AC-induced cytosolic calcium increase in AC+ Drp1-deficient macrophages was linked to the defects in phagolysosomal ROS, LAP-mediated corpse degradation, and high-burden efferocytosis. With regard to ROS, a previous study showed that mitochondrial calcium sequestration decreased activation of the enzyme that generates lysosomal ROS, NADPH oxidase (Dikalov et al., 2012). We found that silencing MCU in Cre+/− macrophages restored phagolysosomal ROS, membrane-bound LC3, AC fragmentation, and 2nd AC uptake to levels approaching those in Cre−/− macrophages (Figure 5G–J). Thus, MCU-mediated mitochondrial calcium sequestration in Drp1-deficient macrophages plays a central role in defective efferocytosis in these cells.
The Decrease in AC-Induced Increment in Cytosolic Calcium in Drp1-Deficient Macrophages Causes a Defect in the Translocation of Intracellular Membranes to the Cell Surface
We reasoned that defective calcium regulation in fission-defective macrophages might not only impair vesicle trafficking-mediated sealing around a 1st AC but also limit the recycling of phagolysosomal membranes to the cell-surface for new phagosome formation around a subsequently encountered AC (Muller et al., 1983). To address this hypothesis, we determined whether there was a defect in intracellular membrane trafficking to the cell surface in Cre+/− macrophages that had internalized a first AC. We conducted time-lapse confocal microscopy of macrophages that were first incubated for 60 mins with the amphiphilic styryl fluorescent dye FM1-84 to label endocytic membranes (Ryan et al., 1996) and then incubated with CypHer5E-labeled ACs. Because FM1-84 rapidly desorbs from membranes, delivery of labeled membranes back to the plasma membrane results in loss of fluorescence, which can be measured as the rate and extent of fluorescence decay (Ryan et al., 1996). In view of our previous finding that Cre+/− macrophages show delayed acidification, we synchronized our measurements such that time 0 was the appearance of the CypHer5E signal for each individual Cre−/− and Cre+/− macrophage.
As an initial observation, we found that much of the FM1-84 label co-localized with the AC-containing phagosome, which likely reflects intracellular transfer of label from endocytic recycling membranes to the membranes of the newly internalized phagosome and its AC content. In Cre−/− macrophages that did not internalize an AC, the overall intensity and pattern of the FM1-84 label did not change over the 24-minute observation period (Figure 6A, upper left set of images and black line in graph). In contrast, Cre−/− macrophages that had internalized an AC showed somewhat diminished FM1-84 labeling after 24 minutes, reflecting transport to the plasma membrane (Ryan et al., 1996) (Figure 6A, upper right set of images and blue line in graph). Most importantly, while the overall FM1-84 labeling pattern at time 0 in Cre+/- macrophages appeared similar to that in Cre−/− macrophages, the intensity and pattern of the label did not decrease over time in the Cre+/− cells (Figure 6A, lower left set of images and red line in graph). Moreover, when MCU was silenced in Cre+/− macrophages to correct the defect in cytosolic calcium, the loss of FM1-84 label now equaled that in Cre−/− macrophages (Figure 6A, lower right set of images and green line in graph). These combined data suggest that Drp1-deficient macrophages have a defect in recycling of corpse-containing phagolysosomal membranes owing to mitochondrial sequestration of calcium.
Figure 6. Defects in Intracellular Membrane Transport to the Cell Surface and in AC Corpse Degradation Contribute to Defective Efferocytosis in Drp1-Deficient Macrophages.

(A) FM1-84-labeled Cre−/− and Cre+/− macrophages were transfected with scrambled RNA or Mcu siRNA and then incubated with CypHer5E-labeled ACs. Confocal microscopy was used to capture time-lapse images, with measurements beginning when the macrophages became CypHer5E-positive (t = 0). FM1-84 fluorescence was measured every 1.5 minutes. An example of a macrophage that had not taken up an AC is shown in the upper left set of images (black line in the graph). Bar, 5 μm. Values in the graph reflect fold change in FM1-84 fluorescence compared with t = 0. Values are mean + S.E.M., *p < 0.05 for Cre+/- siMcu and Cre−/− Scr vs. both t=0 and the other 2 groups; #p < 0.05 for Cre−/− Scr vs. t=0 (two-way ANOVA; n>10 cells counted per group in biological duplicates).
(B) WT macrophages were treated with 1 μM bafilomycin (Baf) or vehicle control (Veh) and then incubated for 1 hour with PKH67-labeled AC. The percent of macrophages with non-fragmented ACs was quantified as in Figure 4A (n=3 biological replicates, using the average of technical duplicates for each).
(C) Macrophages similar to those in (B) were assayed for sealing around a second-encountered AC as in Figure 3C (n=3 technical replicates).
(D) WT macrophages were treated with bafilomycin as above, 5 μM cytochalasin D, or vehicle control and then assayed for the uptake of PKH26-labeled ACs at the indicated time points (n=3 technical replicates).
(E) A two-stage efferocytosis assay was conducted as in Figure 2C using either PKH67-labeled ACs or 6-μm phosphatidylserine (PS)-coated beads in the first round and ACs or beads in the second rounds, as indicated (n=4 biological replicates). Bead uptake was assessed by phase microscopy.
For all panels, values are mean + S.E.M.; *p < 0.05.
Degradation of Phagolysosomal Cargo is Necessary for Efficient Uptake of Subsequently Encountered ACs
We questioned whether there was a link between impaired AC corpse degradation and defective high-burden efferocytosis in Drp1-deficient macrophages. We began by asking whether inhibiting AC corpse degradation in Cre−/− macrophages using the lysosomal vacuolar ATPase inhibitor bafilomycin (Yoshimori et al., 1991) could mimic the efferocytosis defects seen in Cre+/− macrophages. As designed, bafilomycin-treated macrophages had a defect in AC corpse degradation (Figure 6B) without affecting mitochondrial length (Figure S5E). Next, using the two-step sealing experiment described previously, we found that bafilomycin-treated WT macrophages showed a defects in phagosome sealing around 2nd ACs (Figure 6C) but not around 1st ACs (Figure S5F).Moreover, bafilomycin led to a decrease in efferocytosis at relatively late AC-incubation time points but not at the earliest time point, indicative of a defect in high-burden efferocytosis (Figure 6D, dashed and dotted lines). For comparison, we treated another set of macrophages with the actin inhibitor cytochalasin D, which is a general inhibitor of phagocytosis. In contrast to the situation with bafilomycin, cytochalasin D-treated macrophages had decreased efferocytosis at all time points (Figure 6D, solid line). Thus, inhibiting lysosomal degradation is sufficient for causing defects in phagosome sealing around a second-encountered AC and high-burden efferocytosis.
The hypothesis further predicts that WT macrophages would show a defect in high-burden efferocytosis if they were first exposed to phagocytic cargo that cannot be degraded. For this purpose, we used the two-stage uptake assay to compare the typical protocol, in which ACs are used in both stages (AC→AC), with that in which non-degradable 10-μm phosphatidylserine (PS)-coated latex beads were used in the first stage (bead→AC). We also included an AC→bead sequence, predicting that degradation of the first-encountered AC would enable secondary bead uptake. Compared with WT macrophages subjected to the AC→AC or AC→bead protocols, those subjected to the bead→AC protocol showed decreased uptake of the 2nd phagocytic substrate (Figure 6E). These combined data indicate that the AC corpse degradation defect in Drp1-deficient macrophages plays an important role in impaired uptake of a 2nd AC.
Based on the combined in vitro data, we propose the following model in macrophages exposed to ACs (Figure S5G and graphical abstract): Drp1-mediated mitochondrial fission, by preventing excessive MCU-mediated calcium sequestration, enables AC-induced increase in cytosolic calcium. This increase in calcium promotes initial phagosome sealing and ROS generation, leading to LAP-mediated phagolysosomal AC degradation. Corpse degradation and calcium-mediated vesicular trafficking then enables efficient delivery of membranes to phagosomes developing around a subsequently encountered AC, enabling efficient high-burden efferocytosis.
Mice with Defective Mitochondrial Fission in Myeloid Cells Show Impaired Efferocytosis in Vivo
To explore the role of mitochondrial fission in efferocytosis in vivo, we first investigated efferocytosis in the thymuses of Cre−/− and Cre+/− mice treated with dexamethasone, which induces thymocyte apoptosis (Park et al., 2011). As predicted, thymus size, weight, and cellularity were decreased in control Cre−/− mice after dexamethasone treatment owing to the coupled processes of thymocyte apoptosis and phagocytic clearance of dead cells (Park et al., 2011), but this was not observed in the thymuses of Cre+/− mice (Figures S6A and 7A–B). Consistent with these data, there was an increase in the number of TUNEL-positive (dead) cells in Cre+/− thymuses (Figure 7C). To assess efferocytosis, thymus sections were assayed by immunofluorescence microscopy for TUNEL+ cells (ACs) that were either associated with F4/80+ macrophages as a result of efferocytosis or "free" of macrophages (Thorp et al., 2008). The data show that the free:associated AC ratio was higher in the Cre+/− thymuses (Figure 7D), indicative of defective efferocytosis in this cohort. Note that Cre−/− and Cre+/− thymocytes were equally susceptible to dexamethasone-induced apoptosis in vitro (Figure S6B). In the context that efferocytosis suppresses inflammation (Vandivier et al., 2006; Arandjelovic and Ravichandran, 2015; Rothlin et al., 2007), we found that the mRNAs encoding TNFα, IFNγ, and IL-1β as well as macrophage content were higher in the thymuses of Cre+/− mice (Figure S6C–D).
Figure 7. Mice with Myeloid Drp1 Deficiency or Drp1 Inhibition Show Impaired Efferocytosis in Vivo.

(A–C) The thymuses from the two cohorts were weighed and assayed for total and TUNEL+ cells by flow cytometry (n=4 mice per group).
(D) Thymus sections were stained with TUNEL and F4/80 and then quantified for the ratio of free ACs:macrophage-associated ACs (n=4 per group). Representative images are shown, with some of the free TUNEL+ cells indicated by arrowheads; arrows in upper image depict TUNEL+ cells associated with macrophages. Bar, 10 μm.
(E–H) Irradiated wildtype (WT) CD1 mice were transplanted with bone marrow from WT or Mcu−/− CD1 mice. After 6 weeks, the mice were injected i.p. three times at 12-hour intervals with 20 mg/kg MDIVI-1 or vehicle control and then treated with dexamethasone. After 18 hours, the mice were sacrificed, and the thymuses were assayed for weight, cellularity, apoptotic cells, and efferocytosis as in panels A–D (n=5 mice per group).
(I–K) Drp1f/fl Lysmcre+/− (Cre−/−) and Drp1f/fl Lysmcre+/− (Cre+/−) mice were crossed onto the Ldlr−/− background and fed a high-fat Western-type diet (WD) for 12 weeks. Aortic root cross-sections were quantified necrotic area, TUNEL+ macrophages, and ratio of free ACs:macrophage-associated ACs (n=10 mice per group). Arrows in panel K show ACs. Bars, 100 μm for I and 10 μm for K.
For all panels, values are mean + S.E.M., *p < 0.05.
We next determined whether macrophage MCU deficiency could correct the efferocytosis defect in Drp1-inhibited mice. Mice transplanted with bone marrow from Mcu−/− mice or WT mice (Figure S6E) were treated with either PBS or MDIVI-1 and then challenged with dexamethasone. As designed, MDIVI-1 treatment increased mitochondrial length in thymic macrophages (Figure S6F), and this was accompanied by thymus weight loss, increases in thymus cellularity and TUNEL+ cells, and defective thymus efferocytosis (Figure 7F–I, WT donor data). Note that treatment of thymocytes in vitro with MDIVI-1 did not affect apoptosis either under basal conditions or in the presence of dexamethasone (Figure S6G). Most importantly, these thymus changes in MDIVI-1-treated mice were prevented by deletion of myeloid MCU (Figure 7F–I, Mcu−/− donor data). Thus, disruption of the physiologic mitochondrial fission response impairs efferocytosis in vivo, and the Mcu−/− data suggest that the mitochondrial calcium sequestration mechanism revealed by the in vitro studies is relevant in vivo.
Atherosclerosis represents a more complex and pathophysiologically important scenario where macrophage efferocytosis is critically required to clear lesional dead cells and thereby limit the accumulation of cells that undergo post-apoptotic necrosis. As plaques progress, efferocytosis becomes defective, which promotes the formation of clinically dangerous necrotic plaques (Thorp and Tabas, 2009; Linton et al., 2016). To study the consequences of defective macrophage mitochondrial fission in this setting, Drp1f/fl Lysmcre+/− (Cre−/−) and Drp1f/fl Lysmcre+/− (Cre+/−) mice were crossed onto the Ldlr−/− background and fed a high-fat Western-type diet (WD) for 12 weeks to induce advanced atherosclerosis. As expected, Cre+/− mice do not show a decrease in Drp1 expression in a type of non-myeloid vascular cell, aortic smooth muscle cells (Figure S7A). Body weight, fasting blood glucose, plasma cholesterol, triglyceride levels, and plasma lipoprotein profile were similar between the two groups of mice (Figure S7B–F). Most importantly, the lesions of the Cre+/- mice showed significant increases in key features predicted by the hypothesis, namely, necrotic core size, lesional apoptotic cell content, and free AC:macrophage-associated AC ratio, i.e., defective efferocytosis (Figure 7I–K). The increase in plaque necrosis was relatively specific: while necrotic area was >3-fold higher in the Cre+/− vs. Cre−/− cohort, overall lesion area was only ~20% higher, and there was no significant difference in lesional macrophages between the 2 cohorts (Figure S7G). Moreover, while in theory the lesional findings could be attributable to increased susceptibility of Drp1-deficient macrophages to apoptosis, WT and Drp1-deficient macrophages showed a similar apoptotic response in vitro to two atherosclerosis-relevant apoptosis inducers, oxidized LDL and 7-ketocholesterol (Figure S7H). These atherosclerosis data further show that Drp1-deficient myeloid cells have a defect in efferocytosis in vivo in a manner that has substantial pathologic consequences.
DISCUSSION
Efferocytosis is a critical process in maintaining normal tissue homeostasis, and defects in efferocytosis drive a number of widespread chronic inflammatory diseases (Vandivier et al., 2006; Arandjelovic and Ravichandran, 2015; Khanna et al., 2010; Thorp and Tabas, 2009). As shown here and elsewhere (Park et al., 2011), individual phagocytes must be able to ingest multiple ACs for proper functioning of efferocytosis in vivo. We and others have reasoned that precise regulatory mechanisms are needed during efferocytosis to avoid accumulation of undegraded ACs, to guard against excessive metabolic load, and to ensure proper recycling of membranes to the cell surface to enable repetitive cycles of phagocytosis. The data here have revealed a number of processes during efferocytosis that help shed light on these issues. First, macrophages undergo Drp1-dependent mitochondrial fission when encountering ACs, and when this response is blocked, there is a defect in the ability to phagocytose multiple ACs. Second, when mitochondrial fission is disabled, the normal AC-induced increase in cytosolic calcium is blunted, and vesicle membrane-mediated phagosome formation around secondarily encountered ACs is impaired. The calcium defect is associated with an increase in mitochondrial calcium and can be corrected by silencing MCU, suggesting that excessive mitochondrial calcium sequestration is a key culprit in fission-defective macrophages. Third, fission-deficient myeloid cells have a reduced capacity for efferocytosis in vivo, including in the critically important setting of advanced atherosclerosis.
Links between calcium and efferocytosis have been suggested by previous studies (Cuttell et al., 2008; Williams et al., 2013), and our data show that mitochondrial fission plays an important role in this calcium response. As demonstrated previously, fissioned mitochondria have a decreased capacity to become tethered to the ER and to sequester ER-derived calcium, which enables increased calcium levels in the cytoplasm (Maltecca et al., 2012). Although the role of mitochondria in buffering cellular cytosolic calcium has been debated (Williams et al., 2013), the relevance to efferocytosis is supported here by cytosolic and mitochondrial calcium data; causation experiments using siMcu, BAPTA, and ionomycin; and the known role of cytosolic calcium in phagosome formation. Nonetheless, it is possible that other MCU/calcium-mediated mitochondrial processes are also involved, i.e., in addition to calcium sequestration. It is also possible that store-operated calcium entry (SOCE) contributes to the cytosolic calcium response in macrophages exposed to ACs (Cuttell et al., 2008; Gronski et al., 2009). Indeed, the fact that ER calcium levels return to baseline at times after AC exposure when cytosolic (Cre−/−) or mitochondrial (Cre+/−) calcium levels are still elevated (Figures S4G and 5A–B) may indicate a secondary SOCE response.
A question arising from our findings is how the first round of apoptotic cell uptake in macrophages increases Drp1. Drp1 expression rapidly increases after ACs are added to macrophages, and this response is not associated with an increase in Drp1 mRNA. Furthermore, our studies using cycloheximide and actinomycin D suggest that AC-engagement may increase the translation of pre-existing Drp1 mRNA (Park et al., 2015) and/or prevent the turnover of Drp1 protein (Zunino et al., 2009). Drp1 activity can also be regulated by phosphorylation (Chan, 2012; Ishihara et al., 2009), but preliminary data thus far suggest that this mode of regulation does not play a major role in AC-induced mitochondrial fission.
While a number of diseases are driven by defective efferocytosis, advanced atherosclerosis is a particularly important example, as atherothrombotic cardiovascular disease is the leading cause of death in the industrialized world. There is now convincing evidence that efferocytosis is defective in clinically dangerous human plaques, and the consequences of this defect. i.e., plaque necrosis and induced inflammation, are critical in promoting plaque disruption and acute vascular thrombosis (Schrijvers et al., 2005; Thorp and Tabas, 2009; Linton et al., 2016). Impaired efferocytosis in advanced lesions almost certainly has multiple etiologies. Two plausible hypotheses that have been put forward recently, with supporting data in human plaques, include persistent expression of the "don't-eat-me" factor CD47 on lesional ACs (Kojima et al., 2016) and inflammation-induced cleavage of the macrophage efferocytosis receptor MerTK (Garbin et al., 2013; Cai et al., 2017). While future studies will be needed to determine whether the mitochondrial fission response becomes impaired in advanced lesional macrophages or in other pathologic settings characterized and driven by defective efferocytosis, the findings in this report support the larger concept that any process that specifically compromises the ability of macrophages to ingest multiple dead cells will likely result in dire pathologic consequences.
CONTACT FOR REAGENT AND RESOURCE SHARING
Further information and requests for resources and reagents should be directed to and will be fulfilled by the Lead Contact, Dr. Ira Tabas (iat1@cumc.columbia.edu). An MTA was obtained for the transfer of Mcu−/− mice.
EXPERIMENTAL MODEL AND SUBJECT DETAILS
Cell Lines
Jurkat (human T lymphocytes), L-929 (mouse fibroblasts), and embryonic fibroblast (mouse) cells were maintained in Dulbecco’s modified Eagle’s medium (DMEM) supplemented with 10% (vol/vol) heat-inactivated Fetal Bovine Serum (HI-FBS), and 10 U/mL Penicillin and 100 μg/mL Streptomycin. Cells were cultured in a humidified CO2 incubator at 37°C. The Jurkat cell line was originally established from the peripheral blood of a 14-year-old boy with T cell leukemia. L-929 cells were originally derived from normal adipose tissue of a 100-day-old male C3H/An mouse. Murine embryonic fibroblasts were established from CD-1 mouse embryos, sex undetermined.
Primary Cell Cultures
For bone marrow-derived macrophages (BMDMs), bone marrow cells, from 8–12 week old mice (either male or female), were cultured in DMEM supplemented with 10% (vol/vol) heat-inactivated FBS, 10 U/mL penicillin, 100 μg/mL streptomycin, and 20% (vol/vol) L-929 fibroblast-cultured media supernatants for 7–9 days.
University Institutional Review Board and Health Insurance Portability and Accountability Act guidelines were followed for isolating peripheral human blood monocytes. For human macrophages, peripheral human blood monocytes were isolated from buffy coats of de-identified healthy adult volunteers (New York Blood Center; exact age and sex not known) and subsequently purified in a discontinuous gradient of Ficoll-Hypaque. These cells were then cultured for 10 days in Roswell Park Memorial Institute 1640 media (RPMI-1640) containing 10% heat-inactivated FBS (vol/vol), 10 U/mL penicillin, 100 μg/mL streptomycin, and 10 ng/ml of recombinant human granulocyte macrophage colony-stimulating factor (GM-CSF).
For vascular smooth muscle cells, thoracic aortas were stripped of adventitia with the endothelium denuded with a scalpel. Aortas were then placed in an enzyme solution containing collagenase (1 mg/ml), soybean trypsin inhibitor (1 mg/ml), and elastase (0.744 U/ml) in 1X HBSS for one hr. Cells were triturated, centrifuged at 1.5K RPMs for 5 minutes, and then subsequently cultured in DMEM/F12 medium supplemented with 20% heat-inactivated FBS (vol/vol), 10 U/mL penicillin, and 100 μg/mL streptomycin. Cells were cultured in a humidified CO2 incubator, at 37°C.
Experimental Animals
Animal protocols were approved by Columbia University’s institutional animal care and use committee. All animals were cared for according to the NIH guidelines for the care and use of laboratory animals. Mice were socially housed under a 12 hr light/dark cycle with ad libitum access to water and food. Mice were randomly assigned to experimental groups by investigators. Investigators were blinded for the atherosclerosis studies, but were not blinded for the dexamethasone-induced thymus injury studies. Age and sex are described below.
METHOD DETAILS
Fluorescent labeling of Jurkat cells
Calcein-AM labeling was carried out prior to induction of apoptosis. Jurkat cells were rinsed with 1X PBS, and then and incubated for 30 mins at room temperature with 5 μM Calcein-AM at a cell concentration of 1–10 x 106 cells/ml. Cells were then washed twice with DMEM containing 10% heat-inactivated FBS. For PKH and Cell-Vue Claret labeling was conducted after the induction of apoptosis. Apoptotic Jurkat cells were rinsed once with serum-free DMEM, resuspended at a concentration of 2 x 10⁷ cells/ml in Diluent C (see Resource Table), and incubated for 2–3 minutes with 4 μL of PKH or Cell-Vue Claret. The cells were then rinsed twice with DMEM containing 10% heat-inactivated FBS.
Induction of Apoptosis in Jurkat Cells
Apoptotic cells were generated by irradiating Jurkat cells under a UV (254 nm) lamp for 15 minutes followed by incubation under normal cell culture conditions for 2-3 hours. This method routinely yielded greater than 80% Annexin V-positive cells.
Mitochondrial Length Measurements
To view mitochondria, macrophages were labeled with MitoTracker Red (100 nM) for 5 mins in serum-free DMEM. MitoTracker Red-labeled macrophages were then incubated with PKH67-labeled ACs for 45 mins. Unbound ACs were removed by rinsing the monolayer, and cells were viewed by live-cell confocal fluorescence microscopy (NIKON A1 Confocal microscope, 100X oil objective). Random areas containing ACs were selected, and 0.5-μm z-steps were captured for the entire height of MitoTracker Red-labeled macrophages. The length of individual mitochondrial branches was traced using ImageJ software, and average mitochondria branch length per cell was quantified.
Cytosol and Mitochondrial Extracts from Cultured Macrophages
Using the Qproteome Mitochondria Isolation Kit, ~5 x 10⁶ macrophages were removed from wells by non-enzymatic dissociation, collected by centrifugation, and washed once with ice-cold 1X PBS. The pellets were lysed on ice with 700 μl lysis buffer, which was provided in the kit and contained protease inhibitors, and then centrifuged at 1000 x g for 5 minutes. The supernatant fractions (cytosol extract) were concentrated using Amicon Ultra-15 Centrifugal Filter Units. The pellets were further processed in 700 μl ice-cold disruption buffer, which was provided in the kit and contained protease inhibitors, vortexed for 15 seconds, and centrifuged at 1500 x g for 10 minutes. This procedure was repeated one time, and the supernatants were combined and centrifuged at 6000 x g for 10 minutes at 4°C. The lysates were mixed with Laemmli buffer and subjected to SDS-polyacrylamide gel electrophoresis (PAGE).
In Vitro Efferocytosis Assay
Peritoneal macrophages harvested four days after intraperitoneal injection of methyl-BSA in mice had been previously immunized with methyl-BSA (Cook et al., 2003) or bone marrow-derived macrophages were plated in 24-well dishes at a density of 0.2 x 10⁶ cells per well. Fluorescent ACs were added to macrophages for 45 minutes, unless noted otherwise, followed by vigorous washing 3 times with 1X PBS. Cells were either dissociated from the wells and analyzed by flow cytometry (BD Canto II) or fixed with 4% formaldehyde and imaged with an Olympus DP71 CCD camera attached to an Olympus IX-70 inverted epifluorescence microscope. For two-stage efferocytosis experiments, PKH67-labeled ACs were incubated with macrophages for 45 minutes followed by vigorous rinsing 3 times with 1X PBS. Macrophages were then incubated for another 2 hours, followed by addition of PKH27-labeled ACs. After 45 minutes, unbound ACs were removed by rinsing, and then the macrophages were fixed with 4% formaldehyde and imaged on an epifluorescence microscope.
Engulfment of IgG-Opsonized sRBCs and Latex Beads
Sheep red blood cells (sRBCs) were opsonized by incubating sRBCs with 1 μg/ml anti-sRBC antibody for 1.5 hours at 37°C. Opsonized sRBC s or 4-μm fluorescent beads were incubated with macrophages, and engulfment efficiency was measured as described in the “in vitro efferocytosis assay” section. For conjugation of phosphatidylserine to beads, streptavidin-coated 6-μm beads were incubated with biotinylated phosphatidylserine for 18 hours at 4°C .
Phagosome Sealing Assay
Apoptotic cells or IgG-opsonized sRBCs were labeled with PKH67, and then cell-surface biotinylation was conducted using EZ-link sulfo-NHS-biotin. Cells were suspended in 1X PBS (pH 8.0), incubated with 1 mM biotin for 30 minutes and then washed 3x with culture media to remove unbound biotin. These fluorescent and biotinylated cells or biotinylated beads were then added to macrophages for either 15, 30, or 60 minutes unless otherwise mentioned. At the end of the incubation period, the unengulfed cells were removed by rinsing 3 times in 1X PBS, and the adherent cells were fixed with 2% paraformaldehyde for 10 minutes followed by 3 rinses with 1X PBS. The cells were then incubated with streptavidin-Alexa fluor 568 for 30 minutes followed by 3 washes with 1X PBS. Imaging was conducted using an Olympus IX-70 inverted epifluorescence microscope connected to an Olympus DP71 CCD camera. Apoptotic cells or sRBC-containing phagosomes that did not stain positive for streptavidin-Alexa fluor 568 were considered sealed, while ACs or sRBC-containing phagosomes that were positive for streptavidin-Alexa Fluor 568 were considered unsealed.
Time-lapse Imaging of CypHer5E
BMDMs were seeded at a density of 3 x 10⁵ cells per well of a 2-well glass slide. In parallel, neutrophils were isolated from the peritoneal cavity of mice 6 hours following intraperitoneal injection of zymosan (1 mg). The neutrophils were incubated with Hoechst for 30 minutes to stain nuclei, and after 3 rinses with 1X PBS, the neutrophils were resuspended in 1X PBS and cultured for 12 hours at 37°C to allow spontaneous apoptosis. The apoptotic neutrophils were then labeled with the pH-sensitive dye CypHer5E and incubated with macrophages at an AC:macrophage ratio of 2:1 for 30 minutes at 4°C. Unbound ACs were removed by rinsing of the macrophage monolayers, and then the slide was placed in a stage-top incubator maintained at 37°C with 5% CO2. The cells were viewed at 100X magnification on a confocal fluorescence microscope (NIKON A1 Confocal), and images of the same field were recorded at approximately 3.57-minute intervals. Sixty separate fields were imaged using this protocol.
Lentivirus Cloning and Production
To target GCaMP6f to the mitochondria, a duplex of the mitochondrial targeting signal of cytochrome c oxidase subunit VIII (COX8) was added before the initial ATG of GCaMP6f by replacing the carmine indicator with GCaMP6f in the vector CMV-mito-CAR-GECO1. CK-GCaMP6f and 2x-COX8-GCaMP6f were subcloned into lentiviral transfer vectors and then packaged and concentrated by ALSTEM, LLC. The lentiviral transfer vector was cut with XbaI and NotI (NEB) at 37°C for 2 hours. Inserts were amplified by PCR from CK-GCaMP6f and 2x-COX8-GCaMP6f plasmids, digested with XbaI and NotI, and ligated into the lentiviral vector. To make the virus, the lentiviral transfer plasmids were co-transfected with packaging plasmids. Viral supernates were harvested 48 hours after transfection, centrifuged, and filtered through a 0.45-μm filter (Millipore). Viral particles were pelleted at 50,000 x g at 4°C for 2 hours, resuspended in DMEM, aliquoted, and stored at −80°C. Viral titers were determined by Lenti-X qRT-PCR Titration Kit.
Cytosolic, Mitochondrial, and ER Calcium Measurements
Macrophages were incubated for 18 hours with lentiviruses at an MOI of 5 for GCaMP6f, 2.5 for 2x-COX8-GCaMP6f, and 5 for ER-GCaMP6-150. After 2–3 days, the cells were viewed by live-cell confocal fluorescence microscopy as above after being exposed to CellVue Claret-labeled ACs. Measurements of relative GFP intensity/macrophage, as an indicator of calcium level, were begun when ACs fell into the plane of focus of the macrophages. Images were captured every 5 minutes.
Analysis of Apoptotic Cell Fragmentation
PKH26- and Hoechst-labeled ACs were added to macrophages for 45 minutes, and then unengulfed ACs were removed by vigorous rinsing with 1X PBS. After culture for 3 additional hours, the macrophages were fixed with 4% formaldehyde and images were captured using an epifluorescence microscope. The percent of macrophages containing fragmented AC-derived fluorescence, which is a measure of AC corpse degradation, was quantified.
Vesicular Exocytosis Measurements Using the Styryl Dye FM1-84
Macrophages were incubated with 10 μM FM1-84 in serum-free DMEM for 60 minutes and then rinsed twice with serum-free DMEM and incubated in this media for an additional 10 minutes. CypHer5E-labeled apoptotic Jurkat cells were added to the macrophages, and time-lapse imaging was performed, as mentioned previously, with images taken every 1.5 minutes. Analysis was synchronized between groups based on first appearance of CypHer5E positivity, using fluorescent decay of FM1-84 as an indicator of vesicular exocytosis.
ATP Measurements
Using the ATP detection kit, cells were lysed in the ATP assay buffer (provided in the kit) and centrifuged at maximum speed on a table top microfuge for 2 minutes. The supernatant fraction was collected and tested for ATP levels by assaying phosphorylation of glycerol, where the readout is generation of a fluorometric product with Ex/Em = 535/587 nm.
ROS Measurements
ROS was detected using the ROS-sensitive fluorescent probe 2',7'-dichlorodihydrofluorescein diacetate (H2-DCFDA). Apoptotic Jurkat cells were loaded with 10 μM H2-DCFDA for 30 minutes, rinsed twice, and then added to macrophages for the indicated times. Unbound ACs were removed by rinsing the monolayer, and macrophages were detached with Cellstripper solution and subjected to flow cytometry (BD Canto II) for fluorescence detection. In certain experiments, H2-DCFDA detection was measured on a fluorescence plate reader at Ex/Em = 495/520.
Lysosomal pH Measurements
Lysosomal pH was assayed based on the fluorescence ratio of pH-sensitive fluorescein fluorescence to pH-insensitive rhodamine as follows (Majumdar et al., 2007): the cells were incubated for 16 hours with 2.5 mg/ml dextran conjugated to both fluorescein and rhodamine. After incubation for 4 hours to allow dextran accumulation in the lysosomes, the cells were imaged in a buffer containing 150 mM NaCl, 20 mM HEPES, 1 mM CaCl2, 5 mM KCl, 1 mM MgCl2, and 0.2% (w/v) glucose. Images were acquired with a Zeiss LSM 510 laser scanning confocal microscope using a 63X 1.4 numeral aperture objective, and z-stacks were analyzed in order to have all lysosomes quantified. Images were analyzed using MetaMorph image analysis software (Molecular Devices), with individual lysosomal fluorescence calculated for the ratio of fluorescein to rhodamine fluorescence. Calibration curves were generated after fixing and equilibrating the fluorescein-rhodamine-dextran-loaded cells to a range of pH buffers.
Immunoblotting
Cells were lysed in 2X Laemmli sample buffer containing 50 mM DTT and heated at 100°C for 10 minutes. Lysates were separated on 4–20% gradient SDS-PAGE gels at 120-150V for 1.5-2 hrs, electro-transferred to 0.45-μm nitrocellulose or PVDF membranes at 100V for 2 hrs, incubated overnight at 4°C with primary antibodies in either 1X PBS containing 1% BSA or TBST containing 5% non-fat dry milk, and detected using HRP-conjugated secondary antibodies. Densitometry was performed using ImageJ software.
siRNA-Mediated Gene Silencing
Scrambled siRNA control and oligo-targeting siRNAs were transfected into macrophages using Lipofectamine 2000 or Lipofectamine RNAiMax (Life Technologies) at 20–50 nM of siRNA in 24-well plates. Macrophages were incubated for 18 hours with in Opti-MEM containing 3 μL Lipofectamine 2000 or 1.5 μL Lipofectamine RNAiMAX per 0.2 x 10⁶ cells and 20-50 nM siRNA. Experiments and mRNA analyses were conducted 2–3 days later.
Quantitative RT-PCR
RNA was extracted from samples using the RNeasy Micro Kit. The purity of the RNA was assessed by absorbance at 260 and 280 nm using a Thermo Scientific NanoDrop spectrophotometer. Using RNA with a 260/280 ratio of >1.8, cDNA was synthesized using oligo (dT) and Superscript II. Quantitative RT-PCR was performed using a 7500 Real-Time PCR system (Applied Biosystems) and SYBR Green Master Mix.
Immunocytochemistry
Macrophages were either fixed with ice-cold acetone on ice for 5 minutes or with 4% formaldehyde for 10-15 minutes. After three rinses with 1X PBS, the cells were either directly incubated with blocking buffer (1X PBS with 10% serum and 1% BSA) for 1 hour or permeabilized with 0.1% Triton for 10 mins, or with 50 μg/ml of digitonin for 5 mins for LC3 staining, and then incubated with blocking buffer for 1 hour. The cells were then incubated overnight at 4oC with antibodies against Drp1 (1:200 dilution), COX IV (1:200 dilution), or LC3 (1:100 dilution), followed by incubation with Alexa Fluor-conjugated antibodies for at least 2 hours. Excess antibody was removed by rinsing 3 times with 1X PBS, and the cells were viewed by confocal fluorescence microscopy (NIKON A1 Confocal).
Tissue Collection and Lesion Analysis
For atherosclerosis studies, Drp1fl/fl mice were generated as previously described (Ishihara et al., 2009) and backcrossed for a minimum of ten times onto the C57BL/6J background. The mice were genotyped using a Drp1 primer that targeted exon 2, which is flanked by two Loxp sites. These mice were bred with C57BL/6J Ldlr−/− mice from Jackson Laboratories and then crossed with C57BL/6J LysMCre mice to delete Drp1 in myeloid cells (Clausen et al., 1999). Eight-to-ten-week-old Drp1fl/fl Ldlr−/− Lysmcre−/− or Drp1fl/fl Ldlr−/− Lysmcre+/− male mice were placed on a high-fat Western Diet for 12 weeks before euthanasia. Immediately after sacrifice, mice were perfused with 1X PBS by cardiac puncture in the left ventricle, and aortic roots were collected and processed for cryosectioning. For morphometric lesion analysis, sections were stained with hematoxylin and eosin. Total intimal lesion area from internal elastic lamina to the lumen and acellular necrotic areas, which are areas negative for hematoxylin-positive nuclei, were quantified by taking the average of 6 sections spaced 30 μm apart, beginning at the base of the aortic root. Boundary lines were drawn around these regions, and the area measurements were obtained by image analysis software. A 3,000-μm2 threshold cut-off for acellular areas was used to quantify areas of necrosis. Fasting blood glucose levels were measured using ONETOUCH Ultra after food was withdrawn for 5–6 hours. Total plasma cholesterol, HDL-cholesterol, and triglyceride were measured using kits from WAKO Diagnostics. Pooled plasma from 3 mice per cohort were fractionated by FPLC gel filtration using a Superose 6 column (Amersham Pharmacia) at a flow rate of 0.2 ml/minute, followed by cholesterol assay of the fractions.
In vivo Thymus Efferocytosis Assay
Eight-week-old female mice were injected i.p. with 200 μl PBS containing 250 μg dexamethasone dissolved in DMSO. Eighteen hours after injection, the mice were euthanized and thymuses were harvested. Thymus cellularity was quantified by mechanically disaggregating a lobe of the thymus and then counting cells using a hemocytometer. Another aliquot of cells was fixed in 4% paraformaldehyde for 15 minutes, permeabilized with 0.1% Triton for 8 minutes, washed with PBS, incubated with TUNEL staining reagents, and analyzed by flow cytometry to determine the number of TUNEL-positive cells. The other thymus lobe was formalin-fixed and paraffin-embedded and sectioned, followed by staining of the sections (5 μm) with TUNEL reagent and antibody to F4/80 and then fluorescent secondary antibody to immunostain macrophages. Images were captured using a Leica epifluorescence microscope (DMI6000B). For the Mcu−/− bone marrow transplantation experiment, 10-week-old male CD-1 recipient mice were given acidic water containing neomycin and polymyxin B (10 ml of 10 mg/ml neomycin in saline and 400 ml of 25 mg/ml polymyxin B sulfate in water added to 1 liter of acidic water) one week before irradiation. The mice were then irradiated using 1000 rads from a 137 Cesium Gammacell source. Four hours after irradiation, the mice were injected via tail vein with 5 x 10⁶ bone marrow cells from 16-20-week-old wild-type (WT) CD-1 mice or Mcu−/− CD1 male mice (Pan et al., 2013). The bone marrow cells were prepared as follows: Femurs from donor mice were isolated and flushed with RPMI 1640, supplemented with heat-inactivated FBS (2% vol/vol), 10 units/ml of heparin, and a cocktail of 10 U/mL penicillin and 100 μg/mL streptomycin. The cells were filtered through a 40-μm nylon cell and centrifuged at 2000 rpm for 10 minutes at 4oC. Bone marrow cells were rinsed and pelleted twice more. Six weeks after injection of bone marrow cells, the mice were subjected to the dexamethasone procedure and efferocytosis analysis as outlined above. For confirmation of successful transplantation, whole splenic cells were immunoblotted for MCU and β-actin.
Immunohistochemistry and Immunofluorescence Microscopy
Frozen specimens were immersed in OCT and cryosectioned, and 6-μm sections were placed on glass slides and then exposed to ice-cold acetone for 10 minutes to fix and permeabilize. Paraffin-embedded specimens were sectioned, de-paraffinized with xylene, and rehydrated in decreasing concentrations of ethanol. Sections were incubated with TUNEL staining reagents at 37 °C for 60 minutes, and then washed 3 times with 1X PBS. Sections were then blocked with 10% goat serum for 30 minutes, incubated overnight at 4°C with anti-Mac3 (1:200) o r F4/80 (1:200), incubated with fluorescently-labeled secondary antibodies, and counterstained with DAPI. In situ efferocytosis was quantified by counting TUNEL-positive nuclei that were associated with macrophages ("associated"), indicative of efferocytosis, or not associated with macrophages (‘free’). Macrophage-associated apoptotic cells followed the criteria of TUNEL-positive nuclei surrounded by or in contact with neighboring F4/80+ macrophages. Free apoptotic cells exhibited nuclear condensation, loss of antibody F4/80 reactivity, and were not in contact with neighboring macrophages.
QUANTIFICATION AND STATISTICAL ANALYSIS
Data were tested for normality using the Kolmogorov-Smirnov test, and statistical significance was determined using GraphPad Prism software. Data that passed the normality were analyzed using Student’s t test for two groups with one variable tested and equal variances, one-way ANOVA with Newman-Keuls post-test for multiple groups with only variable tested, or two-way ANOVA with Bonferroni post-tests for more than two groups with multiple variables tested. Data that were not normally distributed but contained equal variances were analyzed using the nonparametric Mann-Whitney U test with post hoc analysis. Data are shown as mean values ± SEM. Differences were considered statistically significant at p< 0.05.
KEY RESOURCES TABLE
| REAGENT or RESOURCE | SOURCE | IDENTIFIER |
|---|---|---|
| Antibodies | ||
| Mouse anti-Drp1 (Clone 8/DLP1) | BD Biosciences | Cat# 611113 |
| Rabbit anti-Drp1 | Cell Signaling Technology | Cat# 8570S |
| Mouse anti-VDAC1 | Abcam | Cat# ab14734 |
| Mouse anti-ATP5α | Abcam | Cat# ab110273 |
| Rabbit anti-GAPDH | Cell Signaling Technology | Cat# 5174S |
| Mouse anti-PDH1α | Abcam | Cat# ab110330 |
| Goat anti-Mff | Santa Cruz Biotechnology | Cat# SC-168593 |
| Rabbit anti-Mcu1 | Sigma Life Sciences | Cat# PA016480 |
| Mouse anti-β-actin | Santa Cruz Biotechnology | Cat# SC-47778 |
| Rat anti-F4/80 (Clone BM8) | eBiosciences | Cat# 14-4801-82 |
| Rat anti-Mac3 (M3/84) | BD Biosciences | Cat# 553322 |
| Rabbit anti-COX IV | Cell Signaling Technology | Cat# 4844S |
| Rabbit anti-LC3 | MBL Intern. Corporation | Cat# PM036 |
| Goat anti-mouse (HRP) | Invitrogen | Cat# 32230 |
| Goat anti-rabbit (HRP) | Invitrogen | Cat# 32260 |
| Rabbit anti-goat (HRP) | Invitrogen | Cat# 81-1620 |
| Goat anti-mouse (AF488) | Invitrogen | Cat# A11001 |
| Goat anti-rat (AF488) | Invitrogen | Cat# A11006 |
| Goat anti-rabbit (AF488) | Invitrogen | Cat# A11034 |
| Goat anti-rabbit (AF555) | Invitrogen | Cat# A21428 |
| Rat anti-CD16/CD32 | BD Biosciences | Cat# 553142 |
| Rat anti-F4/80 (FITC) | Biolegend | Cat# 123107 |
| Rat anti-CD68 (APC) | Biolegend | Cat# 137007 |
| Rat ant-FCγRI (PE) | Biolegend | Cat# 139303 |
| Anti-sRBC | Rockland | Cat # 213-4139 |
| Bacterial and Virus Strains | ||
| VSV-G Pseudotyped Lentivirus | ALSTEM | www.alstembio.com |
| Chemicals, Peptides, and Recombinant Proteins | ||
| Dulbecco’s Modified Eagle Media (DMEM) | Corning | Cat# 10-013-CV |
| Roswell Park Memorial Institute (RPMI) 1640 Media | Corning | Cat# 10-040-CV |
| DMEM/Nutrient Mixture F-12 (DMEM/F12) | GIBCO | Cat# 11320-033 |
| Opti-MEM | GIBCO | Cat# 31985-070 |
| 1X HBSS | Corning | Cat# 21-022-CV |
| 1X PBS | Corning | Cat# 21-040-CV |
| CellStripper | Corning | Cat# 25-056-CI |
| Heat-Inactivated Fetal Bovine Serum | GIBCO | Cat# 10438-026 |
| Penicillin/Streptomycin | Corning | Cat# 30-002-CI |
| Human Granulocyte Colony Stimulating Factor (GM-CSF) | PeproTech | Cat# 300-03 |
| HISTOPAQUE-1077 | Sigma-Aldrich | Cat# 10771-100ML |
| Collagenase I | Sigma-Aldrich | Cat# 1148089 |
| Soybean Trypsin Inhibitor | Sigma-Aldrich | Cat# T9003 |
| Elastase | Sigma-Aldrich | Cat# E7885 |
| 2-Well Glass Slides | Thermo Scientific | Cat# 155380 |
| 4-Well Glass Slides | Thermo Scientific | Cat# 155383 |
| 8-Well Glass Slides | Thermo Scientific | Cat# 155411 |
| Novex 4-20% Tris-Glycine Mini Gels, 15-well | Invitrogen | Cat# XP04205BOX |
| 4X Laemmli Buffer | Bio-Rad | Cat# 1610747 |
| MitoTracker Red CMXRos | Molecular Probes | Cat# M7512 |
| PKH67 Fluorescent Cell Linker | Sigma-Aldrich | Cat# PKH67GL-1KT |
| PKH26 Fluorescent Cell Linker | Sigma-Aldrich | Cat# PKH26GL-1KT |
| Cell-Vue Claret Fluorescent Cell Linker | Sigma-Aldrich | Cat# MINCLARET-1KT |
| Diluent C | Sigma-Aldrich | Cat# CGLDIL |
| Calcein-AM | Molecular Probes | Cat# C3100MP |
| MDIVI-1 | Sigma-Aldrich | Cat# M0199 |
| Cytochalasin D | Sigma-Aldrich | Cat# C8273 |
| EZ-Link Sulfo-NHS Ester | Thermo Scientific | Cat# 21217 |
| Streptavidin (AF568) | Invitrogen | Cat# S11226 |
| CypHer5E Mono NHS Ester | GE Healthcare | Cat# PA15401 |
| Hoechst 33342 | Thermo Scientific | Cat# 62249 |
| Digitonin | Sigma-Aldrich | Cat# D141 |
| H2-DCFDA | Invitrogen | Cat# D399 |
| Tert-Butyl Hydroperoxide | Alfa-Aesar | Cat# A13926 |
| FM1-84 | Biotium | Cat# 70046 |
| Bafilomycin A1 | Sigma-Aldrich | Cat# B1793 |
| Biotinylated-Phosphatidylserine | Echelon Biosciences | Cat# L-31B16 |
| Streptavidin-Coated Polystyrene Beads | Spherotech | Cat# SVP-60-5 |
| Dexamethasone | Calbiochem | Cat# 265005 |
| Actinomycin D | Sigma-Aldrich | Cat# A1410 |
| Cycloheximide | Sigma-Aldrich | Cat# 7698 |
| 10 μm-coated microspheres | Bangs Laboratories | Cat# CP10N |
| 4 μm-coated microspheres | Bangs Laboratories | Cat# PC05N |
| Sheep RBCs | Rockland | Cat# R405-0050 |
| Rapamycin | Sigma-Aldrich | Cat# R0395 |
| 4 μm-coated microspheres | Thermo-Fisher | Cat# F8859 |
| Annexin V (FITC) | BD Biosciences | Cat# 560931 |
| Oxidized LDL | Alfa Aesar | Cat# J65591 |
| 7-Ketocholesterol | Sigma-Aldrich | Cat# C2394 |
| Zymosan A | Sigma-Aldrich | Cat# Z4250 |
| Lipofectamine 2000 | Life Technologies | Cat# 11668-030 |
| Lipofectamine RNAiMax | Life Technologies | Cat# 13778-150 |
| Neomycin | Sigma-Aldrich | Cat# N1142 |
| Polymyxin B | Sigma-Aldrich | Cat# P4932 |
| Dextran, Fluorescein, and Tetramethylrhodamine | Invitrogen | D1951 |
| Heparin | Sigma-Aldrich | Cat# H3393 |
| 40 μm Nylon Cell Strainers | BD Falcon | Cat# 352340 |
| Power SYBR Green PCR Master Mix | Applied Biosystems | Cat# 4367659 |
| Critical Commercial Assays | ||
| Qproteome Mitochondria Isolation Kit | Qiagen | Cat# 37612 |
| ATP Detection Kit | Abcam | Cat# ab83355 |
| RNeasy Micro Kit | Qiagen | Cat# 74004 |
| TUNEL Kit | Roche | Cat# 12156792910 |
| Total Cholesterol Kit | Wako Diagnostics | Cat# 999-02601 |
| HDL Cholesterol Kit | Wako Diagnostics | Cat# 997-01301 |
| Triglycerides Kit Color A | Wako Diagnostics | Cat# 994-02891 |
| Triglycerides Kit Color B | Wako Diagnostics | Cat# 990-02991 |
| Experimental Models: Cell Lines | ||
| Human: Jurkat cells | ATCC | ATCC TIB-152 |
| Mouse: L-929 Fibroblast cells | ATCC | ATCC CCL-1 |
| Mouse: Bone Marrow-Derived Macrophage cells | This paper | N/A |
| Mouse: Elicited Peritoneal Macrophage cells | This paper | N/A |
| Mouse: Vascular Smooth Muscle cells | This paper | N/A |
| Human: Peripheral Blood Monocyte-Derived Macrophage cells | This paper | N/A |
| Experimental Models: Organisms/Strains | ||
| Mouse: C57BL/6J | The Jackson Laboratory | JAX: 000664 |
| Mouse: Ldlr−/− C57Bl/6J | The Jackson Laboratory | JAX: 002207 |
| Mouse: Drp1fl/fl C57Bl/6J | Ishihara et al., 2009 | N/A |
| Mouse: Lysmcre C57Bl/6J | Clausen et al., 1999 | N/A |
| Mouse: CD-1 | Charles River | Crl: 022 |
| Mouse: Mcu−/− CD-1 | Pan et al, 2013 | N/A |
| Oligonucleotides | ||
| ON-TARGET plus non-targeting pool | GE Healthcare Dharmacon | D-001810-10-05 |
| Human: DNML1 SMARTpool | GE Healthcare Dharmacon | L-012092-00 |
| Mouse: Mff SMARTpool | GE Healthcare Dharmacon | E-041534-00 |
| Mouse: DNML1 | Qiagen | SI0098226 and SI00982240 |
| Mouse: Mfn1 | Qiagen | SI01304408 and SI01304401 |
| Mouse: Drp1 Forward ATAAGCTGCAGGACGTCTTC |
PrimerBank | www.pga.mgh.harvard.edu/primerbank |
| Mouse: Drp1 Reverse TGACCACACCAGTTCCTCT |
PrimerBank | www.pga.mgh.harvard.edu/primerbank |
| Mouse: β-Actin Forward GGCTGTATTCCCCTCCATCG |
PrimerBank | www.pga.mgh.harvard.edu/primerbank |
| Mouse: β-Actin Reverse CCAGTTGGTAACAATGCCATGT |
PrimerBank | www.pga.mgh.harvard.edu/primerbank |
| Mouse: TNFa Forward CCCTCACACTCAGATCATCTTCT |
Guo et al., 2016 | N/A |
| Mouse: TNFa Reverse GCTACGACGTGGGCTACAG |
Guo et al., 2016 | N/A |
| Mouse: IL1β Forward GCAACTGTTCCTGAACTCAACT |
Guo et al., 2016 | N/A |
| Mouse: IL1β Reverse ATCTTTTGGGGTCCGTCAACT |
Guo et al., 2016 | N/A |
| Mouse: IFN Forward ATGAACGCTACACACTGCATC |
PrimerBank | www.pga.mgh.harvard.edu/primerbank |
| Mouse: IFN Reverse CCATCCTTTTGCCAGTTCCTC |
PrimerBank | www.pga.mgh.harvard.edu/primerbank |
| Mouse: IL6 Forward CCAAGAGGTGAGTGCTTCCC |
PrimerBank | www.pga.mgh.harvard.edu/primerbank |
| Mouse: IL6 Reverse CTGTTGTTCAGACTCTCTCCCT |
PrimerBank | www.pga.mgh.harvard.edu/primerbank |
| Mouse: Nos2 Forward GTTCTCAGCCCAACAATACAAGA |
Guo et al., 2016 | N/A |
| Mouse: Nos2 Reverse GTGGACGGGTCGATGTCAC |
Guo et al., 2016 | N/A |
| Mouse: Arg1 Forward CTCCAAGCCAAAGTCCTTAGAG |
Guo et al., 2016 | N/A |
| Mouse: Arg1 Reverse AGGAGCTGTCATTAGGGACA |
Guo et al., 2016 | N/A |
| Mouse: Mrc1 Forward CTCTGTTCAGCTATTGGACGC |
Guo et al., 2016 | N/A |
| Mouse: Mrc1 Reverse TGGCACTCCCAAACATAATTTGA |
Guo et al., 2016 | N/A |
| Mouse: Retnla Forward CCAATCCAGCTAACTATCCCTCC |
Nomura et al., 2016 | N/A |
| Mouse: Retnla Reverse ACCCAGTAGCAGTCATCCCA |
Nomura et al., 2016 | N/A |
| Recombinant DNA | ||
| CK-GCaMP6f | Chen et al., 2013 | Addgene: Plasmid#40755 |
| Mito-CAR-GECO1 | Wu et al., 2013 | Addgene: Plasmid#46022 |
| ER-GCaMP-150 | de Juan-Sanz et al., 2017 | Addgene: Plasmid#86918 |
| Software and Algorithms | ||
| DP Manager Basic Imaging Software | Olympus | Version 3.1 |
| NIS-Elements | Nikon | Advanced Research |
| Leica Application Suite | Leica | Advanced Fluorescence |
| ImageJ | NIH | www.imagej.nih.gov/ij |
| FIJI | Schindelin et al., 2012 | www.fiji.sc |
| MetaMorph | Molecular Devices | Version 7.10 |
| PRISM | GraphPad Software | Version 6 |
| FlowJo | FlowJo, LLC | Version 10 |
| Other | ||
| Mouse Diet: High-Fat Western Diet | Envigo | Cat# TD.88137 |
| Lentivirus Cloning and Packaging Services | ALSTEM | www.alstembio.com |
| Lenti-X qRT-PCR Titration Kit | Clontech | Cat# 631235 |
| Genotyping Service | Genetyper | www.genetyper.co |
Supplementary Material
Highlights.
Continued efferocytosis requires Drp1-mediated mitochondrial fission
Mitochondrial fission allows release of ER Ca2+ into the cytoplasm
Ca2+-mediated vesicular trafficking enables phagocytosis of a 2nd apoptotic cell
Mice lacking myeloid Drp1 have defective efferocytosis and its pathologic sequelae
Acknowledgments
We wish to thank Dr. Toren Finkel (National Institutes of Health) for providing the Mcu−/− mice, Drs. Mohammad Islam and Jahar Bhattacharya for assistance with the MCU experiments, George Kuriakose for technical contributions related to the atherosclerosis studies, Xiaobo Wang for assistance with isolation of aortic smooth muscle cells, the Herbert Irving Comprehensive Cancer Center Confocal Core Facility and Theresa Swayne and Laura Munteanu for assistance with confocal imaging, and the Columbia Center for Translational Immunology Core Facility for access to flow cytometry equipment (funded in part by NIH/NIDDK Center Grant 5P30DK063608 and by the Office of the NIH Director under Shared Instrumentation Grant S10OD020056). This study was supported by American Heart Association pre-doctoral training grant 11PRE7450075 (Y.W.); an American Heart Association Post-Doctoral Fellowship grant (B.C.); KAKENHI grant 26461383 from the Japanese Society for the Promotion of Science (M.N.); and NIH grants T32 HL007343-28 (A.Y.Jr.), R37 NS036942 (T.A.R.), R01 HL093324 (F.R.M.), R01 HL075662, HL127464, and HL132412 (I.T.).
Footnotes
AUTHOR CONTRIBUTIONS
Y.W., M.S., A.Y.Jr, F.R.M., and I.T. designed experiments, performed the research, analyzed the data, and wrote the manuscript. V.C.B-L. and B.C. conducted key experiments related to intracellular pH measurements and Drp1-deficient mice, respectively. J.J.S. and T.A.R. provided reagents and advice for the cellular calcium assays. M.N. offered crucial advice related to Drp1 and mitochondrial dynamics throughout the entire project and provided the Drp1fl/fl mice.
Publisher's Disclaimer: This is a PDF file of an unedited manuscript that has been accepted for publication. As a service to our customers we are providing this early version of the manuscript. The manuscript will undergo copyediting, typesetting, and review of the resulting proof before it is published in its final citable form. Please note that during the production process errors may be discovered which could affect the content, and all legal disclaimers that apply to the journal pertain.
References
- Aderem A. How to eat something bigger than your head. Cell. 2002;110:5–8. doi: 10.1016/s0092-8674(02)00819-x. [DOI] [PubMed] [Google Scholar]
- Arandjelovic S, Ravichandran KS. Phagocytosis of apoptotic cells in homeostasis. Nat Immunol. 2015;16:907–917. doi: 10.1038/ni.3253. [DOI] [PMC free article] [PubMed] [Google Scholar]
- Blommaart EF, Luiken JJ, Blommaart PJ, van Woerkom GM, Meijer AJ. Phosphorylation of ribosomal protein S6 is inhibitory for autophagy in isolated rat hepatocytes. J Biol Chem. 1995;270:2320–2326. doi: 10.1074/jbc.270.5.2320. [DOI] [PubMed] [Google Scholar]
- Cai B, Thorp EB, Doran AC, Sansbury BE, Daemen MJ, Dorweiler B, Spite M, Fredman G, Tabas I. MerTK receptor cleavage promotes plaque necrosis and defective resolution in atherosclerosis. J Clin Invest. 2017;127:564–568. doi: 10.1172/JCI90520. [DOI] [PMC free article] [PubMed] [Google Scholar]
- Cassidy-Stone A, Chipuk JE, Ingerman E, Song C, Yoo C, Kuwana T, Kurth MJ, Shaw JT, Hinshaw JE, Green DR, et al. Chemical inhibition of the mitochondrial division dynamin reveals its role in Bax/Bak-dependent mitochondrial outer membrane permeabilization. Dev Cell. 2008;14:193–204. doi: 10.1016/j.devcel.2007.11.019. [DOI] [PMC free article] [PubMed] [Google Scholar]
- Chan DC. Fusion and fission: interlinked processes critical for mitochondrial health. Annu Rev Genet. 2012;46:265–287. doi: 10.1146/annurev-genet-110410-132529. [DOI] [PubMed] [Google Scholar]
- Clausen BE, Burkhardt C, Reith W, Renkawitz R, Forster I. Conditional gene targeting in macrophages and granulocytes using LysMcre mice. Transgenic Res. 1999;8:265–277. doi: 10.1023/a:1008942828960. [DOI] [PubMed] [Google Scholar]
- Cook AD, Braine EL, Hamilton JA. The phenotype of inflammatory macrophages is stimulus dependent: implications for the nature of the inflammatory response. J Immunol. 2003;171:4816–4823. doi: 10.4049/jimmunol.171.9.4816. [DOI] [PubMed] [Google Scholar]
- Cuttell L, Vaughan A, Silva E, Escaron CJ, Lavine M, Van GE, Eid JP, Quirin M, Franc NC. Undertaker, a Drosophila junctophilin, links Draper-mediated phagocytosis and calcium homeostasis. Cell. 2008;135:524–534. doi: 10.1016/j.cell.2008.08.033. [DOI] [PubMed] [Google Scholar]
- Czibener C, Sherer NM, Becker SM, Pypaert M, Hui E, Chapman ER, Mothes W, Andrews NW. Ca2+ and synaptotagmin VII-dependent delivery of lysosomal membrane to nascent phagosomes. J Cell Biol. 2006;174:997–1007. doi: 10.1083/jcb.200605004. [DOI] [PMC free article] [PubMed] [Google Scholar]
- de Brito OM, Scorrano L. Mitofusin 2 tethers endoplasmic reticulum to mitochondria. Nature. 2008;456:605–610. doi: 10.1038/nature07534. [DOI] [PubMed] [Google Scholar]
- de Juan-Sanz J, Holt GT, Schreiter ER, de JF, Kim DS, Ryan TA. Axonal Endoplasmic Reticulum Ca2+ Content Controls Release Probability in CNS Nerve Terminals. Neuron. 2017;93:867–881. doi: 10.1016/j.neuron.2017.01.010. [DOI] [PMC free article] [PubMed] [Google Scholar]
- Dikalov SI, Li W, Doughan AK, Blanco RR, Zafari AM. Mitochondrial reactive oxygen species and calcium uptake regulate activation of phagocytic NADPH oxidase. Am J Physiol Regul Integr Comp Physiol. 2012;302:R1134–R1142. doi: 10.1152/ajpregu.00842.2010. [DOI] [PMC free article] [PubMed] [Google Scholar]
- Drago I, De SD, Rizzuto R, Pozzan T. Mitochondrial Ca2+ uptake contributes to buffering cytoplasmic Ca2+ peaks in cardiomyocytes. Proc Natl Acad Sci U S A. 2012;109:12986–12991. doi: 10.1073/pnas.1210718109. [DOI] [PMC free article] [PubMed] [Google Scholar]
- Garbin U, Baggio E, Stranieri C, Pasini A, Manfro S, Mozzini C, Vallerio P, Lipari G, Merigo F, Guidi G, et al. Expansion of necrotic core and shedding of Mertk receptor in human carotid plaques: a role for oxidized polyunsaturated fatty acids? Cardiovasc Res. 2013;97:125–133. doi: 10.1093/cvr/cvs301. [DOI] [PubMed] [Google Scholar]
- Gronski MA, Kinchen JM, Juncadella IJ, Franc NC, Ravichandran KS. An essential role for calcium flux in phagocytes for apoptotic cell engulfment and the anti-inflammatory response. Cell Death Differ. 2009;16:1323–1331. doi: 10.1038/cdd.2009.55. [DOI] [PMC free article] [PubMed] [Google Scholar]
- Han CZ, Ravichandran KS. Metabolic connections during apoptotic cell engulfment. Cell. 2011;147:1442–1445. doi: 10.1016/j.cell.2011.12.006. [DOI] [PMC free article] [PubMed] [Google Scholar]
- Hochreiter-Hufford A, Ravichandran KS. Clearing the dead: apoptotic cell sensing, recognition, engulfment, and digestion. Cold Spring Harb Perspect Biol. 2013;5:a008748. doi: 10.1101/cshperspect.a008748. [DOI] [PMC free article] [PubMed] [Google Scholar]
- Ishihara N, Nomura M, Jofuku A, Kato H, Suzuki SO, Masuda K, Otera H, Nakanishi Y, Nonaka I, Goto Y, et al. Mitochondrial fission factor Drp1 is essential for embryonic development and synapse formation in mice. Nat Cell Biol. 2009;11:958–966. doi: 10.1038/ncb1907. [DOI] [PubMed] [Google Scholar]
- Khanna S, Biswas S, Shang Y, Collard E, Azad A, Kauh C, Bhasker V, Gordillo GM, Sen CK, Roy S. Macrophage dysfunction impairs resolution of inflammation in the wounds of diabetic mice. PLoS ONE. 2010;5:e9539. doi: 10.1371/journal.pone.0009539. [DOI] [PMC free article] [PubMed] [Google Scholar]
- Kojima Y, Volkmer JP, McKenna K, Civelek M, Lusis AJ, Miller CL, Direnzo D, Nanda V, Ye J, Connolly AJ, et al. CD47-blocking antibodies restore phagocytosis and prevent atherosclerosis. Nature. 2016;536:86–90. doi: 10.1038/nature18935. [DOI] [PMC free article] [PubMed] [Google Scholar]
- Kubota Y, Takahashi S, Matsuoka O. Dependence on particle size in the phagocytosis of latex particles by rabbit alveolar macrophages cultured in vitro. J Toxicol Sci. 1983;8:189–195. doi: 10.2131/jts.8.189. [DOI] [PubMed] [Google Scholar]
- Linton MF, Babaev VR, Huang J, Linton EF, Tao H, Yancey PG. Macrophage apoptosis and efferocytosis in the pathogenesis of atherosclerosis. Circ J. 2016;80:2259–2268. doi: 10.1253/circj.CJ-16-0924. [DOI] [PMC free article] [PubMed] [Google Scholar]
- Lu N, Zhou Z. Membrane trafficking and phagosome maturation during the clearance of apoptotic cells. Int Rev Cell Mol Biol. 2012;293:269–309. doi: 10.1016/B978-0-12-394304-0.00013-0. [DOI] [PMC free article] [PubMed] [Google Scholar]
- Luchsinger LL, de Almeida MJ, Corrigan DJ, Mumau M, Snoeck HW. Mitofusin 2 maintains haematopoietic stem cells with extensive lymphoid potential. Nature. 2016;529:528–531. doi: 10.1038/nature16500. [DOI] [PMC free article] [PubMed] [Google Scholar]
- Majumdar A, Cruz D, Asamoah N, Buxbaum A, Sohar I, Lobel P, Maxfield FR. Activation of microglia acidifies lysosomes and leads to degradation of Alzheimer amyloid fibrils. Mol Biol Cell. 2007;18:1490–1496. doi: 10.1091/mbc.E06-10-0975. [DOI] [PMC free article] [PubMed] [Google Scholar]
- Maltecca F, De SD, Cassina L, Consolato F, Wasilewski M, Scorrano L, Rizzuto R, Casari G. Respiratory dysfunction by AFG3L2 deficiency causes decreased mitochondrial calcium uptake via organellar network fragmentation. Hum Mol Genet. 2012;21:3858–3870. doi: 10.1093/hmg/dds214. [DOI] [PMC free article] [PubMed] [Google Scholar]
- Martinez J, Almendinger J, Oberst A, Ness R, Dillon CP, Fitzgerald P, Hengartner MO, Green DR. Microtubule-associated protein 1 light chain 3 alpha (LC3)-associated phagocytosis is required for the efficient clearance of dead cells. Proc Natl Acad Sci U S A. 2011;108:17396–17401. doi: 10.1073/pnas.1113421108. [DOI] [PMC free article] [PubMed] [Google Scholar]
- Martinez J, Cunha LD, Park S, Yang M, Lu Q, Orchard R, Li QZ, Yan M, Janke L, Guy C, et al. Noncanonical autophagy inhibits the autoinflammatory, lupus-like response to dying cells. Nature. 2016;533:115–119. doi: 10.1038/nature17950. [DOI] [PMC free article] [PubMed] [Google Scholar] [Retracted]
- Martinez J, Malireddi RK, Lu Q, Cunha LD, Pelletier S, Gingras S, Orchard R, Guan JL, Tan H, Peng J, et al. Molecular characterization of LC3-associated phagocytosis reveals distinct roles for Rubicon, NOX2 and autophagy proteins. Nat Cell Biol. 2015;17:893–906. doi: 10.1038/ncb3192. [DOI] [PMC free article] [PubMed] [Google Scholar] [Retracted]
- Muller WA, Steinman RM, Cohn ZA. Membrane proteins of the vacuolar system. III Further studies on the composition and recycling of endocytic vacuole membrane in cultured macrophages. J Cell Biol. 1983;96:29–36. doi: 10.1083/jcb.96.1.29. [DOI] [PMC free article] [PubMed] [Google Scholar]
- Otera H, Wang C, Cleland MM, Setoguchi K, Yokota S, Youle RJ, Mihara K. Mff is an essential factor for mitochondrial recruitment of Drp1 during mitochondrial fission in mammalian cells. J Cell Biol. 2010;191:1141–1158. doi: 10.1083/jcb.201007152. [DOI] [PMC free article] [PubMed] [Google Scholar]
- Pan X, Liu J, Nguyen T, Liu C, Sun J, Teng Y, Fergusson MM, Rovira II, Allen M, Springer DA, et al. The physiological role of mitochondrial calcium revealed by mice lacking the mitochondrial calcium uniporter. Nat Cell Biol. 2013;15:1464–1472. doi: 10.1038/ncb2868. [DOI] [PMC free article] [PubMed] [Google Scholar]
- Park D, Han CZ, Elliott MR, Kinchen JM, Trampont PC, Das S, Collins S, Lysiak JJ, Hoehn KL, Ravichandran KS. Continued clearance of apoptotic cells critically depends on the phagocyte Ucp2 protein. Nature. 2011;477:220–224. doi: 10.1038/nature10340. [DOI] [PMC free article] [PubMed] [Google Scholar]
- Park SJ, Lee H, Jo DS, Jo YK, Shin JH, Kim HB, Seo HM, Rubinsztein DC, Koh JY, Lee EK, et al. Heterogeneous nuclear ribonucleoprotein A1 post-transcriptionally regulates Drp1 expression in neuroblastoma cells. Biochim Biophys Acta. 2015;1849:1423–1431. doi: 10.1016/j.bbagrm.2015.10.017. [DOI] [PMC free article] [PubMed] [Google Scholar]
- Rothlin CV, Ghosh S, Zuniga EI, Oldstone MB, Lemke G. TAM receptors are pleiotropic inhibitors of the innate immune response. Cell. 2007;131:1124–1136. doi: 10.1016/j.cell.2007.10.034. [DOI] [PubMed] [Google Scholar]
- Ryan TA, Smith SJ, Reuter H. The timing of synaptic vesicle endocytosis. Proc Natl Acad Sci U S A. 1996;93:5567–5571. doi: 10.1073/pnas.93.11.5567. [DOI] [PMC free article] [PubMed] [Google Scholar]
- Schrijvers DM, De Meyer GR, Kockx MM, Herman AG, Martinet W. Phagocytosis of apoptotic cells by macrophages is impaired in atherosclerosis. Arterioscler Thromb Vasc Biol. 2005;25:1256–1261. doi: 10.1161/01.ATV.0000166517.18801.a7. [DOI] [PubMed] [Google Scholar]
- Shang W, Lu F, Sun T, Xu J, Li LL, Wang Y, Wang G, Chen L, Wang X, Cannell MB, et al. Imaging Ca2+ nanosparks in heart with a new targeted biosensor. Circ Res. 2014;114:412–420. doi: 10.1161/CIRCRESAHA.114.302938. [DOI] [PubMed] [Google Scholar]
- Thorp E, Cui D, Schrijvers DM, Kuriakose G, Tabas I. Mertk receptor mutation reduces efferocytosis efficiency and promotes apoptotic cell accumulation and plaque necrosis in atherosclerotic lesions of Apoe−/− mice. Arterioscler Thromb Vasc Biol. 2008;28:1421–1428. doi: 10.1161/ATVBAHA.108.167197. [DOI] [PMC free article] [PubMed] [Google Scholar]
- Thorp E, Tabas I. Mechanisms and consequences of efferocytosis in advanced atherosclerosis. J Leukoc Biol. 2009;86:1089–1095. doi: 10.1189/jlb.0209115. [DOI] [PMC free article] [PubMed] [Google Scholar]
- Vandivier RW, Henson PM, Douglas IS. Burying the dead: the impact of failed apoptotic cell removal (efferocytosis) on chronic inflammatory lung disease. Chest. 2006;129:1673–1682. doi: 10.1378/chest.129.6.1673. [DOI] [PubMed] [Google Scholar]
- Williams GS, Boyman L, Chikando AC, Khairallah RJ, Lederer WJ. Mitochondrial calcium uptake. Proc Natl Acad Sci U S A. 2013;110:10479–10486. doi: 10.1073/pnas.1300410110. [DOI] [PMC free article] [PubMed] [Google Scholar]
- Yoshimori T, Yamamoto A, Moriyama Y, Futai M, Tashiro Y. Bafilomycin A1, a specific inhibitor of vacuolar-type H(+)-ATPase, inhibits acidification and protein degradation in lysosomes of cultured cells. J Biol Chem. 1991;266:17707–17712. [PubMed] [Google Scholar]
- Zunino R, Braschi E, Xu L, McBride HM. Translocation of SenP5 from the nucleoli to the mitochondria modulates DRP1-dependent fission during mitosis. J Biol Chem. 2009;284:17783–17795. doi: 10.1074/jbc.M901902200. [DOI] [PMC free article] [PubMed] [Google Scholar]
Associated Data
This section collects any data citations, data availability statements, or supplementary materials included in this article.