

Summary
Adrenergic stimulation promotes lipid mobilization and oxidation in brown and beige adipocytes, where the harnessed energy is dissipated as heat in a process known as adaptive thermogenesis. The signaling cascades and energy-dissipating pathways that facilitate thermogenesis have been extensively described, yet little is known about the counter-balancing negative regulatory mechanisms. Here we identify a two-pore-domain potassium channel Kcnk3 as a built-in rheostat negatively regulating thermogenesis. Kcnk3 is transcriptionally wired into the thermogenic program by Prdm16, a master regulator of thermogenesis. Kcnk3 antagonizes norepinephrine-induced membrane depolarization by promoting potassium efflux in brown adipocytes. This limits calcium influx through voltage-dependent calcium channels and dampens adrenergic signaling, thereby attenuating lipolysis and thermogenic respiration. Adipose-specific Kcnk3 knockout mice display increased energy expenditure and are resistant to hypothermia and obesity. These findings uncover a critical K+-Ca2+-adrenergic signaling axis to dampen thermogenesis and maintain tissue homeostasis and reveal an electrophysiological regulatory mechanism of adipocyte function.
In brief
Putting the breaks on adipose thermogenesis takes a potassium channel to limit calcium flux.
Introduction
The balance between lipid storage and mobilization is key for maintaining energy homeostasis. Brown and beige adipose tissue are specialized to metabolize fuels and dissipate the stored chemical energy as heat through a process called adaptive thermogenesis (Harms and Seale, 2013). Adaptive thermogenesis has gained increasing attention for its potential to fight the epidemic of obesity and associated metabolic disorders including type 2 diabetes, hypertension and cardiovascular diseases (Chondronikola et al., 2016; Cummings et al., 1996; Kajimura and Saito, 2014; Yoneshiro et al., 2013). In the past few decades, transcriptional regulators, signaling cascades, and energy-dissipating pathways that facilitate thermogenesis have been extensively described, yet little is known about the counter-balancing negative regulatory mechanism employed specifically by the thermogenic adipose tissue (Harms and Seale, 2013). In principle, a feedback “braking” mechanism could be of great importance to help prevent hyperactive thermogenesis and maintain appropriate whole body energy homeostasis.
Changes in electrophysiological properties, including ion currents and membrane potentials, provide a fast and highly-controllable way to regulate cellular activities. While the importance of such changes in excitable cells, such as neurons, are well appreciated, their physiological significance in non-excitable cells is less explored. For the interscapular brown adipocytes, adrenergic stimulation-induced membrane potential changes, i.e. an initial depolarization followed by a subsequent repolarization, was described three decades ago, yet the molecular basis and functional significance of these changes have remained elusive (Fink and Williams, 1976; Horwitz et al., 1969). Expression profiling experiments have revealed that a two-pore-domain potassium (K2P) channel Kcnk3 (Task-1, K2P3.1) is highly expressed in brown and beige adipose tissue both in mice and in humans (Feliciangeli et al., 2015; Pisani et al., 2016; Shinoda et al., 2015; Svensson et al., 2011). In excitable cells, such as neurons and the glomerulosa cells of the adrenal gland, Kcnk3 mediates an acid-sensitive K+-selective non-inactivating leak current that hyperpolarizes the membrane and decreases the excitability of these cells (Davies et al., 2008; Duprat et al., 1997; Feliciangeli et al., 2015; Sirois et al., 2000). Given the non-excitable nature of adipocytes, the specific role of Kcnk3 and K+ currents in brown and beige adipocytes is intriguing. A previous publication by Pisani and colleagues claims that Kcnk3 acts as a positive regulator of thermogenesis through the mineralocorticoid receptor pathway (Pisani et al., 2016). However, the global kcnk3 knockout mice used in their study display systemic disorders including hyperaldosteronism, which could have complicating effects on the metabolism of adipose tissue (Davies et al., 2008; Marzolla et al., 2012). Thus, whether and how the thermogenic activities of brown and beige adipocytes are regulated by electrophysiological mechanisms remain unclear. Understanding such mechanisms will not only provide novel insights into adipocyte physiology but may also reveal new targets to develop anti-obesity therapies.
The thermogenic activity of brown and beige adipocytes is conferred by a core gene program controlled by the master transcriptional regulator PR domain containing 16 (Prdm16) (Seale et al., 2007). Mice lacking Prdm16 in adipose tissue display decreased thermogenic gene expression, lower energy expenditure and are more susceptible to obesity (Cohen et al., 2014; Harms et al., 2014); mice overexpressing Prdm16 in adipose tissue display the opposite phenotypes (Seale et al., 2011). Importantly, all known Prdm16 target genes in adipose tissue including Uncoupling protein 1 (Ucp1), are positive contributors to thermogenesis (Ohno et al., 2012; Seale et al., 2007). Here we identified the K2P channel Kcnk3 as a new target of Prdm16 in thermogenic adipose tissue (Duprat et al., 1997). Unexpectedly, Kcnk3 acts as a built-in “brake” for adaptive thermogenesis by limiting lipid mobilization in brown and beige adipose tissue. Mechanistically, Kcnk3 antagonizes norepinephrine-induced membrane depolarization by promoting K+ efflux from brown adipocytes. This limits calcium influx through voltage-dependent calcium channels and dampens cyclic-AMP production and PKA signaling, thereby attenuating lipolysis and thermogenic respiration. Adipose-specific deletion of Kcnk3 in mice allows adaptive thermogenesis to persist unchecked, which increases whole body energy expenditure rates and protects animals from hypothermia and diet-induced obesity. Our findings identify Kcnk3 as a critical rheostat for thermogenesis through a K+-Ca2+-adrenergic signaling axis that acts to maintain energy homeostasis, and reveals an electrophysiological regulation of adipocyte function.
Results
Kcnk3 Is a Direct Target of Prdm16 in the Thermogenic Adipose Tissue
To identify novel Prdm16 target genes as part of the thermogenic gene program, we performed Prdm16 ChIP-Seq analysis from brown adipose tissue (BAT) (Zeng et al., 2016). We detected prominent Prdm16 binding peaks in the promoter, intron and 3′ region of the K2P channel Kcnk3 (Figure 1A). The specificity of the ChIP experiment was supported by the selective binding of Prdm16 at its known targets, such as Ucp1, but not at Prdm16-independent genes, such as Elovl3 (Figure S1A) (Ohno et. al., 2012). Importantly, Kcnk3 expression level was significantly decreased in the BAT and the inguinal subcutaneous white adipose tissue (iWAT, a depot enriched with beige adipocytes) of the adipose-specific prdm16 knockout mice (Figure 1B). Further, Kcnk3 expression level was increased by 2-fold in the iWAT of adipose tissue-specific Prdm16 transgenic mice (Figure 1C) (Seale et al., 2011). Together, these data suggested that Kcnk3 expression is directly activated by Prdm16 in adipose tissue. Ribosomal profiling revealed that Kcnk3 expression level is much higher in brown and beige than white adipocytes (Figure 1D and 1E) (Long et al., 2014). Consistent with this, cold exposure (6–48 hours at 4 °C) strongly induced Kcnk3 express ion in BAT and iWAT, which was reversed after re-acclimation to room temperature (Figure 1F and 1G). Notably, a closely-related K2P channel Kcnk9, which co-expresses with Kcnk3 in many tissues (Feliciangeli et al., 2015), was not detected in the thermogenic adipocytes by ribosomal profiling (Table S1).
Figure 1. Kcnk3 is a Prdm16 Target Enriched in Thermogenic Adipocytes.

(A) Prdm16 ChIP-Seq peaks at the Kcnk3 locus.
(B) Kcnk3 qPCR in the BAT and iWAT of control and adipose-specific prdm16 knockout mice (Prdm16 KO); n=3 mice per group.
(C) Kcnk3 qPCR in in the BAT and iWAT of control and adipose-specific Prdm16 transgenic mice (aP2-Prdm16); n=4 mice per group.
(D–E) Kcnk3 expression level (normalized to Adiponectin level) shown by translating ribosomal affinity purification from (D) Adiponectin-positive cells (Adiponectin-TRAP) and (E) Ucp1-positive cells (Ucp1-TRAP); n=3 mice per group; eWAT, epididymal white adipose tissue.
(F) Kcnk3 expression levels in BAT and iWAT upon cold exposure for 4 hours and 2 days, respectively; n=3 mice per group.
(G) Kcnk3 expression levels in BAT and iWAT under cold exposure for 24 hours followed by 24-hour acclimation to room temperature; n=3 mice per group.
Data are represented as means ± SEM. *P < 0.05, **P < 0.01, ***P < 0.001. two-tailed Student’s t-test. See also Figure S1.
Kcnk3 Mediates Outward Potassium Currents in Brown Adipocytes
Kcnk3 is known to regulate membrane potential and the function of excitable cells, including neurons and the glomerulosa cells of the adrenal gland (Davies et al., 2008; Feliciangeli et al., 2015; Sirois et al., 2000). Our finding that Kcnk3 expression is activated by Prdm16 in non-excitable thermogenic adipocytes raised an intriguing possibility that Kcnk3 might regulate thermogenic activity through modulating plasma membrane potential. To investigate if Kcnk3 has any effect on thermogenesis, we generated adipose tissue-specific kcnk3 knockout mice (Adiponectin-cre kcnk3fl/fl, hereby named AdK3KO). Kcnk3 transcripts were dramatically reduced in the BAT and iWAT but not in the brain of AdK3KO mice, compared to kcnk3fl/fl littermate controls (Figure 2A). Using patch-clamp techniques, we recorded outward currents under voltage-clamp conditions in freshly-isolated brown adipocytes (Figure 2B). The outward currents recorded from kcnk3-deficient brown adipocytes were significantly lower (~48% at +30 mV) than those from the control cells (Figure 2B and 2C), suggesting a fraction of the outward current is contributed by K+ flux via Kcnk3. We observed a similar magnitude of decrease (~36% at +30 mV) in currents in mature brown adipocytes freshly isolated from the global kcnk3 knockout mice (Figure 2D) (Mulkey et al., 2007), in support of a near-complete absence of Kcnk3 from brown adipocytes in our conditional knockout mice.
Figure 2. Kcnk3 Mediates Outwards Potassium Currents in Brown Adipocytes.

(A) Kcnk3 qPCR in different tissues of control and AdK3KO mice; n=4 mice per group.
(B) Representative outward current traces in control and kcnk3-deficient (AdK3KO) brown adipocytes.
(C) Outward currents in control (n=6) and kcnk3-deficient (n=8, from AdK3KO mice) brown adipocytes represented by peak amplitude (I)–voltage (V) relationship (maximal of first 500 ms) and steady-state amplitude (I)–voltage (V) relationship (2000–2500 ms).
(D) Outward currents in brown adipocytes from control (n=4) and kcnk3-deficient (n=6, from global kcnk3 knockout mice) brown adipocytes represented by steady-state amplitude (I)–voltage (V) relationship (2000–2500 ms).
(E) Representative outward current traces at pH 6.4, 7.4 and 8.4 in control and kcnk3-deficient (from AdK3KO mice) brown adipocytes differentiated in vitro. Hold potential is at +30 mV.
(F) The Acid-sensitive current component, as a percentage of total outward currents, in control (n=10) and kcnk3-deficient (AdK3KO, n=5) brown adipocytes differentiated in vitro. Hold potential is at +30 mV.
Data are represented as means ± SEM. *P < 0.05, ***P < 0.001, two-tailed Student’s t-test. See also Figure S1.
Previous publications have established that Kcnk3 mediated K+ current is acid-sensitive (i.e., inhibited at low external pH within the physiological range) (Duprat et al., 1997). To further demonstrate that Kcnk3 mediates a component of the outward currents in brown adipocytes, we performed voltage clamp recordings on brown adipocytes differentiated in vitro at pH 6.4, 7.4 and 8.4, as these cells were more stable during repeated perfusions with external buffers with different pH values. Indeed, we observed a significant acid-sensitive component of the outward currents at +30 mV in control brown adipocytes, which is completely absent in kcnk3-deficient cells (Figure 2E and 2F). The acid-sensitive current component (~10%) in brown adipocytes differentiated in vitro appeared to be smaller than the difference (~36–48%) between outward currents recorded from freshly-isolated control and kcnk3-deficient brown adipocytes, possibly due to the much lower (63% lower) expression level of Kcnk3 in brown adipocytes differentiated in vitro than in vivo (Figure S1B). Taken together, our data support the conclusion that Kcnk3-mediated K+ flux is a component of the outward currents in brown adipocytes.
Kcnk3 Negatively Regulates Thermogenesis by Dampening the Canonical Adrenergic Signaling Pathway
In the BAT and iWAT of AdK3KO mice, the tissue morphology and expression levels of thermogenic and mitochondrial genes did not differ from those of wildtype littermate controls (Figure S2A–E), suggesting that Kcnk3 is not directly required for brown and beige fat formation. We then asked whether deletion of Kcnk3 affects the thermogenic activity of brown adipocytes.
The best-characterized signaling pathway for adipose thermogenesis is that initiated by the sympathetic neurotransmitter norepinephrine (NE) (Carmen and Victor, 2006; Harms and Seale, 2013). To determine whether Kcnk3 plays a role in adipose thermogenesis, we measured NE-induced thermogenic respiration rates using a CLARK-type electrode in control and kcnk3-deficient brown adipocytes. To best conserve the in vivo characteristics of brown adipocytes, we used mature adipocytes freshly isolated from control and AdK3KO mice in all the cellular experiments. kcnk3-deficient brown adipocytes showed significantly higher NE-induced respiration rates, indicating increased thermogenic activity (Figure 3A). These results suggest that Kcnk3 is a negative regulator of adipose thermogenesis transcriptionally controlled by Prdm16.
Figure 3. Kcnk3 Negatively Regulates Thermogenesis by Dampening NE-induced cAMP Production.

(A) Representative oxygen consumption traces and quantification of respiration rates in in control and kcnk3-deficient brown adipocytes. Induced, NE rates minus Basal rates.
(B) Lipolysis rates (amount of glycerol released per min) of brown adipocytes under different concentrations of NE stimulation.
(C) Western blot of HSL phosphorylation in NE-stimulated control and kcnk3-deficient brown adipocytes.
(D) Lipolysis rates of white adipocytes from the epididymal WAT.
(E) Cyclic-AMP levels, (F) Lipolysis rates and (G) HSL phosphorylation levels of control and kcnk3-deficient brown adipocytes treated with NE and IBMX as indicated. Cells were pooled from 10 mice and 3 replicate measurements were taken per experiment. Data are represented as means ± SEM of 3 measurements. *P < 0.05, **P < 0.01, ***P < 0.001. two-tailed Student’s t-test. Each experiment was repeated at least 3 times. See also Figure S2 and S3.
NE drives lipolysis via the canonical adrenergic receptor-cyclic AMP (cAMP)-Protein Kinase A (PKA) pathway (Carmen and Victor, 2006). Lipolysis is essential for adipose tissue thermogenesis, as the fatty acids released from NE-induced lipolysis serve as both obligatory activators for UCP1 and metabolic substrates fueling thermogenic respiration (Blondin et al., 2017; Fedorenko et al., 2012; Harms and Seale, 2013). We therefore assessed whether the increased respiration rates in kcnk3-deficient cells could be explained by a stronger lipolytic response to NE. Indeed, the lipolysis rate (amount of glycerol released after NE stimulation) in kcnk3-deficient brown adipocytes was significantly increased compared to control cells (Figure 3B). Further, kcnk3-deficient brown adipocytes showed increased levels of HSL phosphorylation at two classic PKA activation sites Ser563 and Ser660 after NE simulation (Figure 3C), indicating increased PKA activation (Carmen and Victor, 2006). We also detected increased PKA activation in kcnk3-deficient brown adipocytes using a pan-PKA substrate antibody that recognizes the RRXS/T motif (Figure S2F). Together, these results provide genetic evidence that Kcnk3 acts as a negative regulator of PKA activation, lipolysis and thermogenic respiration. Importantly, lipolysis rates of white adipocytes isolated from the epididymal WAT depot of AdK3KO mice, where little Kcnk3 expression was detected (Figure 1D), were not different from control (Figure 3D). Moreover, the increased NE-induced lipolysis rates and HSL phosphorylation were also observed in brown adipocytes isolated from brown and beige adipose-specific kcnk3 knockout mice (Ucp1-cre kcnk3fl/fl) (Figure S2G and S2H) (Kong et al., 2014). These data indicate that the phenotypes of increased lipolysis and thermogenic respiration reflect ablation of Kcnk3 specifically in thermogenic adipocytes.
We next investigated whether the increased level of PKA activation observed in kcnk3-deficient cells is a result of higher cAMP levels. Indeed, cellular cAMP levels after NE stimulation in kcnk3-deficient brown adipocytes increased by ~100%, compared to control cells (Figure 3E). To distinguish whether the increased cAMP levels in kcnk3-deficient brown adipocytes was due to increased production by Adenylyl Cyclase or decreased hydrolysis by Phosphodiesterase (PDE), we measured cAMP levels in brown adipocytes in the presence of a pan-PDE inhibitor Isobutylmethylxanthine (IBMX) (Carmen and Victor, 2006). As expected, IBMX dramatically boosted cAMP levels, indicating strong PDE inhibition. Under this condition, kcnk3-deficient brown adipocytes still showed 2-fold higher cAMP levels than control cells (Figure 3E), accompanied by increased lipolysis rates and HSL phosphorylation (Figure 3F and 3G). These results strongly suggest that Kcnk3 dampens cAMP production and thus, negatively regulates PKA activation. This enhanced cAMP production phenotype was not directly caused by increased levels of components of the adrenergic signaling pathway, as we did not detect any changes in the levels of adrenergic receptors or GSα in kcnk3-deficient brown adipocytes (Figure S3A and S3B).
In addition to classic BAT, beige adipocytes that emerge within the white adipose tissue upon cold stimulation also have a high thermogenic capacity. As Kcnk3 was expressed in both brown and beige adipocytes (Figure 1E), we investigated whether Kcnk3 plays a similar role in beige adipocytes as in brown adipocytes, using mature adipocytes isolated from the inguinal adipose tissue of cold-adapted control and AdK3KO mice. Indeed, upon NE stimulation, kcnk3-deficiently beige adipocytes showed increased cAMP production, higher level of HSL phosphorylation by PKA and increased lipolysis rates compared to control cells, supporting a similar role as in brown adipocytes (Figure S3C–E). The effect of kcnk3 ablation on beige adipocytes were smaller than that on interscapular brown adipocytes, likely due to varied Kcnk3 expression levels in this heterogeneous cell population.
Kcnk3 Antagonizes NE-induced Membrane Depolarization and Ca2+ Influx to Dampen cAMP Production
In neurons, outward K+ leak currents hyperpolarize the membrane potential (Vm), which may, by limiting Ca2+ influx via voltage-dependent calcium channels (VDCCs), reduce intracellular Ca2+ levels ([Ca2+]i) (Catterall, 2011; Ehling et al., 2011; Lazarenko et al., 2010; Sirois et al., 2000). An increase in [Ca2+]i promotes cAMP production in cells, possibly by directly stimulating Adenylyl Cyclase activity (Maus et al., 2017; Wong et al., 1999). We therefore asked whether Kcnk3 dampens cAMP production by modulating the Vm and [Ca2+]i in brown adipocytes. We first tested whether Kcnk3 ablation results in membrane depolarization and increased Ca2+ influx. Upon NE stimulation, we found in current clamp recordings that the membrane potential of kcnk3-deficient brown adipocytes was more depolarized relative to that in control cells during the initial depolarization phase (peak post-NE Vm) and the subsequent repolarization phase (average post-NE Vm, Figure 4A and 4B), changes consistent with the reduced outward currents observed under voltage clamping conditions (Figure 2C). It is notable that we did not observe a significant difference in the resting Vm between control and kcnk3-deficient brown adipocytes.
Figure 4. Kcnk3 Dampens cAMP Production by Limiting NE-induced Ca2+ Entry Through VDCCs.

(A) Representative traces of NE-induced membrane potential (Vm) changes in brown adipocytes. NE, 1 μM.
(B) Vm of brown adipocytes before and after 1 μM NE stimulation. Basal Vm, 50 s average before NE; NE-peak Vm, maximum depolarization after NE; NE-average Vm,120 s average post peak depolarization; n=7 cells per group.
(C) Fluo-4 signal in brown adipocytes before & after NE stimulation, scale bar 40 μm.
(D) Averaged Fluo-4 intensity trace (normalized to intensity at 0 min) of control and kcnk3-deficient brown adipocytes in normal or Ca2+-free buffer before & after NE stimulation; n=30 cells per group.
(E) cAMP production and (F) Lipolysis rates in control and kcnk3-deficient brown adipocytes in normal and Ca2+-free buffer.
(G) Averaged Fluo-4 intensity trace (normalized to intensity at 0 min) of control and kcnk3-deficient brown adipocytes before & after NE stimulation treated with VDCC inhibitors (VDCCi): L651, 582 (1 μM, L-type VDCC inhibitor) and ω-Agatoxin TK (1 μM, P/Q-type VDCC inhibitor); n=21 cells per group.
(H) cAMP production (cAMP accumulation in a 5-min window) in control and kcnk3-deficient brown adipocytes in normal Ca2+ buffer treated with L651, 582 (1 μM) and ω-Agatoxin TK (1 μM), as indicated.
Data are represented as means ± SEM. *P < 0.05, **P < 0.01, ***P < 0.001. (B) and (E)-(H), two-tailed Student’s t-test; (D) and (G), two-way ANOVA. In (E)–(H), Cells were pooled from 10 mice and 3 replicate measurements were taken per experiment. Each experiment was repeated at least 3 times. (E) and (H), cAMP production was measured in a 5-minitue time window. See also Figure S4.
Next, the Fluo-4 AM Ca2+ indicator was used to monitor real-time [Ca2+]i changes in brown adipocytes (Bootman et al., 2013). Consistent with previous reports (Bronnikov et al., 1999; Hayato et al., 2011), we observed a robust increase in [Ca2+]i upon NE stimulation (Figure 4C). Importantly, this NE-induced increase in [Ca2+]i was much greater in kcnk3-deficient brown adipocytes than in control cells (Figure 4D and S4A), suggesting that Kcnk3 ablation enhances the NE-induced increase in [Ca2+]i. To determine whether the increased [Ca2+]i observed in kcnk3-deficient cells could be explained by increased influx of extracellular Ca2+, we repeated the experiment in Ca2+-free external buffer. The NE-induced increase in [Ca2+]i in control cells was much smaller in Ca2+-free buffer than in normal Ca2+ buffer (Figure 4D and S4A). Strikingly, the differences in the [Ca2+]i increases induced by NE between kcnk3-deficient and control cells were completely abolished in Ca2+-free buffer (Figure 4D and S4A), demonstrating that Kcnk3 negatively modulates Ca2+ influx.
To test whether the modulation of Ca2+ influx by Kcnk3 is functionally linked to cAMP production, we measured NE-induced cAMP production by brown adipocytes in Ca2+-free buffer. Ca2+-free buffer nearly abolished the cAMP over-production phenotype in kcnk3-deficient cells (Figure 4E), strongly suggesting that Kcnk3 dampens cAMP production by limiting Ca2+ influx. Consistent with this, the difference in lipolysis rates between kcnk3-deficient and control cells was also dramatically reduced in Ca2+-free buffer (Figure 4F). Finally, we observed similar results when cells were treated with an intracellular Ca2+ chelator BAPTA-AM (Figure S4B) (Bootman et al., 2013), further demonstrating the link between [Ca2+]i and cAMP production in brown adipocytes.
Lastly, we tested whether Kcnk3 ablation promotes cAMP production by increasing Ca2+ influx via VDCCs. The most abundantly expressed VDCCs in brown adipocytes include an L-type channel Cav1.3 and a P/Q-type channel Cav2.1, as revealed by ribosomal profiling (Figure S4C) (Catterall, 2011). We first measured increase in [Ca2+]i upon NE stimulation in the presence of L- and P/Q-type VDCC inhibitors (L651, 582 for L-type and ω-Agatoxin TK for P/Q-type) (Hupe et al., 1991; Teramoto et al., 1993). Similar to the effect of Ca2+-free buffer, the differences in the NE-induced [Ca2+]i increase between kcnk3-deficient and control cells were largely abolished in the presence of both inhibitors (Figure 4G). Moreover, the cAMP over-production phenotype in kcnk3-deficient brown adipocytes was greatly attenuated (Figure 4H and S4D), and the difference in the lipolysis rates between kcnk3-deficient and control cells was also significantly reduced by the treatment of VDCC inhibitors (Figure S4E). These data show that Kcnk3 attenuates NE-induced cAMP production and PKA activation by reducing membrane depolarization and restricting Ca2+ entry through VDCCs.
Kcnk3 Negatively Regulates Adipose Tissue Thermogenesis in vivo
Because Kcnk3 negatively regulates thermogenesis at the cellular level, we studied the physiological function of this channel in vivo using the AdK3KO mice. To directly assess the animals’ brown fat activity, an implanted temperature probe was used to measure BAT temperature in control and AdK3KO mice challenged with cold exposure (4 °C). Notably, AdK3KO mice showed higher BAT temperature during the cold challenge, indicating higher thermogenic activity (Figure 5A). Consistent with this, AdK3KO mice also display higher core body temperature during cold exposure, though no significant difference in body temperature was observed at regular housing conditions (20–22 °C, Figure S5A and S5B). On chow diet, the energy expenditure rates of AdK3KO mice, as determined by indirect calorimetry, displayed a slight, albeit statistically insignificant, increase compared with the control (Figure 5B and S5C). This increase was significantly larger after selective β3-adrenergic stimulation (CL 316,243 injection), strongly pointing to an elevated brown and beige fat activation (Figure 5C and S5C). Consistent with the changes in isolated mature brown adipocytes, we detected increased levels of HSL phosphorylation in the BAT of AdK3KO mice compared to the control after acute CL 316, 243 injection (Figure 5D). No significant differences in physical movement or food intake were recorded (Figure S5D and S5E).
Figure 5. Kcnk3 Negatively Regulates Adipose Thermogenesis in vivo.

(A) BAT temperatures measured with probes implanted in the interscapular region of single-housed mice upon transition from 30 °C to 4 °C; n=8 mice per group.
(B) Energy expenditure rates (VO2 and VCO2) of chow-fed mice under basal conditions; n=7 mice per group.
(C) Energy expenditure rates (VO2 and VCO2) of chow-fed mice after CL316, 243-injection (1 mg/kg); n=7 mice per group.
(D) Western blot of HSL phosphorylation in BAT from control and AdK3KO mice 20 min after CL316, 243-injection (10 mg/kg). n=4 mice per group.
Data are represented as means ± SEM *P < 0.05, **P < 0.01, ***P < 0.001. (A), two-tailed Student’s t-test; (B) and (C), two-way ANOVA. Each experiment was repeated at least twice. See also Figure S5 and S6.
To definitively demonstrate the phenotypes observed in AdK3KO mice was indeed caused by the loss of Kcnk3. We performed rescue experiments using a Cre-dependent Adeno-associated viral (AAV) vector that expressed Kcnk3 specifically in the BAT (Figure S6A) (Saunders et. al., 2012). Kcnk3 mRNA level in the BAT of AdK3KO mice was restored to a similar level as wildtype BAT after AAV injection to the BAT (Figure S6B). At the cellular level, restoration of Kcnk3 expression in kcnk3-deficient brown adipocytes decreased cAMP production and lipolysis rates (Figure S6C and S6D). In vivo, restoration of Kcnk3 expression in the BAT attenuated the increased energy expenditure rates under adrenergic stimulation in AdK3KO mice, as determined by indirect calorimetry (Figure S6E). Taken together, these results strongly support the conclusion that Kcnk3 negatively regulates BAT thermogenesis in vivo.
Having established that conditional ablation of Kcnk3 enhances the activity of brown and beige adipose tissues and whole body energy expenditure, we next investigated whether the AdK3KO mice are protected from diet-induced obesity, a pathological model of type 2 diabetes. When challenged with a high-fat diet (HFD), AdK3KO mice gained significantly less weight (up to 10%) than littermate control mice (Figure 6A). MRI analysis revealed that AdK3KO mice accumulated less fat mass on HFD with lean mass unaffected (Figure 6B). The reduced weight gain displayed by AdK3KO mice could be explained by the significantly increased energy expenditure rates recorded even before the divergence of the body weight (Figure 6C, 6D and S7A). Again, no significant differences in physical movement or food intake were recorded (Figure S7B and S7C). AdK3KO mice also displayed additional metabolic benefits, including improved glucose tolerance and greatly alleviated liver steatosis (Figure 6E and 6F). Individual brown adipocytes in the BAT of AdK3KO mice showed distinctly less lipid accumulation compared to control mice following HFD feeding (Figure 6F), while no obvious changes were observed in the morphology of the white adipocytes from the inguinal and epididymal WAT depots (Figure S7D).
Figure 6. Ablating Kcnk3 from Adipose Tissue Protects Mice from Diet-induced Obesity.

(A) Male and female mice body weight curves on HFD; n=7 mice per group.
(B) Fat and lean mass of HFD-fed male mice; n=7 mice per group.
(C) Energy expenditure rates (VO2 and VCO2) of HFD-fed mice under basal conditions; n=7 mice per group.
(D) Energy expenditure rates (VO2 and VCO2) of HFD-fed mice after CL316, 243-injection (1 mg/kg); n=6 mice per group.
(E) Blood glucose levels of HFD-fed male mice; Control, n=7; AdK3KO, n=6.
(F) H&E staining of liver and BAT of HFD-fed control and AdK3KO mice following 14-weeks of HFD feeding. Scale bar, 200 μm.
Data are represented as means ± SEM *P < 0.05, **P < 0.01. (B) and (E) two-tailed Student’s t-test; (A), (C) and (D), two-way ANOVA. Each experiment was repeated at least twice. See also Figure S7.
We conclude that Kcnk3 is a negative regulator of adipose thermogenesis in vivo and genetic ablation of Kcnk3 protects the animals from hypothermia and obesity.
Discussion
Kcnk3 Acts as a Built-in Rheostat for Thermogenesis
Thermogenic pathways protect animals from hypothermia and obesity, and much current scientific interest in these pathways derives from the latter action. On the other hand, adaptive thermogenesis has the potential to waste caloric energy and therefore had to be carefully regulated during evolution (Petruzzelli and Wagner, 2016). Little is known about the mechanisms of negative regulation of thermogenesis employed specifically by the brown and beige adipocytes (Harms and Seale, 2013). We now show that the K2P channel Kcnk3 acts as a “rheostat” that curbs adipose thermogenesis. The expression of Kcnk3 is transcriptionally wired into the thermogenic program by Prdm16 and increases upon cold-exposure in a Prdm16-dependent manner. In addition, as Kcnk3 mediates a K+-selective leak current, the initial membrane depolarization induced by NE increases K+ efflux through Kcnk3, which in turn antagonizes the depolarization and drives the subsequent repolarization to trigger the feedback brake on thermogenesis (Figure 7). Essentially, Kcnk3 functions as a built-in “rheostat” on energy expenditure in thermogenic adipocytes, potentially fine tuning these processes and hence, conferring a survival advantage to animals when food is limiting. Selectively ablating Kcnk3 in adipocytes allows lipolysis and thermogenesis to persist unchecked and could potentially lead to unwanted energy spending. This rheostat mechanism highlights the importance of balancing lipid storage and mobilization to maintaining energy homeostasis, especially in metabolically active thermogenic adipose tissue.
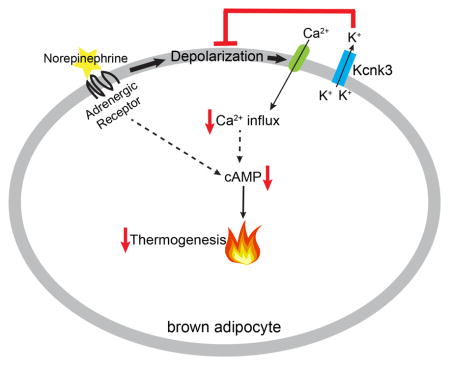
Figure 7. A Model Showing How Kcnk3-Mediated K+ Currents Regulate Thermogenesis in Brown Adipocytes.

Kcnk3 mediates outward K+ flux, which antagonizes NE-induced membrane depolarization. This limits calcium influx through voltage-dependent calcium channels (VDCCs) and limits adrenergic signaling, thereby attenuating lipolysis and thermogenesis.
In addition to regulating energy expenditure, Kcnk3 could also help maintain ion homeostasis in thermogenic adipocytes. Besides promoting cAMP production, Ca2+ can alter mitochondrial outer membrane permeability, which promotes cytochrome c release and triggers apoptosis (Mattson and Chan, 2003). Given that brown adipocytes have particularly high amounts of mitochondria, it is conceivable that by restricting Ca2+ influx, Kcnk3 prevents Ca2+ overload, unwanted mitochondrial damage and cell death. Whether the loss of Kcnk3 renders brown adipocytes more susceptible to mitochondrial damage and cell death, especially under long-term cold exposure, warrants further investigation.
Kcnk3 Regulates Thermogenesis Through Electrophysiology
Regulation of electrophysiological properties provides an efficient way to control cellular activities in excitable cells, yet the physiological significance of this type of regulation is less explored in non-excitable cells, such as adipocytes. Although previous studies have described membrane potential changes in brown adipocytes upon NE treatment, its molecular basis and functional relevance remained unclear (Fink and Williams, 1976; Horwitz et al., 1969). Our data provide evidence that Kcnk3-mediated K+ current antagonizes the NE-induced initial depolarization and drives subsequent repolarization. More importantly, we show that functionally, Kcnk3-mediated K+ current reduces NE-induced depolarization to restrict VDCC-mediated Ca2+ influx, thus dampening the production of cAMP, the classical signaling molecule in adipose thermogenesis (Figure 7). By revealing this K+-Ca2+-adrenergic signaling axis, we have elucidated an electrophysiological regulatory pathway operating in non-excitable adipocytes.
The current-voltage relationship of the Kcnk3-mediated current (i.e., the difference between outward currents in control and kcnk3-deficient cells at the same holding potential as in Figure 2B–2D) that we recorded from brown adipocytes was largely consistent with previously established characteristics of Kcnk3 as a leak channel in other cell types (Duprat et al., 1997; Mulkey et al., 2007). The apparent outward rectification of the Kcnk3-mediated current was a result of an asymmetrical K+ concentration across the plasma membrane (5 mM extracellular K+ and 145 mM intracellular K+) and fitted as expected (Durpat et al., 1997) closely to the Goldman-Hodgkin-Katz equation (Figure S1C). However, the Kcnk3-mediated current in brown adipocytes also showed some characteristics different from previous recordings obtained from other cell types. For instance, the outward currents in brown adipocytes appeared to show a time-dependent inactivation (Figure 2B–2D), which is not a known feature of Kcnk3-mediated currents (Duprat et al., 1997). To evaluate the actual degree of inactivation of the outward current in brown adipocytes we calculated the difference between the peak amplitude and the steady state mean amplitude for each cell. From this we found that the degree of inactivation of control cells was not significantly higher than that of kcnk3-deficient cells (Figure S1D), suggesting that the inactivating component of the outward current was not predominantly mediated by Kcnk3. Albeit statistically insignificant, there was a slight trend suggesting that Kcnk3-mediated current might indeed show a small degree of inactivation (Figure S1D). As most of the cellular volume of adipocytes is taken up by lipid droplets and the cytoplasm only accounts for a scant proportion, it is possible that the kinetics of ion diffusion in adipocytes in consequence may be quite different from other cell types, which could result in minor differences in certain aspects of the recorded profiles. Given the many unusual and unique features of adipocytes, it is not surprising that the characteristics of Kcnk3 current in these cells are subtly different from previous results obtained from other cell types. These interesting differences should inspire further investigations.
The channel activity of K2P channels can be regulated by multiple mechanisms (Feliciangeli et al., 2015; Mathie, 2007). In addition to inhibition at low pH, the activities of K2P channels can be modulated by several G-protein coupled receptor pathways (Mathie, 2007). For instance, it has been reported that Kcnk3 is inhibited following activation of the G-protein Gαq in a diacylglycerol-dependent but PI(4,5)P2, IP3 and Ca2+-independent manner (Wilke et al., 2014). Moreover, the carboxyl-terminal segment of Kcnk3 harbors multiple regulatory consensus sites, such as phosphorylation sites by protein kinase C and PKA, as well as for tyrosine phosphorylation (Mathie, 2007). It is therefore conceivable that the activity of Kcnk3 in brown and beige adipose tissue may be regulated by additional mechanisms (e.g., post-translational modifications) besides transcription, and some of these regulations may help “dial back” the brake on thermogenesis. It would be of great interest in future studies to identify additional regulatory mechanisms of Kcnk3 activity in the context of adipose thermogenesis.
Although Kcnk3 is the most abundant K+ channel expressed in thermogenic adipocytes at the mRNA level, as shown by Ribosomal Profiling (Table S1), our data clearly indicated that there is a substantial fraction (~50–70%) of the outward currents that cannot be ascribed to Kcnk3 (see Figure 2). It is possible that this additional fraction is mediated by additional K+ channels of which the mRNA levels are far less abundant than Kcnk3. Alternatively, this fraction could be inward chloride (Cl−) flux via Cl− channels (Bentley et al., 2014). In our recordings, we also observed that the baseline current at the holding potential (−60 mV) shifted in a pH-dependent manner (Figure 2E). These pH-sensitive baseline currents could not be attributed to Kcnk3, as we found no statistically significant difference in the magnitude of the pH-dependent baseline shifts between control and kcnk3-deficient cells (Figure S1E). While these baseline currents could be mediated by other pH-sensitive channels, they should not confound the detection of the acid-sensitive Kcnk3 current at +30 mV, which is only present in control but not kcnk3-deficient cells. The exact nature of these unidentified currents in brown adipocytes and their physiological relevance to thermogenesis remains to be elucidated.
Kcnk3 Negatively Regulates Thermogenesis Without Altering Thermogenic Gene Expression
Our findings are inconsistent with two previous reports investigating the function of Kcnk3 in the thermogenic adipocytes: Pisani et al., and Shinoda et al. Pisani and colleagues claimed Kcnk3 to be a positive regulator of adipose thermogenesis based on characterizing a global kcnk3 knockout mouse model. The global kcnk3 knockout mice are known to display systemic abnormalities, which could have complicating effects on adipose tissue metabolism (Davies et al., 2008; Marzolla et al., 2012), while our adipose tissue-specific knockout mice have normal aldosterone levels and normal Kcnk3 expression in the brain (Figure 2A and S1F). In Shinoda et al., the authors used siRNA to knockdown Kcnk3 in differentiated mouse beige adipocytes and observed reduced levels of thermogenic gene expression. We have carefully examined the levels of thermogenic genes in both the tissue and the brown and beige adipocytes differentiated in vitro from control and AdK3KO mice but did not observe any significant differences (Figure S2B–S2E). We therefore concluded that Kcnk3 is not required for thermogenic gene expression in brown or beige adipocytes.
Multiple lines of evidence support our conclusion that Kcnk3 acts as a negative regulator of thermogenesis. First, we used an adipose-tissue specific kcnk3 knockout mouse model, which is a more specific genetic model than those used in the previous studies. Second, we performed a series of cellular experiments to demonstrate increased thermogenic activity in kcnk3-deficient brown adipocytes, including increased cAMP production, PKA signaling, lipolysis rates and ultimately thermogenic respiration rates. Third, we systematically characterized the AdK3KO mice in vivo with multiple assays (BAT and core body temperature, indirect calorimetry, body weight and composition analyses on chow and HFD etc.). Lastly, the phenotype of AdK3KO mice was rescued by restoring Kcnk3 expression specifically in brown adipocytes, confirming that the phenotype is a consequence of adipose-specific ablation of Kcnk3. The results of all those experiments support that Kcnk3 acts as a negative regulator of thermogenesis and energy expenditure.
Implications in Human Brown/Beige Fat Biology
KCNK3 is highly expressed in the human brown and beige fat (Shinoda et al., 2015; Svensson et al., 2011) and the KCNK3 locus was identified as being associated with BMI in humans in a recent GWAS study (Shungin et al., 2015), suggesting it may play a role in regulating energy metabolism in humans. Based on our study, it is reasonable to propose that pharmacological antagonism of KCNK3 may be a strategy for activating thermogenic adipocytes in humans. Several compounds have been shown to inhibit KCNK3 channel activity in neurons and cardiomyocytes (Flaherty et al., 2014; Mathie and Veale, 2007; Wiedmann et al., 2016). Whether KCNK3 inhibition can be achieved with sufficient selectivity and safety to stimulate thermogenesis without eliciting the significant complications seen in the global knockout animals remains to be determined.
STAR Methods
CONTACT FOR REAGENT AND RESOURCE SHARING
Further information and requests for resources and reagents should be directed to and will be fulfilled by the Lead Contact, Bruce M Spiegelman (bruce_spiegelman@dfci.harvard.edu).
EXPERIMENTAL MODEL AND SUBJECT DETAILS
In vivo Animal Studies
Animal experiments were performed per procedures approved by the Institutional Animal Care and Use Committee of the Beth Israel Deaconess Medical Center. Kcnk3flox mice (kcnk3 fl/fl) and Kcnk3 whole-body knockout mice (kcnk3−/−) were obtained from Dr. Douglas Bayless at University of Virginia (Lazarenko et al., 2010). The Adiponectin-Cre mice and C57BL6/J mice were acquired from The Jackson Laboratory (028020 and 000664). The aP2-Prdm16 mice were maintained in the Spiegelman laboratory (Seale et al., 2011). The Ucp1-cre mice and NuTRAP mice were obtained from Dr. Evan Rosen at Beth Israel Deaconess Medical Center (Kong et al., 2014 and Roh et al., 2017). All strains were on the C57BL6 background. Unless otherwise stated, mice were housed in a temperature-controlled (20–22°C) room on a 12-hour light/dark cycle. Experiments were performed with sex- and age-matched adipose-specific kcnk3 knockout and littermate control mice 8–12 weeks of age.
Primary Adipocyte Culture
Freshly isolated (see below for isolation method) brown adipocytes were suspended in culture media (DMEM/F-12 Glutamax, Thermo Fischer Scientific 10565018 +10% FBS) in 48-well or 24- well plates. Type IV-collagen coated coverslips were placed on top of each well in direct contact with the floating adipocytes to allow attachment for more than 6 hours. The coverslips with cells attached were then placed in 35mm-culture dishes in culture media for patch-clamping or calcium-imaging on the following day.
Pre-adipocytes Culture and In Vitro Differentiation
Stromal Vascular Fraction (SVF, see below for isolation method) containing preadipocytes was cultured and differentiated in media (DMEM/F-12 Glutamax, Thermo Fischer Scientific 10565018 +10% FBS) in 10 cm plates. Media was changed every other day.
METHOD DETAILS
Gene Expression Analysis
Total RNA from cultured cells or tissues was isolated using TRIzol (Thermo Fischer Scientific) along with QIAGEN RNeasy mini kits. For qPCR analysis, RNA was reverse transcribed using the ABI high capacity cDNA synthesis kit. cDNA was used in qPCR reactions containing SYBR-green fluorescent dye (ABI). Relative mRNA expression was determined by normalization with TBP levels using the ΔΔ Ct method. Primer sequences are shown in Table S2. The Prdm16 ChIP-Seq dataset and UCP1-TRAP dataset were published previously (Long et al., 2014; Zeng et al., 2016).
Adiponectin-cre TRAP dataset generation
NuTRAP mice (Roh et al., 2017) was crossed to Adiponectin-cre mice (Jax 028020) to achieve adipocyte-specific expression of the tagged ribosomes. Small pieces (50–100 mg) of frozen brown, inguinal white and epididymal white adipose tissues were Dounce homogenized in 4 mL homogenization buffer (50 mM Tris [pH 7.5], 12 mM MgCl2, 100 mM KCl, 1% NP-40, 100 mg/mL cycloheximide, 1 mg/mL sodium heparin, 2mMDTT, 0.2 U/mL RNasin, and 1x Complete EDTA- free protease inhibitor; Roche). After centrifugation at 13,000 rpm for 10 min, the lipid layer was removed and the supernatant was collected and incubated with anti-GFP antibody (5 mg/mL; Abcam, ab290) for 1 hr at 4 °C. Protein G dynabeads were washed twice in low-salt wash buffer (50 mM Tris [pH 7.5], 12 mM MgCl2, 100 mM KCl, 1% NP-40, 100 mg/mL cycloheximide, and 2 mM DTT), added to the homogenates with antibody, and subsequently incubated for 30 min. Dynabeads with immunoprecipitates were washed three times in high- salt wash buffer (50 mM Tris [pH 7.5], 12 mM MgCl2, 300 mM KCl, 1% NP-40, 100 mg/mL cycloheximide, and 2mMDTT). Following the last wash, RLT buffer with b-mercaptoethanol was added to dynabeads, and RNA was extracted using a QIAGEN Micro RNeasy kit per the manufacturer’s instructions. Isolated RNA was quantified by Qubit, and RNA integrity was analyzed using an Agilent Bioanalyzer.
Extracted RNA (100 ng) was processed for rRNA removal using the Epicenter rRNA depletion kit per the manufacturer’s instructions. rRNA-depleted RNA was subsequently used to generate single-end sequencing libraries using the Illumina RNA TruSeq Library Kit per the manufacturer’s instructions. The quantity and quality of RNA-Seq libraries were analyzed using Qubit and an Agilent Bioanalyzer, respectively, and the libraries were pooled and sequenced by Illumina NextSeq 500. Using an optimized data analysis workflow, ~30 million sequence reads per sample were mapped to the mouse genome (build mm9) and assembled into transcripts. Sequencing, reads mapping and transcripts identification were performed by The Center for Cancer Computational Biology, Dana-Farber Cancer Institute, Boston, MA.
Isolation of Mature Brown Adipocytes
The interscapular BAT was dissected from sex- and age-matched mice, minced, and digested in HBSS (Corning 21-023-CV) with 4% fatty-acid free BSA, 2 mg/mL collagenase B (Worthington, CLSAFB), and 1 mg/mL soybean trypsin inhibitor (Worthington, LS003570) for 30 min at 37°C. Cells were washed 3x with Krebs Ringer bicarbonate-modified buffer (KRBMB, 120 mM NaCl, 5 mM KCl, 1 mM MgCl2, 1 mM CaCal2, 0.4 mM K2HPO4, 10 mM Glucose, 15 mM NaHCO3 and 20 mM HEPES) with 4% fatty-acid free BSA at pH7.4. Adipocytes were collected by centrifugation at ~30 g for 5 min and the infranatant was removed by syringe. Adipocytes were then allowed to recover for at least 30 min at room temperature in the same buffer. Cells were counted by lysis followed by Trypan blue staining of the nuclei.
Pre-adipocytes Isolation and In Vitro Differentiation
The interscapular BAT was dissected from sex- and age-matched 3-week old mice, minced, and digested in HBSS (Corning 21-023-CV) with 4% fatty-acid free BSA, 2 mg/mL collagenase B (Worthington, CLSAFB), and 1 mg/mL soybean trypsin inhibitor (Worthington, LS003570) for 30 min at 37°C. The digested solution was filtered through a 40 um cell strainer and centrifuged at 500 g for 5 min. The pellet or the Stromal Vascular Fraction (SVF) containing preadipocytes was then suspended in media (DMEM/F-12 Glutamax, Thermo Fischer Scientific 10565018 +10% FBS) and plated in 10 cm plates. Media was changed every other day until cells reach confluency. Adipocyte differentiation was induced with medium containing 0.5 mM isobutylmethylxanthine, 125 nM indomethacin, 5 μM dexamethasone, 850 nM insulin, 1 nM T3 and 1 μM rosiglitazone for 2 days and maintained in medium containing 850 nM insulin, 1 nM T3 and 1 μM rosiglitazone until recording (Day 10–14). On day 3 of differentiation, cells were treated with 2.5% Trypsin and replated in a lower density (1:8 dilution) into 12-well plates with Type IV-collagen coated coverslips placed inside each well. Media was changed every other day.
Cellular Respiration Assay
A CLARK-type oxygen electrode (Strathkelvin Instrument, SI130) installed in a respiration chamber (StrathKelvin Instrument, MT200A) was used to measure cellular oxygen consumption rate. For each measurement, 150,000 cells were suspended in 1 mL of KRBMB + 4% fatty acid-free BSA and added to the respiration chamber. Basal respiration rate was determined first, followed by NE (1 μM final conc.) injection into the chamber to stimulate respiration.
Lipolysis Assay
For each measurement, adipocytes were suspended in 300 uL KRBMB+4% fatty acid-free BSA at 106 cells/ml density ± 0.5 μM NE and/or other drugs. Three replicate measurements were set up per condition. After 20 min at 37°C on a shaking incubator, 125 uL of the adipocyte suspension was transferred to a centrifugal filter unit (EMD Millipore UFC30HV00) and immediately centrifuged at 10,000 rpm for 30 s to separate the cells and the buffer. Lipolysis rate was determined by measuring the amount of glycerol in the collected buffer using Free Glycerol Reagent (Sigma F6428) per manufacturer’s protocol. The calcium-free extracellular buffer is KRBMB+ 4% fatty acid-free BSA without Ca2+ and with 10 mM EGTA.
Western blots
For whole cell lysate samples, mature brown adipocytes were isolated as described above. For NE stimulation, the setup was the same as the lipolysis assay except that the cells were collected 10 min after stimulation. After separation by centrifugation in the filtered unit, the adipocytes were immediately lysed in RIPA with protease and phosphatase inhibitors. For tissue samples, the interscapular brown fat pads were dissected 20 min after IP injection of 10mg/kg CL316, 243 and homogenized in RIPA with protease and phosphatase inhibitors with metal beads in a Qiagen TissueLyser II (85300). Whole cell or tissue lysates were then separated by SDS-PAGE and transferred to Immobilon P membranes (Millipore).
Measurement of Cellular cAMP Levels
The experiment setup was the same as the lipolysis assay. After 5 min at 37°C on a shaking incubator, 125 uL of the adipocyte suspension was transferred to a centrifugal filter unit (EMD Millipore UFC30HV00) and immediately centrifuged at 10,000 rpm for 30 s to separate the cells and the buffer. Following the centrifugation, the adipocytes collected in the filter unit were immediately lysed with 110 μL 0.1 M HCl. The cAMP levels of adipocytes were then measured using a Cyclic AMP ELISA kit (Cayman Chemical 581001) following manufacturer’s protocol (cell culture sample without acetylation). To measure cAMP production, 250 μM IBMX was included in all samples to inhibit cAMP hydrolysis.
Calcium Imaging
Mature brown adipocytes were isolated as described above and suspended in culture media (DMEM/F-12 Glutamax, Thermo Fischer Scientific 10565018 +10% FBS) in 48-well plates. Type IV-collagen coated coverslips were placed on top of each well in direct contact with the floating adipocytes to allow attachment for >6 hours. The attached cells were loaded with Fluo-4 AM dye per manufacturer’s protocol (Fluo-4 Calcium Imaging Kit, Thermo Fischer Scientific F10489) and imaged in HBSS with Ca2+& Mg2+ (Corning 21-023-CV) + 20 mM Glucose. Images were acquired every 4 s with the Inverted Nikon Ti Fluorescence Microscope with a Plan Fluor 10x air immersion objective and data acquisition software MetaMorph. Excitation was at 488 nm and emission light was acquired with a 510–560 nm band-pass filter. Fluo-4 AM-labeled adipocytes were kept in extracellular solution for 120 s (30 frames) and then stimulated with 1 μM NE. Total recording time was ~400 s (100 frames). Imaging data were processed using ImageJ. Background fluorescence was first subtracted. Fluo-4 intensity was quantified within an ROI for each cell and expressed as the relative change in fluorescence F/F0 or Δ F/F0=(Fmax–F0)/F0, where F0 is the fluorescence level at the start of the experiment and Fmax (peak intensity) is the highest Fluo-4 intensity over the 400-s imaging period. The Ca2+ -free buffer is 1xHBSS without Ca2+& Mg2+ (Corning 21-022-CV) supplemented with 0.8 mM Mg2+, 20 mM Glucose and 10 mM EGTA.
Patch Clamp Recordings
Mature brown adipocytes were isolated and attached to coverslips as described above. Whole cell voltage-clamp recordings were performed at room temperature in an external solution containing 145 mM NaCl, 5 mM KCl, 2 mM CaCl2, 1 mM MgCl2, 10 mM glucose, and 10 mM HEPES (pH 7.4). Recording electrodes (2–5 MΩ) were filled with an internal solution containing 140 mM KCl, 2 mM MgCl2, 10 mM HEPES, 1 mM EGTA, 4 mM Mg2+-ATP, 0.3 mM Na+-GTP, and 0.1 mM Na2hosCre (pH 7.2). For voltage-clamp recordings, currents were elicited by 2 s polarizing steps from a holding potential of −60 mV to test potentials ranging from −70 mV to 50 mV in 20 mV increments to study the current-voltage relationship, using an Axopatch 200B amplifier (Axon Instruments). For current-clamp recordings, membrane potential was determined by averaging 50s before NE treatment, 600s during NE treatment, and 120s after NE wash off, respectively. To study the acid-sensitivity, brown adipocytes were differentiated in vitro and attached to coverslips as described above. Currents in response to the 30 mV voltage step were compared at pH 6.4, 7.4, and 8.4 using a perfusion needle. Data were low-pass filtered at 2 kHz, digitized at 20 kHz, and analyzed using the pCLAMP 10 software suite (Molecular Devices).
Measurement of BAT Temperature with Implanted Probe
Temperature probes were implanted at least a week prior to the cold exposure. Mice were anesthetized with Isoflurane. A single-use telemetry probe with a needle unit (individually wrapped and sterile) is injected into subcutaneously in the upper back interscapular region. The small needle hole is closed with tiny amount of 3M tissue glue. After implantation, mice (group-housed from birth at 20–22°C) were acclimated to individual housing conditions in a thermoneutral (30 °C) incubator for a week before being transferred to a 4°C incubator. Brown fat temperature reading is monitored at various time points using a digital receiver (BMDS) placed above the back of each free-moving mouse without direct contact with the animal for a few seconds until a reading is acquired.
Measurement of Core Temperature
Mice group-housed from birth at 20–22°C were acclimated to individual housing conditions for at least 24 h before being transferred to a 4°C incubator. Core body temperatures were monitored using a mouse rectal probe (World Precision Instruments RET3) connected to an Animal Temperature Controller (World Precision Instruments ATC2000) at various time points.
Indirect Calorimetry and Body Composition Measurements
Energy expenditure, O2 consumption, CO2 production, respiratory exchange ratio, total locomotor activity, and food intake measurements were made with a Columbus Instruments Oxymax Comprehensive Lab Animal Monitoring System at ambient room temperature (20–22°C). Mice were acclimated in the metabolic chambers for 24 hours before experiments to minimize stress from the housing change. Measurements were taken at 10 min intervals. CL316,243 (Sigma-Aldrich; 1 mg/kg) was intraperitoneally injected into mice. Fat and lean masses were measured by MRI.
Glucose Tolerance Tests
Animals were fasted overnight and then received intraperitoneal glucose at 1 mg/kg.
Tissue H&E staining
Tissues were fixed in 4% paraformaldehyde. Paraffin-embedding, sectioning and Haemotoxylin and Eosin staining were done by the Dana-Farber/Harvard Cancer Center Research Pathology core facility. Histochemical staining of different fat depots was observed with a Nikon 80i upright light microscope using a 10x objective lens.
Construction of Cre-inducible Adeno-associated Virus (AAV) Expressing Kcnk3
Full-length Kcnk3 cDNA was obtained from Origene. Kcnk3 ORF was cloned into the pAAV-Ef1a-DIO-EGFP-WPRE-pA vector (Addgene plasmid #37084) to replace EGFP with 5′ NheI and 3′ AscI (both restriction enzymes from NEB). The final plasmid was sequenced to confirm correct insertion of Kcnk3 ORF. The AAV (serotype 8) was produced by Penn Vector Core and the titer was 1x 10e14 G.C./ml.
AAV Injection into Brown Adipose Tissue
Analgesics was administrated 16 hours prior and after injection. 4-week old AdK3KO mice were anesthetized with Isoflurane. Hair was removed from the interscapular area using clippers followed by a surgical scrub alternating between Iodophors and Alcohol. A small cut was made to the skin with surgical scissors to expose the interscapular BAT. 3 μl of Kcnk3-AAV or GFP-AAV was slowly injected into each lobe of the BAT using a 10 μl-Hamilton syringe (6 μl total for 2 lobes). The skin was closed with 9mm autoclips. The autoclips were removed 1 week after injection. Experiments were performed 4 weeks after injection.
DATA AND SOFTWARE AVAILABILITY
The Adiponectin-cre TRAP RNA-Seq dataset has been deposited in the GEO under accession number GSE103617.
QUANTIFICATION AND STATISTICAL ANALYSIS
Experimental Replicates and quantification
Replicates are described in the figure legends. For cellular assays, n corresponds to the number of experimental replicates using cells isolated from the same cohort of animals. Each cellular experiment was repeated using at least three cohorts of mice. For animal experiment, n corresponds to the number of mice used per genotype or condition. Each experiment was repeated using at least two cohorts of mice. All data were represented as mean SEM (standard error) as described in the figure legends.
Statistical Analysis
The two-tailed Student’s t-test was used for single comparisons. Two-way ANOVA with repeated measures was used for body weight and energy expenditure comparisons.
Supplementary Material
(A) Prdm16 ChIP-Seq peaks at the Ucp1 and Elovl3 loci.
(B) Relative Kcnk3 expression levels by qPCR in freshly-isolated mature wildtype brown adipocytes versus brown adipocytes differentiated in vitro; n=3 per group.
(C) Kcnk3-mediated current-voltage relationship (black dots) fitted to the Goldman-Hodgkin-Katz (GHK) equation (red curve). Kcnk3-mediated current is represented by the difference between currents in control and kcnk3-deficient cells. Left panel, cells from AdK3KO mice (control n=6, AdK3KO n=8); right panel, cells from global kcnk3 knockout mice (kcnk3+/+ n=4, kcnk3−/− n=6).
(D) Inactivating currents in control and kcnk3-deficient brown adipocytes, represented by the difference between peak current and steady-state current. Left panel, cells from AdK3KO mice (control n=6, AdK3KO n=8); right panel, cells from global kcnk3 knockout mice (kcnk3+/+ n=4, kcnk3−/− n=6).
(E) Baseline current shifts with pH (the difference between currents at pH 6.4 and 8.4) at −60 mV in control (n=10) and kcnk3-deficient (n=5) brown adipocytes differentiated in vitro.
(F) Urinary Aldosterone levels in control and AdK3KO mice normalized to urinary creatine levels; n=6 mice per group.
Data are represented as means ± SEM; **P < 0.01, two-tailed Student’s t-test.
(A) H&E staining of BAT and iWAT from control and AdK3KO mice.
(B) Western blot of UCP1 and ACONITASE 2 in control and kcnk3-deficient brown adipocytes.
(C) Expression levels of the adipogenic, thermogenic and mitochondrial genes in the BAT of control and AdK3KO mice housed at room temperature (RT, 20–22 °C, n=5) and in cold conditions (Cold, 4 °C for 7 days, n=4) by qPCR.
(D) Expression levels of the adipogenic, thermogenic and mitochondrial genes in the iWAT of control and AdK3KO mice housed at room temperature (RT, 20–22 °C, n=5) and in cold conditions (Cold, 4 °C for 7 days, n=4) by qPCR.
(E) Expression levels of the adipogenic, thermogenic and mitochondrial genes in the interscapular brown and inguinal white (beige) adipocytes differentiated in vitro ± NE by qPCR (n=4 per condition).
(F) Western blot of pan-PKA substrates in NE-stimulated brown adipocytes isolated from control and AdK3KO mice.
(G) Lipolysis rates of brown adipocytes isolated from control and Ucp1-cre kcnk3 fl/fl mice under NE stimulation. Cells were pooled from 10 mice and 3 replicate measurements were taken per experiment. Each experiment was repeated at least twice.
(H) Western blot of HSL phosphorylation in NE-stimulated brown adipocytes isolated from control and Ucp1-cre kcnk3 fl/fl mice.
Data are represented as means ± SEM. *P < 0.05, ***P < 0.001, two-tailed Student’s t-test.
(A) Expression levels of the three β-adrenergic receptors genes in the BAT of control and AdK3KO mice by qPCR (n=4).
(B) Western blot of ADRB3, GSα and the catalytic subunit of PKA in control and kcnk3-deficient brown adipocytes. For ADRB3 and GSα, plasma membrane fraction of the control and kcnk3-deficient brown adipocytes was used and Caveolin-1 (CAV1) was the loading control.
(C) NE-stimulated lipolysis rates of beige adipocytes isolated from the inguinal white adipose tissue of the cold-adapted control and AdK3KO mice.
(D) Western blot of HSL phosphorylation in NE-stimulated beige adipocytes isolated from control and AdK3KO mice.
(E) cAMP production in NE-stimulated control and kcnk3-deficient beige adipocytes.
Data are represented as means ± SEM. **P < 0.01, ***P < 0.001, two-tailed Student’s t-test. In (C)–(E), cells were pooled from 10 mice and 3 replicate measurements were taken per experiment. Each experiment was at least twice.
(A) Individual data points showing NE-induced [Ca2+]i changes Δ F/F0=(Fmax−F0)/F0; F0 is the fluorescence level at 0 min and Fmax (peak intensity) is the highest Fluo-4 intensity over the 400s imaging time period.
(B) cAMP production in control and kcnk3-deficient brown adipocytes in normal Ca2+ buffer treated BAPTA-AM.
(C) Expression levels of VDCC α-subunits in brown adipocytes represented in FPKM values by Adiponectin-TRAP. Cacna1d encodes the α-subunit of the L-type VDCC Cav1.3 and Cacna1a encodes the α-subunit of the P/Q-type VDCC Cav2.1.
(D) Brown adipocyte cAMP production levels when treated with L-type VDCC inhibitors L651, 582 (1 μM) or Benidipine (15 μM).
(E) Brown adipocyte lipolysis rates when treated with L-type VDCC inhibitors L651, 582 (1 μM) or Benidipine (15 μM).
Data are represented as means ± SEM. **P < 0.01, ***P < 0.001, two-tailed Student’s t-test. In (B), (D) and (E) cells were pooled from 10 mice and 3 replicate measurements were taken per experiment. Each experiment was repeated > 3 times.
(A) Core body temperature of individually-housed control and AdK3KO mice upon transition from room temperature (20–22 °C) to 4 °C n=6 mice per group.
(B) Core body temperature of control and AdK3KO mice house at room temperature (20–22 °C). n=10 mice per group.
(C) RER of control and AdK3KO mice at basal conditions and after CL316, 243-injection. n=7 mice per group. RER is calculated as VO2/VCO2.
(D) Average daily food intake on a chow diet; n=7 mice per group.
(E) Movement counts in the X-axis and Y-axis under basal and CL316, 243-injected conditions. n=7 mice per group.
Data are represented as means ± SEM. (A), (B), and (D), two-tailed Student’s t-test; (C) and (E), two-way ANOVA.
(A) Schematic showing AAV-mediated Kcnk3 expression in the BAT of AdK3KO mice.
(B) Kcnk3 expression levels in the BAT of wildtype and AdK3KO mice injected with GFP-AAV or Kcnk3-AAV by qPCR; n=5 mice per group.
(C) NE-stimulated lipolysis rates of brown adipocytes from AdK3KO mice injected with GFP-AAV or Kcnk3-AAV.
(D) cAMP production in NE-stimulated brown adipocytes from AdK3KO mice injected with GFP-AAV or Kcnk3-AAV.
(E) Oxygen consumption rates (VO2) of AdK3KO mice injected with GFP-AAV or Kcnk3-AAV before and after CL316, 243-injection (1 mg/kg); n=5 mice per group.
Data are represented as means ± SEM. **P < 0.01, ***P < 0.001; (B)-(D), two-tailed Student’s t-test; (E), two-way ANOVA; In (C) and (D), cells were pooled from 5 mice and 3 replicate measurements were taken per experiment.
(A) RER of control and AdK3KO mice at basal conditions and after CL316, 243-injection. n=7 per group for basal condition and n=6 per group for CL316, 243-injected condition.
(B) Average daily food intake on HFD; n=7 per group for basal condition and n=6 per group for CL316, 243-injected condition.
(C) Movement counts in the X-axis and Y-axis under basal and CL316, 243-injected conditions. n=7 per group for basal condition and n=6 per group for CL316, 243-injected condition.
(D) H&E staining of iWAT and eWAT from control and AdK3KO mice following 14-week HFD feeding. Scale bar, 100 μm.
Data are represented as means ± SEM. (A) and (C), two-way ANOVA; (B), two-tailed Student’s t-test.
Highlights.
Kcnk3 expression in thermogenic adipocytes is directly regulated by Prdm16.
Kcnk3 negatively regulates thermogenesis by dampening cAMP-PKA signaling.
Kcnk3 mediates outward K+ current to antagonize depolarization induced Ca2+ influx.
Adipose-specific kcnk3 knockout mice are resistant to hypothermia and obesity.
Acknowledgments
This investigation has been aided by the JPB Foundation and National Institutes of Health (DK31405) to B.M.S., grants from the Jane Coffin Childs Memorial Fund for Medical Research (to Y.C.), American Heart Association (to X.Z.) and Yousef Jameel Ph.D. Scholarship at AUC (to S.S.). We acknowledge B. Hu and D. Laznik-Bogoslavski for technical assistance. We thank R. Chang, ET. Chouchani, P. Cohen, MY. Pecot, P. Purgserver, and ED. Rosen for discussions. We also thank D. Bayliss for providing Kcnk3 floxed and global knockout mice and ED. Rosen for Ucp1-cre mice. We thank the Nikon Imaging Center at Harvard Medical School for Microscopy assistance.
Footnotes
Author Contributions
Y.C. and X. Z. designed research, performed cellular and in vivo experiments and analyzed data. X. H. performed electrophysiology recordings and analyzed data. S.S. performed the Adiponectin-TRAP experiments. C.J.W oversaw the electrophysiology experiments. B.M.S. directed the research. Y.C. and B.M.S. co-wrote the paper, with assistance from all other authors.
Publisher's Disclaimer: This is a PDF file of an unedited manuscript that has been accepted for publication. As a service to our customers we are providing this early version of the manuscript. The manuscript will undergo copyediting, typesetting, and review of the resulting proof before it is published in its final citable form. Please note that during the production process errors may be discovered which could affect the content, and all legal disclaimers that apply to the journal pertain.
References
- Bentley DC, Pulbutr P, Chan S, Smith PA. Etiology of the Membrane Potential of Rat White Fat Adipocytes. Am J Physiol Endocrinol Metab. 2014;307:161–175. doi: 10.1152/ajpendo.00446.2013. [DOI] [PubMed] [Google Scholar]
- Blondin DP, Frisch F, Phoenix S, Guerin B, Turcotte EE, Haman F, Richard D, Carpentier AC. Inhibition of Intracellular Triglyceride Lipolysis Suppresses Cold-Induced Brown Adipose Tissue Metabolism and Increases Shivering in Humans. Cell Metab. 2017;25:438–447. doi: 10.1016/j.cmet.2016.12.005. [DOI] [PubMed] [Google Scholar]
- Bootman MD, Rietdorf K, Collins T, Walker S, Sanderson M. Ca2+-Sensitive Fluorescent Dyes and Intracellular Ca2+ Imaging. Cold Spring Harbor Protocols. 2013;2013 doi: 10.1101/pdb.top066050. [DOI] [PubMed] [Google Scholar]
- Bronnikov GE, Zhang SJ, Cannon B, Nedergaard J. A dual component analysis explains the distinctive kinetics of cAMP accumulation in brown adipocytes. The Journal of biological chemistry. 1999;274:37770–37780. doi: 10.1074/jbc.274.53.37770. [DOI] [PubMed] [Google Scholar]
- Carmen GY, Victor SM. Signalling mechanisms regulating lipolysis. Cell Signal. 2006;18:401–408. doi: 10.1016/j.cellsig.2005.08.009. [DOI] [PubMed] [Google Scholar]
- Catterall WA. Voltage-gated calcium channels. Cold Spring Harb Perspect Biol. 2011;3:a003947. doi: 10.1101/cshperspect.a003947. [DOI] [PMC free article] [PubMed] [Google Scholar]
- Chondronikola M, Volpi E, Borsheim E, Porter C, Saraf MK, Annamalai P, Yfanti C, Chao T, Wong D, Shinoda K, et al. Brown Adipose Tissue Activation Is Linked to Distinct Systemic Effects on Lipid Metabolism in Humans. Cell Metab. 2016;23:1200–1206. doi: 10.1016/j.cmet.2016.04.029. [DOI] [PMC free article] [PubMed] [Google Scholar]
- Cohen P, Levy JD, Zhang Y, Frontini A, Kolodin DP, Svensson KJ, Lo JC, Zeng X, Ye L, Khandekar MJ, et al. Ablation of PRDM16 and beige adipose causes metabolic dysfunction and a subcutaneous to visceral fat switch. Cell. 2014;156:304–316. doi: 10.1016/j.cell.2013.12.021. [DOI] [PMC free article] [PubMed] [Google Scholar]
- Cummings DD, Wilcox KS, Dichter MA. Calcium-dependent paired-pulse facilitation of miniature EPSC frequency accompanies depression of EPSCs at hippocampal synapses in culture. The Journal of neuroscience: the official journal of the Society for Neuroscience. 1996;16:5312–5323. doi: 10.1523/JNEUROSCI.16-17-05312.1996. [DOI] [PMC free article] [PubMed] [Google Scholar]
- Davies LA, Hu C, Guagliardo NA, Sen N, Chen X, Talley EM, Carey RM, Bayliss DA, Barrett PQ. TASK channel deletion in mice causes primary hyperaldosteronism. Proceedings of the National Academy of Sciences. 2008;105:2203–2208. doi: 10.1073/pnas.0712000105. [DOI] [PMC free article] [PubMed] [Google Scholar]
- Duprat F, Lesage F, Fink M, Reyes R, Heurteaux C, Lazdunski M. TASK, a human background K+ channel to sense external pH variations near physiological pH. The EMBO Journal. 1997;16:5464–5471. doi: 10.1093/emboj/16.17.5464. [DOI] [PMC free article] [PubMed] [Google Scholar]
- Ehling P, Bittner S, Budde T, Wiendl H, Meuth SG. Ion channels in autoimmune neurodegeneration. FEBS Lett. 2011;585:3836–3842. doi: 10.1016/j.febslet.2011.03.065. [DOI] [PubMed] [Google Scholar]
- Fedorenko A, Lishko PV, Kirichok Y. Mechanism of fatty-acid-dependent UCP1 uncoupling in brown fat mitochondria. Cell. 2012;151:400–413. doi: 10.1016/j.cell.2012.09.010. [DOI] [PMC free article] [PubMed] [Google Scholar]
- Feliciangeli S, Chatelain FC, Bichet D, Lesage F. The family of K2P channels: salient structural and functional properties. J Physiol. 2015;593:2587–2603. doi: 10.1113/jphysiol.2014.287268. [DOI] [PMC free article] [PubMed] [Google Scholar]
- Fink SA, Williams JA. Adrenergic receptors mediating depolarization in brown adipose tissue. Am J Physiol. 1976;231:700–706. doi: 10.1152/ajplegacy.1976.231.3.700. [DOI] [PubMed] [Google Scholar]
- Flaherty DP, Simpson DS, Miller M, Maki BE, Zou B, Shi J, Wu M, McManus OB, Aube J, Li M, et al. Potent and selective inhibitors of the TASK-1 potassium channel through chemical optimization of a bis-amide scaffold. Bioorg Med Chem Lett. 2014;24:3968–3973. doi: 10.1016/j.bmcl.2014.06.032. [DOI] [PMC free article] [PubMed] [Google Scholar]
- Harms M, Seale P. Brown and beige fat: development, function and therapeutic potential. Nat Med. 2013;19:1252–1263. doi: 10.1038/nm.3361. [DOI] [PubMed] [Google Scholar]
- Harms MJ, Ishibashi J, Wang W, Lim HWW, Goyama S, Sato T, Kurokawa M, Won KJJ, Seale P. Prdm16 is required for the maintenance of brown adipocyte identity and function in adult mice. Cell metabolism. 2014;19:593–604. doi: 10.1016/j.cmet.2014.03.007. [DOI] [PMC free article] [PubMed] [Google Scholar]
- Hayato R, Higure Y, Kuba M, Nagai H, Yamashita H, Kuba K. beta(3)-Adrenergic activation of sequential Ca(2+) release from mitochondria and the endoplasmic reticulum and the subsequent Ca(2+) entry in rodent brown adipocytes. Cell Calcium. 2011;49:400–414. doi: 10.1016/j.ceca.2011.02.011. [DOI] [PubMed] [Google Scholar]
- Horwitz BA, Horowitz JM, Jr, Smith RE. Norepinephrine-induced depolarization of brown fat cells. Proc Natl Acad Sci U S A. 1969;64:113–120. doi: 10.1073/pnas.64.1.113. [DOI] [PMC free article] [PubMed] [Google Scholar]
- Hupe DJ, Boltz R, Cohen CJ, Felix J, Ham E, Miller D, Soderman D, Van Skiver D. The inhibition of receptor-mediated and voltage-dependent calcium entry by the antiproliferative L-651,582. The Journal of biological chemistry. 1991;266:10136–10142. [PubMed] [Google Scholar]
- Kajimura S, Saito M. A new era in brown adipose tissue biology: molecular control of brown fat development and energy homeostasis. Annual review of physiology. 2014;76:225–249. doi: 10.1146/annurev-physiol-021113-170252. [DOI] [PMC free article] [PubMed] [Google Scholar]
- Kong X, Banks A, Liu T, Kazak L, Rao RR, Cohen P, Wang X, Yu S, Lo JC, Tseng YH, et al. IRF4 is a key thermogenic transcriptional partner of PGC-1alpha. Cell. 2014;158:69–83. doi: 10.1016/j.cell.2014.04.049. [DOI] [PMC free article] [PubMed] [Google Scholar]
- Lazarenko RM, Willcox SC, Shu S, Berg AP, Jevtovic-Todorovic V, Talley EM, Chen X, Bayliss DA. Motoneuronal TASK channels contribute to immobilizing effects of inhalational general anesthetics. The Journal of neuroscience: the official journal of the Society for Neuroscience. 2010;30:7691–7704. doi: 10.1523/JNEUROSCI.1655-10.2010. [DOI] [PMC free article] [PubMed] [Google Scholar]
- Long JZ, Svensson KJ, Tsai L, Zeng X, Roh HC, Kong X, Rao RR, Lou J, Lokurkar I, Baur W, et al. A smooth muscle-like origin for beige adipocytes. Cell Metab. 2014;19:810–820. doi: 10.1016/j.cmet.2014.03.025. [DOI] [PMC free article] [PubMed] [Google Scholar]
- Marzolla V, Armani A, Zennaro MC, Cinti F, Mammi C, Fabbri A, Rosano GM, Caprio M. The role of the mineralocorticoid receptor in adipocyte biology and fat metabolism. Mol Cell Endocrinol. 2012;350:281–288. doi: 10.1016/j.mce.2011.09.011. [DOI] [PubMed] [Google Scholar]
- Mathie A. Neuronal two-pore-domain potassium channels and their regulation by G protein-coupled receptors. J Physiol. 2007;578:377–385. doi: 10.1113/jphysiol.2006.121582. [DOI] [PMC free article] [PubMed] [Google Scholar]
- Mathie A, Veale EL. Therapeutic potential of neuronal two-pore domain potassium-channel modulators. Curr Opin Investig Drugs. 2007;8:555–562. [PubMed] [Google Scholar]
- Mattson MP, Chan SL. Calcium orchestrates apoptosis. Nat Cell Biol. 2003;5:1041–1043. doi: 10.1038/ncb1203-1041. [DOI] [PubMed] [Google Scholar]
- Maus M, Cuk M, Patel B, Lian J, Ouimet M, Kaufmann U, Yang J, Horvath R, Hornig-Do HT, Chrzanowska-Lightowlers ZM, et al. Store-Operated Ca2+ Entry Controls Induction of Lipolysis and the Transcriptional Reprogramming to Lipid Metabolism. Cell Metab. 2017;25:698–712. doi: 10.1016/j.cmet.2016.12.021. [DOI] [PMC free article] [PubMed] [Google Scholar]
- Mulkey DK, Talley EM, Stornetta RL, Siegel AR, West GH, Chen X, Sen N, Mistry AM, Guyenet PG, Bayliss DA. TASK channels determine pH sensitivity in select respiratory neurons but do not contribute to central respiratory chemosensitivity. The Journal of neuroscience: the official journal of the Society for Neuroscience. 2007;27:14049–14058. doi: 10.1523/JNEUROSCI.4254-07.2007. [DOI] [PMC free article] [PubMed] [Google Scholar]
- Ohno H, Shinoda K, Spiegelman BM, Kajimura S. PPARγ agonists induce a white-to-brown fat conversion through stabilization of PRDM16 protein. Cell Metab. 2012;15(3):395–404. doi: 10.1016/j.cmet.2012.01.019. [DOI] [PMC free article] [PubMed] [Google Scholar]
- Petruzzelli M, Wagner EF. Mechanisms of metabolic dysfunction in cancer-associated cachexia. Genes Dev. 2016;30:489–501. doi: 10.1101/gad.276733.115. [DOI] [PMC free article] [PubMed] [Google Scholar]
- Pisani DF, Beranger GE, Corinus A, Giroud M, Ghandour RA, Altirriba J, Chambard JCC, Mazure NM, Bendahhou S, Duranton C, et al. The K+ channel TASK1 modulates β-adrenergic response in brown adipose tissue through the mineralocorticoid receptor pathway. FASEB journal: official publication of the Federation of American Societies for Experimental Biology. 2016;30:909–922. doi: 10.1096/fj.15-277475. [DOI] [PubMed] [Google Scholar]
- Roh HC, Tsai LTY, Lyubetskaya A, Tenen D, Kumari M, Rosen ED. Simultaneous transcriptional and epigenomic profiling from specific cell types within heterogeneous tissues in vivo. Cell reports. 2017;18:1048–1061. doi: 10.1016/j.celrep.2016.12.087. [DOI] [PMC free article] [PubMed] [Google Scholar]
- Saunders A, Johnson CA, Sabatini BL. Novel recombinant adeno-associated viruses for Cre activated and inactivated transgene expression in neurons. Frontiers in Neural Circuits. 2012;6:47. doi: 10.3389/fncir.2012.00047. [DOI] [PMC free article] [PubMed] [Google Scholar]
- Seale P, Conroe HM, Estall J, Kajimura S, Frontini A, Ishibashi J, Cohen P, Cinti S, Spiegelman BM. Prdm16 determines the thermogenic program of subcutaneous white adipose tissue in mice. The Journal of clinical investigation. 2011;121:96–105. doi: 10.1172/JCI44271. [DOI] [PMC free article] [PubMed] [Google Scholar]
- Seale P, Kajimura S, Yang W, Chin S, Rohas LM, Uldry M, Tavernier G, Langin D, Spiegelman BM. Transcriptional control of brown fat determination by PRDM16. Cell metabolism. 2007;6:38–54. doi: 10.1016/j.cmet.2007.06.001. [DOI] [PMC free article] [PubMed] [Google Scholar]
- Shinoda K, Luijten IH, Hasegawa Y, Hong H, Sonne SB, Kim M, Xue R, Chondronikola M, Cypess AM, Tseng YH, et al. Genetic and functional characterization of clonally derived adult human brown adipocytes. Nat Med. 2015;21:389–394. doi: 10.1038/nm.3819. [DOI] [PMC free article] [PubMed] [Google Scholar]
- Shungin D, Winkler TW, Croteau-Chonka DC, Ferreira T, Locke AE, Mägi R, Strawbridge RJ, Pers TH, Fischer K, Justice AE, et al. New genetic loci link adipose and insulin biology to body fat distribution. Nature. 2015;518:187–196. doi: 10.1038/nature14132. [DOI] [PMC free article] [PubMed] [Google Scholar]
- Sirois JE, Lei Q, Talley EM, Lynch C, 3rd, Bayliss DA. The TASK-1 two-pore domain K+ channel is a molecular substrate for neuronal effects of inhalation anesthetics. The Journal of neuroscience: the official journal of the Society for Neuroscience. 2000;20:6347–6354. doi: 10.1523/JNEUROSCI.20-17-06347.2000. [DOI] [PMC free article] [PubMed] [Google Scholar]
- Svensson PA, Jernas M, Sjoholm K, Hoffmann JM, Nilsson BE, Hansson M, Carlsson LM. Gene expression in human brown adipose tissue. International journal of molecular medicine. 2011;27:227–232. doi: 10.3892/ijmm.2010.566. [DOI] [PubMed] [Google Scholar]
- Teramoto T, Kuwada M, Niidome T, Sawada K, Nishizawa Y, Katayama K. A novel peptide from funnel web spider venom, omega-Aga-TK, selectively blocks, P-type calcium channels. Biochem Biophys Res Commun. 1993;196:134–140. doi: 10.1006/bbrc.1993.2225. [DOI] [PubMed] [Google Scholar]
- Wiedmann F, Schmidt C, Lugenbiel P, Staudacher I, Rahm AK, Seyler C, Schweizer PA, Katus HA, Thomas D. Therapeutic targeting of two-pore-domain potassium (K(2P)) channels in the cardiovascular system. Clin Sci (Lond) 2016;130:643–650. doi: 10.1042/CS20150533. [DOI] [PubMed] [Google Scholar]
- Wilke BU, Lindner M, Greifenberg L, Albus A, Kronimus Y, Bünemann M, Leitner MG, Oliver D. Diacylglycerol mediates regulation of TASK potassium channels by Gq-coupled receptors. Nature communications. 2014;5:5540. doi: 10.1038/ncomms6540. [DOI] [PubMed] [Google Scholar]
- Wong ST, Athos J, Figueroa XA, Pineda VV, Schaefer ML, Chavkin CC, Muglia LJ, Storm DR. Calcium-stimulated adenylyl cyclase activity is critical for hippocampus-dependent long-term memory and late phase LTP. Neuron. 1999;23:787–798. doi: 10.1016/s0896-6273(01)80036-2. [DOI] [PubMed] [Google Scholar]
- Yoneshiro T, Aita S, Matsushita M, Kayahara T, Kameya T, Kawai Y, Iwanaga T, Saito M. Recruited brown adipose tissue as an antiobesity agent in humans. J Clin Invest. 2013;123:3404–3408. doi: 10.1172/JCI67803. [DOI] [PMC free article] [PubMed] [Google Scholar]
- Zeng X, Jedrychowski MP, Chen Y, Serag S, Lavery GG, Gygi SP, Spiegelman BM. Lysine-specific demethylase 1 promotes brown adipose tissue thermogenesis via repressing glucocorticoid activation. Genes & development. 2016;30:1822–1836. doi: 10.1101/gad.285312.116. [DOI] [PMC free article] [PubMed] [Google Scholar]
Associated Data
This section collects any data citations, data availability statements, or supplementary materials included in this article.
Supplementary Materials
(A) Prdm16 ChIP-Seq peaks at the Ucp1 and Elovl3 loci.
(B) Relative Kcnk3 expression levels by qPCR in freshly-isolated mature wildtype brown adipocytes versus brown adipocytes differentiated in vitro; n=3 per group.
(C) Kcnk3-mediated current-voltage relationship (black dots) fitted to the Goldman-Hodgkin-Katz (GHK) equation (red curve). Kcnk3-mediated current is represented by the difference between currents in control and kcnk3-deficient cells. Left panel, cells from AdK3KO mice (control n=6, AdK3KO n=8); right panel, cells from global kcnk3 knockout mice (kcnk3+/+ n=4, kcnk3−/− n=6).
(D) Inactivating currents in control and kcnk3-deficient brown adipocytes, represented by the difference between peak current and steady-state current. Left panel, cells from AdK3KO mice (control n=6, AdK3KO n=8); right panel, cells from global kcnk3 knockout mice (kcnk3+/+ n=4, kcnk3−/− n=6).
(E) Baseline current shifts with pH (the difference between currents at pH 6.4 and 8.4) at −60 mV in control (n=10) and kcnk3-deficient (n=5) brown adipocytes differentiated in vitro.
(F) Urinary Aldosterone levels in control and AdK3KO mice normalized to urinary creatine levels; n=6 mice per group.
Data are represented as means ± SEM; **P < 0.01, two-tailed Student’s t-test.
(A) H&E staining of BAT and iWAT from control and AdK3KO mice.
(B) Western blot of UCP1 and ACONITASE 2 in control and kcnk3-deficient brown adipocytes.
(C) Expression levels of the adipogenic, thermogenic and mitochondrial genes in the BAT of control and AdK3KO mice housed at room temperature (RT, 20–22 °C, n=5) and in cold conditions (Cold, 4 °C for 7 days, n=4) by qPCR.
(D) Expression levels of the adipogenic, thermogenic and mitochondrial genes in the iWAT of control and AdK3KO mice housed at room temperature (RT, 20–22 °C, n=5) and in cold conditions (Cold, 4 °C for 7 days, n=4) by qPCR.
(E) Expression levels of the adipogenic, thermogenic and mitochondrial genes in the interscapular brown and inguinal white (beige) adipocytes differentiated in vitro ± NE by qPCR (n=4 per condition).
(F) Western blot of pan-PKA substrates in NE-stimulated brown adipocytes isolated from control and AdK3KO mice.
(G) Lipolysis rates of brown adipocytes isolated from control and Ucp1-cre kcnk3 fl/fl mice under NE stimulation. Cells were pooled from 10 mice and 3 replicate measurements were taken per experiment. Each experiment was repeated at least twice.
(H) Western blot of HSL phosphorylation in NE-stimulated brown adipocytes isolated from control and Ucp1-cre kcnk3 fl/fl mice.
Data are represented as means ± SEM. *P < 0.05, ***P < 0.001, two-tailed Student’s t-test.
(A) Expression levels of the three β-adrenergic receptors genes in the BAT of control and AdK3KO mice by qPCR (n=4).
(B) Western blot of ADRB3, GSα and the catalytic subunit of PKA in control and kcnk3-deficient brown adipocytes. For ADRB3 and GSα, plasma membrane fraction of the control and kcnk3-deficient brown adipocytes was used and Caveolin-1 (CAV1) was the loading control.
(C) NE-stimulated lipolysis rates of beige adipocytes isolated from the inguinal white adipose tissue of the cold-adapted control and AdK3KO mice.
(D) Western blot of HSL phosphorylation in NE-stimulated beige adipocytes isolated from control and AdK3KO mice.
(E) cAMP production in NE-stimulated control and kcnk3-deficient beige adipocytes.
Data are represented as means ± SEM. **P < 0.01, ***P < 0.001, two-tailed Student’s t-test. In (C)–(E), cells were pooled from 10 mice and 3 replicate measurements were taken per experiment. Each experiment was at least twice.
(A) Individual data points showing NE-induced [Ca2+]i changes Δ F/F0=(Fmax−F0)/F0; F0 is the fluorescence level at 0 min and Fmax (peak intensity) is the highest Fluo-4 intensity over the 400s imaging time period.
(B) cAMP production in control and kcnk3-deficient brown adipocytes in normal Ca2+ buffer treated BAPTA-AM.
(C) Expression levels of VDCC α-subunits in brown adipocytes represented in FPKM values by Adiponectin-TRAP. Cacna1d encodes the α-subunit of the L-type VDCC Cav1.3 and Cacna1a encodes the α-subunit of the P/Q-type VDCC Cav2.1.
(D) Brown adipocyte cAMP production levels when treated with L-type VDCC inhibitors L651, 582 (1 μM) or Benidipine (15 μM).
(E) Brown adipocyte lipolysis rates when treated with L-type VDCC inhibitors L651, 582 (1 μM) or Benidipine (15 μM).
Data are represented as means ± SEM. **P < 0.01, ***P < 0.001, two-tailed Student’s t-test. In (B), (D) and (E) cells were pooled from 10 mice and 3 replicate measurements were taken per experiment. Each experiment was repeated > 3 times.
(A) Core body temperature of individually-housed control and AdK3KO mice upon transition from room temperature (20–22 °C) to 4 °C n=6 mice per group.
(B) Core body temperature of control and AdK3KO mice house at room temperature (20–22 °C). n=10 mice per group.
(C) RER of control and AdK3KO mice at basal conditions and after CL316, 243-injection. n=7 mice per group. RER is calculated as VO2/VCO2.
(D) Average daily food intake on a chow diet; n=7 mice per group.
(E) Movement counts in the X-axis and Y-axis under basal and CL316, 243-injected conditions. n=7 mice per group.
Data are represented as means ± SEM. (A), (B), and (D), two-tailed Student’s t-test; (C) and (E), two-way ANOVA.
(A) Schematic showing AAV-mediated Kcnk3 expression in the BAT of AdK3KO mice.
(B) Kcnk3 expression levels in the BAT of wildtype and AdK3KO mice injected with GFP-AAV or Kcnk3-AAV by qPCR; n=5 mice per group.
(C) NE-stimulated lipolysis rates of brown adipocytes from AdK3KO mice injected with GFP-AAV or Kcnk3-AAV.
(D) cAMP production in NE-stimulated brown adipocytes from AdK3KO mice injected with GFP-AAV or Kcnk3-AAV.
(E) Oxygen consumption rates (VO2) of AdK3KO mice injected with GFP-AAV or Kcnk3-AAV before and after CL316, 243-injection (1 mg/kg); n=5 mice per group.
Data are represented as means ± SEM. **P < 0.01, ***P < 0.001; (B)-(D), two-tailed Student’s t-test; (E), two-way ANOVA; In (C) and (D), cells were pooled from 5 mice and 3 replicate measurements were taken per experiment.
(A) RER of control and AdK3KO mice at basal conditions and after CL316, 243-injection. n=7 per group for basal condition and n=6 per group for CL316, 243-injected condition.
(B) Average daily food intake on HFD; n=7 per group for basal condition and n=6 per group for CL316, 243-injected condition.
(C) Movement counts in the X-axis and Y-axis under basal and CL316, 243-injected conditions. n=7 per group for basal condition and n=6 per group for CL316, 243-injected condition.
(D) H&E staining of iWAT and eWAT from control and AdK3KO mice following 14-week HFD feeding. Scale bar, 100 μm.
Data are represented as means ± SEM. (A) and (C), two-way ANOVA; (B), two-tailed Student’s t-test.