


Abstract
A proteoform family is a group of related molecular forms of a protein (proteoforms) derived from the same gene. We have previously described a strategy to identify proteoforms and elucidate proteoform families in complex mixtures of intact proteins. The strategy is based upon measurements of two properties for each proteoform: (i) the accurate proteoform intact-mass, measured by liquid chromatography/mass spectrometry (LC–MS), and (ii) the number of lysine residues in each proteoform, determined using an isotopic labeling approach. These measured properties are then compared with those extracted from a catalog of theoretical proteoforms containing protein sequences and localized post-translational modifications (PTMs) for the organism under study. A match between the measured properties and those in the catalog constitutes an identification of the proteoform. In the present study, this strategy is extended by utilizing a global PTM discovery database and is applied to the widely studied model organism Escherichia coli, providing the most comprehensive elucidation of E. coli proteoforms and proteoform families to date.
Keywords: proteoform, proteoform family, intact-mass, PTM, database search, NeuCode, E. coli
Graphical abstract
INTRODUCTION
The term proteoform was recently introduced in the literature and refers to a unique amino acid sequence from a specific gene with a specific set of post-translational modifications (PTMs).1 Proteoform variations can occur due to a variety of mechanisms, such as genetic variation, alternative splicing, RNA editing, and post-translational processing and/or modification.1,2 A proteoform family is a collection of proteoforms arising from a given gene3 and can be used to provide a concise visual representation of proteoform complexity. An interesting nascent area of proteomic research is defining the degree and nature of proteoform complexity in various organisms.
In standard “bottom-up” proteomic methods, mass spectrometry utilizes gas-phase fragmentation to identify peptides derived from enzymatic digestion of proteins, providing surrogate markers for the presence of the parent protein in the sample. However, many different proteoforms may contain the same peptide; therefore, direct information about the proteoforms present in the sample is lost, and proteoform identifications are not possible.4 An alternative to bottom-up proteomics which does afford proteoform identifications is top-down proteomics,5 where the intact protein is subjected to gas-phase fragmentation. In the ideal case, the fragmentation would reveal the entire proteoform amino acid sequence and identify and localize all PTMs present. More often, however, only partial sequence coverage is obtained, and PTMs may fail to be identified or localized. This limitation stems from multiple causes and is especially severe for higher molecular weight proteoforms.6 Top-down proteomics is also more limited in sensitivity than bottom-up and is thus generally limited to the detection and identification of higher abundance species.
We recently reported an innovative strategy for proteoform and proteoform family identification.3 In that work, yeast proteoform families were constructed from experimental determinations of just two values for each proteoform, the accurate proteoform mass and the number of lysine residues present. Proteoforms were considered to be related, and thus members of the same family, if their lysine counts were identical and their intact masses differed by the mass of known PTMs or amino acid changes. All members of the family were identified by comparison of the intact mass and lysine count values to those values derived from a database of theoretical yeast proteoforms. This strategy of using the identification of one proteoform to leverage the identification of many related proteoforms distinguishes the approach from both top-down and bottom-up proteomics, which are based solely upon the identification of individual proteins. In addition, because all members of a family are identified and visualized together, the relative abundances of the related forms are readily evaluated. Elimination of the requirement for tandem mass spectrometry allows for a significant increase in instrument time spent on the acquisition of accurate intact-mass data, which aids in identifying more proteoforms. The process of proteoform and proteoform family identification has been fully automated in a Windows executable software program called Proteoform Suite (available at https://smith-chem-wisc.github.io/ProteoformSuite).
Effective identification of proteoforms and proteoform families depends critically on the quality of the theoretical database employed, which contains protein amino acid sequences and known localized PTMs for the organism under study. Protein amino acid sequences and a limited number of PTMs are available from repositories such as UniProt. However, the current paucity of curated PTMs would generate a correspondingly sparse set of theoretical proteoforms and thus would yield few identifications of PTM-modified proteoforms using the intact mass and lysine count strategy described above. We recently described a new strategy, Global PTM Discovery (G-PTM-D), for the discovery of PTMs in bottom-up data obtained from unenriched protein digests.7 Novel PTMs detected in this manner are added to the UniProt database, yielding a new G-PTM-D database. Proteoform Suite uses this augmented database to create a more complete set of theoretical proteoforms, which results in a significant increase in the number of proteoforms identified. In the present work, this strategy is applied to the well-studied model organism E. coli, providing the most extensive compilation to date of E. coli proteoforms.
EXPERIMENTAL PROCEDURES
Intact-Mass Proteomics
NeuCode SILAC (Stable Isotope Labeling by Amino Acids in Cell Culture),8–10 was employed to introduce isotopically tagged lysine amino acids into E. coli for intact-mass proteomics. The term “NeuCode” refers to an isotopic labeling strategy10 in which “light” and “heavy” isotopically labeled molecules have the same nominal mass (e.g., both 8 Da heavier than the monoisotopic mass of “normal” lysine) but differ in the magnitude of the mass defect (e.g., 36 mDa between the two lysine forms employed here). E. coli strain KL334 (lysA23), a lysine auxotrophic derivative of the wild type K12, was chosen for this study to allow complete proteome labeling with lysine isotopologues.11 KL334 was cultured in 20 mL of lysine-deficient EZ-rich defined media supplemented with either of the two forms of NeuCode lysine: 13C6 15N2-lys (+8.0142 Da, “light”) or 2H8-lys (+8.0502 Da, “heavy”). Cells were grown to an OD600 of about 0.5. PBS (phosphate-buffered saline)-washed light and heavy pellets were mixed 2:1 by mass (Figure 1). Cell lysis and Gelfree fractionation (12% cartridge) were conducted as previously described.3 See Supplementary Experimental Methods in the Supporting Information for details of these procedures. Fractions 3–12 were subjected to methanol–chloroform precipitation12 to remove SDS in the samples. Intact proteins were redissolved in 95:5 H2O:ACN (acetonitrile) with 0.1% formic acid. Intact-mass data were collected by LC-MS analysis on a Thermo Scientific LTQ Orbitrap Velos mass spectrometer without fragmentation. Each fraction was injected twice (two technical replicates), using an AGC target setting of 106, with a maximum fill time of 500 ms. A lock-mass standard (penta-asparagine) was added to the chromatographic buffer for continuous mass calibration13 (Supplementary Experimental Methods). Three biological replicates were performed, yielding a total of 58 files of mass spectra (in .raw format).
Figure 1.

Schematic workflow of proteoform family identification using NeuCode SILAC10 and the G-PTM-D strategy.7 The purpose of the NeuCode SILAC and intact-mass proteomics is to characterize experimentally observed intact proteoforms in E. coli lysate. The purpose of the normal cell culture and bottom-up proteomics is to construct a G-PTM-D database with complete PTM data, which helps proteoform family assembly and identification.
Spectral data were deconvoluted into monoisotopic mass components (Supplementary Experimental Methods) and mass-calibrated based upon the lock-mass standard. These deconvoluted components were analyzed to identify proteoforms and assemble proteoform families in Proteoform Suite software (v0.1.12; available at https://smith-chem-wisc.github.io/ProteoformSuite; a brief overview of Proteoform Suite is given below, and further details are provided in the Supplementary Experimental Methods). Proteoform Suite initially identifies mass values of proteoform isotopologue pairs (NeuCode pairs). Based on the 2:1 mixing ratio employed, only the NeuCode pairs with intensity ratios between 1.4:1 and 3.0:1 were retained for further analysis (Supporting Information Figure S-1). Proteoform Suite then uses the 36 mDa per lysine residue mass difference between the light and heavy lysines to calculate the number of lysine residues for each NeuCode pair and aggregates them into a list of unique experimental proteoforms. This aggregation step eliminates the redundancy that comes from multiple observations of the same proteoform. Aggregation tolerance was set to ±10 ppm for mass and ±5 min for chromatographic retention time (RT). The Proteoform Suite software then employed a previously described three-stage strategy.3 First, a catalog of theoretical proteoforms was generated from a protein database (either downloaded from UniProt or generated using the G-PTM-D strategy as described above), allowing unique combinations of up to three PTM occurrences on each protein. The masses of the experimental proteoforms were compared with the masses of theoretical proteoforms having the same lysine count, and experimental–theoretical (ET) pairs with mass differences within 300 Da were generated for further analysis. These ET pairs were grouped by their mass differences, and groups with a difference corresponding to an exact match or any of a defined set of modifications (within ±0.03 Da error) were accepted for utilization in the construction of proteoform families. Second, experimental–experimental (EE) pairs were generated and grouped by a similar process of comparison between all of the experimentally observed proteoform masses of the same lysine count. Third, accepted ET and EE pairs sharing common proteoforms were assembled into proteoform families. Proteoform families that had theoretical proteoform members from one single gene became gene-centric families and were thus considered to be identified. Assembled proteoform families were visualized using Cytoscape,14,15 with nodes (circles) representing proteoforms and edges (lines) representing exact matches (0 Da mass difference) or selected PTM mass differences.
Bottom-up Proteomics and G-PTM-D Database Construction
E. coli KL334 cells were cultured for bottom-up proteomics as described above for intact-mass proteomics but using growth medium containing normal lysine instead of isotopically tagged lysine analogues. Cells were lysed and Gelfree fractionated (Figure 1). The eFASP procedure16 was performed on 1/8 (37.5 µL) of the volume of each of fractions 3–12 for on-filter trypsin digestion and detergent removal. Peptides were desalted and further purified by C18 solid-phase extraction and reconstituted in 95:5 H2O:ACN solution with 0.1% formic acid. Tandem mass spectrometry with HCD (higher-energy collisional dissociation) was conducted on the Thermo Scientific LTQ Orbitrap Velos, generating 20 data files (10 fractions × 2 technical replicates of injection; in .raw file format). Detailed procedures are provided in the Supplementary Experimental Methods.
The previously described G-PTM-D search workflow7 was performed on these high-resolution bottom-up data in the MetaMorpheus software (v0.0.80, available at https://github.com/smith-chem-wisc/MetaMorpheus/releases). The goal of this strategy is to discover protein PTMs that are not present in the UniProt search database. First, the raw data files are searched with ±10 ppm precursor mass tolerance and ±0.01 Da product mass tolerances against the UniProt E. coli XML database and are calibrated based on the results. Calibrated files (in .mzML format) are searched a second time with ±2 ppm precursor mass tolerance around 0 Da (exact match with a target peptide) and around a list of mass difference values corresponding to selected PTMs (Supporting Information Table S-1). The previously unknown modified peptides identified in this second search are added by MetaMorpheus into the database as PTMs at specific residue locations (analogous to the curated PTMs in the original UniProt XML database). This expanded database is referred to as the “G-PTM-D database”, which can be used by Proteoform Suite to generate a catalog of theoretical proteoforms containing these discovered PTMs. A third MetaMorpheus search was performed on bottom-up data against the G-PTM-D database to generate a final expanded list of peptide identifications, subject to standard false discovery rate (FDR) criteria. Further details of MetaMorpheus are provided in the Supplementary Experimental Methods.
RESULTS AND DISCUSSION
Experimentally Observed Intact Proteoforms
Mass spectra from the 58 data files obtained from analysis of intact protein (undigested) samples were deconvoluted into 352 709 mass components. Proteoform Suite identified 90 259 NeuCode pairs and accepted 59 060 pairs falling within the selected intensity ratio range of 1.4:1 to 3:1 (Supporting Information Figure S-1). These were aggregated into 2244 experimental proteoforms (Supporting Information Table S-2), which were then analyzed by Proteoform Suite using the three-stage strategy described in the experimental section.
G-PTM-D Improves Proteoform Identification
In order to evaluate the effect of the G-PTM-D strategy upon proteoform identifications and family construction, Proteoform Suite analysis was performed using two different catalogs of theoretical proteoforms: (i) a catalog derived from the UniProt database and (ii) a catalog derived from the G-PTM-D database. The results obtained are summarized in Figure 2, and details of the two approaches are presented below. The catalog derived from the G-PTM-D database yielded an approximately 10% increase in identified proteoforms, compared to that derived from the UniProt database (504 and 465 identified proteoforms, respectively). More importantly, with the G-PTM-D-assisted analysis, 171 of the identifications were from exact matches to a proteoform catalog entry, 94 of which corresponded to PTM-modified proteins; with UniProt alone, only 77 of the identifications were from exact matches to the proteoform catalog, none of which corresponded to PTM-modified proteins. G-PTM-D enabled identifications of PTM-modified proteins based upon robust PTM identifications and localizations in bottom-up proteomic data.
Figure 2.

Comparison of proteoform identification and proteoform family construction results using databases from UniProt (left) and G-PTM-D (right). PSM stands for peptide spectral match.
Proteoform Identifications and Family Construction Using the UniProt Database
A theoretical proteoform catalog was constructed using sequences and PTMs from the canonical UniProt E. coli XML database. N-Terminal methionines were included in each theoretical proteoform, as a considerable portion of the E. coli proteome retains the N-terminal methionine residue.17 The catalog contained 5657 theoretical proteoforms (Supporting Information Table S-3). An ET mass difference histogram was prepared by comparing the 2244 experimental proteoforms to the theoretical proteoforms of the same lysine count (Figure 3A). A mass difference at 0 Da indicates an exact match of the experimental proteoform to a theoretical proteoform. Other peaks in the ET histogram correspond to common proteoform mass differences (e.g., PTMs, amino acid losses). In order to evaluate the FDR for proteoforms identified with each mass difference, an experimental-decoy (ED) histogram was constructed using decoy theoretical proteoforms to calculate FDRs for each individual peak. This process has previously been described in detail.3 Five separate decoy databases were constructed, and FDRs for each individual ET peak were calculated separately using each of them. The resultant five FDRs for each peak were averaged to give the reported FDRs. The maximum FDR allowed for any individual ET peak was arbitrarily set at 15% (Supporting Information Tables S-4 and S-5); peaks with FDRs greater than this value were discarded. Fourteen of the mass difference peaks in the ET histogram, containing 271 ET pairs, were selected for use in construction of proteoform families. The weighted average FDR of these 14 selected peaks yields an overall FDR of 2.3% for ET proteoform identifications (Supplementary Experimental Methods).
Figure 3.

Mass difference histograms. (A) Mass differences between experimental proteoforms and theoretical proteoforms with the same lysine count, obtained from a catalog derived from the UniProt database. (B) Mass differences between experimentally observed proteoforms having the same lysine count. (C) Mass differences between experimental proteoforms and theoretical proteoforms with the same lysine count, obtained from a catalog derived from the G-PTM-D database. Highlighted mass differences are those directly attributable to common modifications (e.g., oxidation, acetylation, and phosphorylation) or amino acid losses (mostly N-terminal methionine). Supporting Information Table S-5 lists all of the selected peaks included in the assembly of proteoform families.
A mass difference histogram for EE pairs was prepared by comparing each of the 2244 experimental proteoforms to all other experimental proteoforms with the same lysine count (Figure 3B). As with ET comparisons, peaks in the EE histogram correspond to common proteoform mass differences. The FDR for each peak was estimated as previously described.3 The maximum FDR allowed for any individual EE peak was set at 17% (Supporting Information Tables S-4 and S-5). Twenty-four of the peaks in the EE histogram, containing 972 EE pairs, were selected for use in construction of proteoform families. The weighted average FDR for all selected peaks gave an overall FDR of 0.73% for EE assignments.
Proteoform families were formed by joining together any of the 271 ET and 972 EE pairs that share a common proteoform. Each ET and EE pair consists of two nodes (masses of the two proteoforms) and one edge (the mass difference between the two proteoforms). All pairs having a common node were joined together to form discrete proteoform families (see Figure 4 for examples). This process yielded 288 proteoform families (Supporting Information Table S-6), containing 1039 of the original 2244 experimentally observed proteoforms. The remaining 1205 experimental proteoforms were “orphans”, meaning they are not related to any theoretical or other experimental proteoform by a selected mass difference.
Figure 4.

(A, B) Two examples of proteoform families assembled using either a UniProt database or a G-PTM-D database. Gene names (pink squares) connect all theoretical proteoforms (green nodes) in the family. Theoretical proteoforms are labeled “unmodified” or with PTM information. Those that include N-terminal methionine residues are labeled “full sequence”. Experimentally observed proteoforms (blue nodes) are labeled with a number generated by Proteoform Suite (E****) as an internal identifier, their masses, and annotated with deduced PTMs or other changes. The nodes are arranged counterclockwise in ascending order of mass. The size of each node corresponds to the integrated intensity of the mass spectral peaks observed for that proteoform. The edges connecting the proteoforms correspond to the mass differences between them in Daltons and thus reflect PTMs or other changes. Turquoise annotations are from the initial UniProt analysis, while red annotations are confirmed PTMs or new findings from the G-PTM-D-assisted analysis. (C) An array of all 289 families assembled using the G-PTM-D database.
Eighty-two of the 288 families were unambiguously identified, meaning they contain theoretical proteoform members corresponding to a single gene name. These 82 identified families were comprised of 465 experimental proteoforms. Among these identified proteoforms, 77 were exact matches to a theoretical catalog entry. However, none of these were annotated with PTMs, meaning they were all unmodified proteoforms (Figure 2). The modified proteoforms were identified only through EE connections (Supporting Information Table S-7).
Proteoform Identifications and Family Construction Using the G-PTM-D Database
A theoretical proteoform catalog was constructed using sequences and PTMs from the G-PTM-D database (see above). This database contained an additional 5483 modified residues over the 522 already included in the canonical UniProt database (Supporting Information Table S-8). N-Terminal methionines were again included in each of the theoretical proteoforms. The catalog contained 16 096 theoretical proteoforms (Supporting Information Table S-9), an increase of 2.8-fold over the catalog generated from UniProt (Supporting Information Table S-3). This increase reflects the additional theoretical proteoforms formed by addition of the new PTMs (modified residues) discovered in the bottom-up proteomic data. An ET mass difference histogram was prepared (Figure 3C) and showed a 2.2-fold increase at peak 0 from the UniProt ET histogram (from 81 to 176), while the peaks representing other PTMs diminished. This shows that many experimental proteoforms, which previously had a PTM mass difference from an unmodified theoretical, indicated as a peak in the ET histogram, became exact matches to theoretical PTM-modified proteoforms. In this study, 17 peaks in the ET histogram (due to common PTMs or amino acid losses), containing 313 ET pairs, were selected to construct proteoform families (Supporting Information Table S-5). The maximum median FDR for any individual ET peak was 13% (Supporting Information Tables S-4 and S-5). The weighted average FDR for all these ET identifications was 2.8%. As switching to the G-PTM-D database does not affect EE pairs, the same EE mass histogram described above (Figure 3B) was used for proteoform family construction.
Proteoform families were formed by joining together any of the 313 ET and 972 EE pairs that share a common proteoform. This process yielded 289 proteoform families (Supporting Information Table S-10), containing 1064 of the original 2244 experimentally observed proteoforms. The remaining 1180 experimental proteoforms were orphans.
These 289 families contain 92 unambiguously identified families (Supporting Information Tables S-10 and S-11), which were comprised of 504 experimental proteoforms. Among these identified proteoforms, 171 are exact matches to a theoretical catalog entry (Figure 2), and 94 of the matching theoretical proteoforms are annotated with PTM information from modified peptides in the G-PTM-D database expanded using E. coli bottom-up data. These 94 proteoforms (Supporting Information Table S-12) are likely the most reliably identified PTM-derived E. coli proteoforms in this study, as they were confirmed by both intact-mass and bottom-up proteomics.
Elucidation of Proteoform Families
The 289 (92 identified, 5 ambiguous, and 192 unidentified) family clusters assembled by Proteoform Suite in the G-PTM-D-assisted analysis are displayed in Figure 4. Each of these families has 1–67 experimental members, with an average of 4 members. For the 92 identified families, the average size is 5 members (Supporting Information Table S-10, Supporting Information Figure S-2). The identified families include a variety of different types of proteins, such as transcription factors, translation factors, ribosomal proteins, and others (Supporting Information Table S-11). Two proteoform family examples are shown in Figure 4A and 4B. Integration host factor (IHF) is a specific DNA-binding protein.18 The IHF subunit beta family based upon the UniProt database alone consisted of two experimental proteoforms, one unmodified (E119) and the other oxidized (E577) (Figure 4A). The G-PTM-D-assisted analysis provided confirmation of the oxidized proteoform, as it exactly matched a newly included modified proteoform. In addition, an orphan proteoform (E2056), which was unidentified when using the UniProt database alone, was confidently identified as triply oxidized IHF subunit beta by the G-PTM-D analysis and was thus included in this family. All experimental proteoforms in this family are derived from the protein with full sequence (N-terminal methionine retained). This is consistent with the documented sequence on the UniProt web site and was also confirmed by 29 peptide spectral matches (PSMs) of the N-terminal peptide (residues 1–9) in the bottom-up data. This protein may be an example of the penultimate amino acid, threonine in this case, inhibiting cleavage of the initiator methionine residue.17,19 Translation initiation factor IF-1 was not identified during analysis using the UniProt database alone (Figure 4B left), but the addition of a modified theoretical proteoform in the analysis using the G-PTM-D-assisted database enabled identification of all four original members, plus a former orphan proteoform (E1169) (Figure 4B, right). The phosphorylation observed on IF-1, which has not previously been reported, suggests that this protein may use a phosphate group to carry out translational regulation. These two examples illustrate how proteoform and proteoform family identification can be improved both quantitatively and qualitatively by G-PTM-D-assisted analysis.
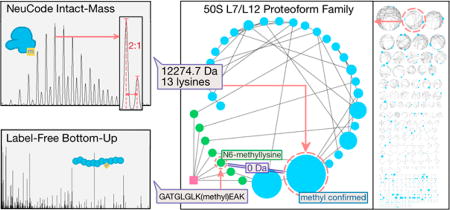
The L7/L12 Proteoform Family
Nearly half of the identified families (41 families) are ribosome-associated proteins (50S subunit, 30S subunit proteins, and binding factors). This is not surprising because ribosomal proteins are the most abundant proteins in the E. coli cytosol.20 One of them is 50S ribosomal protein L7/L12, which with 27 experimentally observed proteoforms comprises the second largest proteoform family identified in the G-PTM-D-assisted analysis of this study, indicating it is heavily modified (Figure 5). Protein L7/L12 is a key component of the E. coli (prokaryotic) ribosome pentameric stalk complex L8,21 which is a binding site for translation factors and GTPase-associated domains.22 L7 and L12 are both products of the same gene in E. coli, with identical amino acid sequence, differing only in the presence (L7) or absence (L12) of a N-terminal serine acetylation.23 The highly mobile L7/L12 C-terminal domain assists recruitment of translation initiation, elongation, and termination factors to the ribosome,24,25 as well as stimulating factor-dependent GTP-hydrolysis.26 The large number of experimental proteoforms observed is consistent with the rich variety of important biological activities associated with this protein. All proteoforms in this family lack N-terminal methionine, consistent with previous studies.27,28
Figure 5.

Ribosomal protein L7/L12 proteoform family generated using either (A) the UniProt database or (B) the G-PTM-D database. Same as in Figure 4, the turquoise annotations are from the initial UniProt analysis, while red annotations are confirmed PTMs or new findings from the G-PTM-D-assisted analysis. Node E867 was an orphan proteoform in the analysis using the UniProt database and thus is not shown in panel A.
The G-PTM-D strategy greatly assisted the identification of L7/L12 proteoform family members (see Figure 5). Five modified theoretical L7/L12 proteoforms were added to the family based on their 0 Da connections to the experimental proteoforms. Also new to the L7/L12 family were three experimental proteoforms (E2062, E2256, and E867) that were previously either unidentified or an orphan. They were matched to three of the five new theoretical proteoform members arising from the G-PTM-D database, revealing their connection to this family.
Proteoform identification also became clearer and more accurate with new modification information from the G-PTM-D strategy. In the analysis based upon the UniProt database alone, many experimental proteoforms in the L7/L12 family could be assigned to any of multiple different proteoforms with different PTM combinations. For example, E300 (12 319 Da) could be assigned to any of three possible modified proteoforms: (i) acetylation + oxidation; (ii) methylation + carboxylation; or (iii) trimethylation + oxidation, all around +58 Da (exact mass differences are provided in Supporting Information Table S-5). This leads to ambiguity of identifying the related experimental proteoforms E736 and E1276. Moreover, two proteoforms, E2145 and E50, have very close mass differences, both being around 42 Da heavier than the unmodified proteoform. These two proteoforms exhibited a difference in RT of 15 min. Their identities were not clear from the analysis using the UniProt database alone, as insufficient PTM information was available. A mass difference around +42 Da could be either acetylation or trimethylation, which are difficult to differentiate, as described in previous PTM studies of prokaryotic L7/L12.29,30 Using the G-PTM-D database helped the differentiation of these two PTMs. E2145 was an exact match to an N-terminal-serine acetylated proteoform (L7). On the other hand, E50 is 0.06 Da heavier than the mass expected for an acetylation PTM, suggesting that it is likely to correspond instead to a trimethylation. This crucial information clarified the previously vague identity of E50’s downstream E1390, E154, and E2020, as these four proteoforms form a “butterfly network” in the family (highlighted in yellow in Figure 5B; see Supplementary Experimental Methods in the Supporting Information for a more detailed explanation of the term “butterfly network” and its utility). Similar reasoning helped to assign other proteoforms (see the green and orange butterfly networks in Figure 5B). For example, E300 was clarified to be combination (iii) trimethylation + oxidation. The PTM mass differences for the incorrect possibilities were eliminated in Figure 5B, and other alterations of this figure (elimination of specific nodes and edges from the Proteoform Suite output) are described in the Supplementary Experimental Methods.
The PTMs identified in the L7/L12 family include methylation, oxidation, acetylation, and deamidation. Methylation and acetylation are commonly observed for ribosomal proteins in prokaryotic organisms.29,30 Multiple methylations of E. coli L7/L12 have been previously reported,31 and methylation of Lys82 has been well-studied.32 The largest node (E70) in Figure 5B corresponds to monomethylated L7/L12 protein. Although from measurements of intact mass alone it is not possible to localize PTMs, clues as to likely localizations are afforded by the bottom-up data and G-PTM-D analysis. For example, we found close to 90 PSMs for the tryptic peptide containing methylated Lys82 in our bottom-up data. This suggests that the E70 monomethylated proteoform likely includes this methylated form of the L7/L12 protein, and possibly other forms as well which were not detected in the bottom-up analysis. Some artifacts of sample preparation were also evident from the intact proteoform data set. For example, proteoforms with carbamidomethylation (CAM, + 57.02 Da) are present in the L7/L12 family. Cysteine CAM modifications produced under the standard cysteine reduction and alkylation procedures employed in the intact protein preparation protocol (see Experimental Procedures) are already taken into consideration in MetaMorpheus and Proteoform Suite. Therefore, these CAM modifications must be present on sites such as the N-terminus, lysine, methionine, or histidine side chains, or carboxylates (aspartate and glutamate). This is a common occurrence due to alkylation by excess iodoacetamide during sample preparation.33,34 Another artifact observed was the lauryl sulfuric acid adduct (266 Da), which likely results from incomplete detergent (SDS) removal;35 the heaviest proteoform (E323) in this family had three such adducts. While sample preparation artifacts are not biologically relevant, it is still important to correctly assign them so as not to misidentify them as some other PTM. The artifacts along with the numerous PTMs on the L7/L12 protein demonstrate the ability of intact mass analysis combined with lysine counting and G-PTM-D to assign numerous related proteoforms to one large interconnected proteoform family.
Combined Intact-Mass and Bottom-up Proteomics Reveals E. coli Proteoform Complexity
The proteoform family analysis presented here provides a new view of proteoform complexity in E. coli. The use of Proteoform Suite in conjunction with the G-PTM-D strategy integrates knowledge obtained from intact-mass analysis with that afforded by comprehensive bottom-up proteomics. Previous studies of the E. coli proteome employed either bottom-up or top-down proteomic strategies. Most bottom-up studies of E. coli PTMs utilized enrichment methods, such as immunoprecipitation and affinity chromatography during sample preparation.36–40 These studies have been limited to investigating one type of PTM at a time. Three groups recently examined the E. coli proteome and its PTMs on a large-scale, also using the bottom-up approach.41–43 Data were collected under as many as 22 separate growth conditions, and as many as 9 time points in growth, identifying over 2000 proteins with varying degrees of sequence coverage. However, despite this tremendous effort to precisely measure condition-dependent protein concentrations and provide insight into system-wide protein expression and regulation, such bottom-up studies are not able to provide information on the presence or abundance of proteoforms. In one E. coli proteoform study using the top-down approach, Bunger et al. found 322 proteoforms representing 174 proteins.44 However, the majority of them were products from C- and N-terminal proteolysis. None were PTM-containing proteoforms. The strategy presented here, in contrast, requires no enrichment procedure for prespecified PTMs, integrates global PTM discovery and intact-mass proteomics, and provides the ability to visualize proteoform families. While the bottom-up analysis in the present study revealed 2278 proteins, commensurate with previous work, we were also able to provide the deepest coverage of proteoforms ever reported for E. coli, consisting of 504 PTM-annotated proteoforms in 92 families. Consistent with previous studies, the major PTMs observed in these E. coli proteoforms were methylation, oxidation, and acetylation.41–43
CONCLUSIONS
The integrated proteomics strategy presented here is a powerful and reliable workflow to identify proteoforms with deeper coverage and higher confidence. The success of the strategy demonstrated on the relatively simple E. coli system suggests its potential for other more complex organisms, which are generally characterized by a greater diversity and complexity of PTMs. However, the strategy in its present state still faces a number of limitations, probably the most significant of which is the current limitation in mass range. Both the 12% Gelfree cartridge fractionation and the mass range limitations of the Orbitrap mass spectrometer employed for the present study limit the accessible molecular weight of the proteoforms observed. As a result, proteins larger than 45 kDa were not included in this study (Supporting Information Figure S-3). In future work, we will seek to further extend mass range and explore other mass spectrometry platforms, such as Fourier transform ion cyclotron resonance (FTICR)45 and time-of-flight (TOF) mass analyzers.46
Supplementary Material
Acknowledgments
We thank Professor Albert Heck for helpful conversations on E. coli ribosomal proteins. This work was supported by the National Institute of General Medical Sciences, NIH grant R01GM114292. A.J.C. was supported by the Computation and Informatics in Biology and Medicine Training Program, T15LM007359. L.V.S. was supported by the Biotechnology Training Program, T32GM008349.
Footnotes
ASSOCIATED CONTENT
- Supplementary Experimental Methods; raw data files; Figure S-1: lysine count and intensity ratio distribution of NeuCode pairs; Figure S-2: histogram of proteoform members in identified families; Figure S-3: molecular weight histogram of identified proteins; Figure S-4: fractionation result on a PAGE gel (PDF)
- Table S-1: mass differences used in building the G-PTM-D database; Table S-2: complete list of 2244 aggregated experimental proteoforms; Table S-3: theoretical proteoforms derived from the E. coli UniProt XML database; Table S-4: complete list of ET and EE mass differences; Table S-5: selected ET and EE mass differences with FDR test results; Table S-6: proteoform families assembled in the analysis with UniProt database; Table S-7: experimental proteoforms identified from ET connections (UniProt); Table S-8: PTMs of newly added modified peptides in the G-PTM-D database; Table S-9: theoretical proteoforms derived from the E. coli G-PTM-D database; Table S-10: proteoform families assembled in the analysis with G-PTM-D database; Table S-11: associated gene names of families (identified and ambiguous); Table S-12: experimental proteoforms identified from ET connections (G-PTM-D) (XLSX)
Author Contributions
L.M.S., M.R.S., B.L.F., and M.S. conceived of the use of intact-mass, lysine count, and global PTM discovery for E. coli proteoform identification and family assembly. Y.D. prepared samples for analysis. Y.D. and M.S. performed the mass analysis. Y.D. and B.L.F. deconvoluted the intact-mass spectra. Y.D, S.S., and L.V.S. calibrated the data. Y.D. analyzed the mass spectrometric data. A.J.C., M.R.S., L.V.S., and S.S. developed Proteoform Suite software. S.S. developed MetaMorpheus software. Y.D., L.M.S., and M.R.S. wrote the manuscript. All authors edited the manuscript.
The authors declare no competing financial interest.
References
- 1.Smith LM, Kelleher NL. Consortium for Top Down Proteomics. Proteoform: a single term describing protein complexity. Nat. Methods. 2013;10:186–187. doi: 10.1038/nmeth.2369. [DOI] [PMC free article] [PubMed] [Google Scholar]
- 2.Sheynkman GM, Shortreed MR, Cesnik AJ, Smith LM. Proteogenomics: Integrating Next-Generation Sequencing and Mass Spectrometry to Characterize Human Proteomic Variation. Annu. Rev. Anal. Chem. 2016;9:521–545. doi: 10.1146/annurev-anchem-071015-041722. [DOI] [PMC free article] [PubMed] [Google Scholar]
- 3.Shortreed MR, Frey BL, Scalf M, Knoener RA, Cesnik AJ, Smith LM. Elucidating Proteoform Families from Proteoform Intact-Mass and Lysine-Count Measurements. J. Proteome Res. 2016;15:1213–1221. doi: 10.1021/acs.jproteome.5b01090. [DOI] [PMC free article] [PubMed] [Google Scholar]
- 4.Roth MJ, Parks BA, Ferguson JT, Boyne MT, 2nd, Kelleher NL. ″Proteotyping″: population proteomics of human leukocytes using top down mass spectrometry. Anal. Chem. 2008;80:2857–2866. doi: 10.1021/ac800141g. [DOI] [PMC free article] [PubMed] [Google Scholar]
- 5.Roth MJ, Forbes AJ, Boyne MT, 2nd, Kim YB, Robinson DE, Kelleher NL. Precise and parallel characterization of coding polymorphisms, alternative splicing, and modifications in human proteins by mass spectrometry. Mol. Cell. Proteomics. 2005;4:1002–1008. doi: 10.1074/mcp.M500064-MCP200. [DOI] [PMC free article] [PubMed] [Google Scholar]
- 6.Riley NM, Mullen C, Weisbrod CR, Sharma S, Senko MW, Zabrouskov V, Westphall MS, Syka JE, Coon JJ. Enhanced Dissociation of Intact Proteins with High Capacity Electron Transfer Dissociation. J. Am. Soc. Mass Spectrom. 2016;27:520–531. doi: 10.1007/s13361-015-1306-8. [DOI] [PMC free article] [PubMed] [Google Scholar]
- 7.Li Q, Shortreed MR, Wenger CD, Frey BL, Schaffer LV, Scalf M, Smith LM. Global Post-Translational Modification Discovery. J. Proteome Res. 2017;16:1383–1390. doi: 10.1021/acs.jproteome.6b00034. [DOI] [PMC free article] [PubMed] [Google Scholar]
- 8.Ong SE, Blagoev B, Kratchmarova I, Kristensen DB, Steen H, Pandey A, Mann M. Stable isotope labeling by amino acids in cell culture, SILAC, as a simple and accurate approach to expression proteomics. Mol. Cell. Proteomics. 2002;1:376–386. doi: 10.1074/mcp.m200025-mcp200. [DOI] [PubMed] [Google Scholar]
- 9.Lamos SM, Shortreed MR, Frey BL, Belshaw PJ, Smith LM. Relative quantification of carboxylic acid metabolites by liquid chromatography-mass spectrometry using isotopic variants of cholamine. Anal. Chem. 2007;79:5143–5149. doi: 10.1021/ac062416m. [DOI] [PMC free article] [PubMed] [Google Scholar]
- 10.Hebert AS, Merrill AE, Bailey DJ, Still AJ, Westphall MS, Strieter ER, Pagliarini DJ, Coon JJ. Neutron-encoded mass signatures for multiplexed proteome quantification. Nat. Methods. 2013;10:332–334. doi: 10.1038/nmeth.2378. [DOI] [PMC free article] [PubMed] [Google Scholar]
- 11.Frohlich F, Christiano R, Walther TC. Native SILAC: metabolic labeling of proteins in prototroph microorganisms based on lysine synthesis regulation. Mol. Cell. Proteomics. 2013;12:1995–2005. doi: 10.1074/mcp.M112.025742. [DOI] [PMC free article] [PubMed] [Google Scholar]
- 12.Wessel D, Flugge UI. A method for the quantitative recovery of protein in dilute solution in the presence of detergents and lipids. Anal. Biochem. 1984;138:141–143. doi: 10.1016/0003-2697(84)90782-6. [DOI] [PubMed] [Google Scholar]
- 13.Staes A, Vandenbussche J, Demol H, Goethals M, Yilmaz S, Hulstaert N, Degroeve S, Kelchtermans P, Martens L, Gevaert K. Asn3, a reliable, robust, and universal lock mass for improved accuracy in LC-MS and LC-MS/MS. Anal. Chem. 2013;85:11054–11060. doi: 10.1021/ac4027093. [DOI] [PubMed] [Google Scholar]
- 14.Shannon P, Markiel A, Ozier O, Baliga NS, Wang JT, Ramage D, Amin N, Schwikowski B, Ideker T. Cytoscape: a software environment for integrated models of biomolecular interaction networks. Genome Res. 2003;13:2498–2504. doi: 10.1101/gr.1239303. [DOI] [PMC free article] [PubMed] [Google Scholar]
- 15.Smoot ME, Ono K, Ruscheinski J, Wang PL, Ideker T. Cytoscape 2.8: new features for data integration and network visualization. Bioinformatics. 2011;27:431–432. doi: 10.1093/bioinformatics/btq675. [DOI] [PMC free article] [PubMed] [Google Scholar]
- 16.Erde J, Loo RR, Loo JA. Enhanced FASP (eFASP) to increase proteome coverage and sample recovery for quantitative proteomic experiments. J. Proteome Res. 2014;13:1885–1895. doi: 10.1021/pr4010019. [DOI] [PMC free article] [PubMed] [Google Scholar]
- 17.Frottin F, Martinez A, Peynot P, Mitra S, Holz RC, Giglione C, Meinnel T. The proteomics of N-terminal methionine cleavage. Mol. Cell. Proteomics. 2006;5:2336–2349. doi: 10.1074/mcp.M600225-MCP200. [DOI] [PubMed] [Google Scholar]
- 18.Craig NL, Nash HA. E. coli integration host factor binds to specific sites in DNA. Cell. 1984;39:707–716. doi: 10.1016/0092-8674(84)90478-1. [DOI] [PubMed] [Google Scholar]
- 19.Hirel PH, Schmitter MJ, Dessen P, Fayat G, Blanquet S. Extent of N-terminal methionine excision from Escherichia coli proteins is governed by the side-chain length of the penultimate amino acid. Proc. Natl. Acad. Sci. U. S. A. 1989;86:8247–8251. doi: 10.1073/pnas.86.21.8247. [DOI] [PMC free article] [PubMed] [Google Scholar]
- 20.Ishihama Y, Schmidt T, Rappsilber J, Mann M, Hartl FU, Kerner MJ, Frishman D. Protein abundance profiling of the Escherichia coli cytosol. BMC Genomics. 2008;9:102. doi: 10.1186/1471-2164-9-102. [DOI] [PMC free article] [PubMed] [Google Scholar]
- 21.Pettersson I, Hardy SJ, Liljas A. The ribosomal protein L8 is a complex L7/L12 and L10. FEBS Lett. 1976;64:135–138. doi: 10.1016/0014-5793(76)80267-0. [DOI] [PubMed] [Google Scholar]
- 22.Wahl MC, Moller W. Structure and function of the acidic ribosomal stalk proteins. Curr. Protein Pept. Sci. 2002;3:93–106. doi: 10.2174/1389203023380756. [DOI] [PubMed] [Google Scholar]
- 23.Terhorst C, Wittmann-Liebold B, Moller W. 50-S ribosomal proteins. Peptide studies on two acidic proteins, A 1 and A 2, isolated from 50-S ribosomes of Escherichia coli. Eur. J. Biochem. 1972;25:13–19. doi: 10.1111/j.1432-1033.1972.tb01661.x. [DOI] [PubMed] [Google Scholar]
- 24.Carlson MA, Haddad BG, Weis AJ, Blackwood CS, Shelton CD, Wuerth ME, Walter JD, Spiegel PC., Jr Ribosomal protein L7/L12 is required for GTPase translation factors EF-G, RF3, and IF2 to bind in their GTP state to 70S ribosomes. FEBS J. 2017;284:1631–1643. doi: 10.1111/febs.14067. [DOI] [PMC free article] [PubMed] [Google Scholar]
- 25.Pettersson I, Kurland CG. Ribosomal protein L7/L12 is required for optimal translation. Proc. Natl. Acad. Sci. U. S. A. 1980;77:4007–4010. doi: 10.1073/pnas.77.7.4007. [DOI] [PMC free article] [PubMed] [Google Scholar]
- 26.Diaconu M, Kothe U, Schlunzen F, Fischer N, Harms JM, Tonevitsky AG, Stark H, Rodnina MV, Wahl MC. Structural basis for the function of the ribosomal L7/12 stalk in factor binding and GTPase activation. Cell. 2005;121:991–1004. doi: 10.1016/j.cell.2005.04.015. [DOI] [PubMed] [Google Scholar]
- 27.Arnold RJ, Reilly JP. Observation of Escherichia coli ribosomal proteins and their posttranslational modifications by mass spectrometry. Anal. Biochem. 1999;269:105–112. doi: 10.1006/abio.1998.3077. [DOI] [PubMed] [Google Scholar]
- 28.Wilkins MR, Gasteiger E, Tonella L, Ou K, Tyler M, Sanchez JC, Gooley AA, Walsh BJ, Bairoch A, Appel RD, Williams KL, Hochstrasser DF. Protein identification with N and C-terminal sequence tags in proteome projects. J. Mol. Biol. 1998;278:599–608. doi: 10.1006/jmbi.1998.1726. [DOI] [PubMed] [Google Scholar]
- 29.Suh MJ, Hamburg DM, Gregory ST, Dahlberg AE, Limbach PA. Extending ribosomal protein identifications to unsequenced bacterial strains using matrix-assisted laser desorption/ionization mass spectrometry. Proteomics. 2005;5:4818–4831. doi: 10.1002/pmic.200402111. [DOI] [PMC free article] [PubMed] [Google Scholar]
- 30.Strader MB, Verberkmoes NC, Tabb DL, Connelly HM, Barton JW, Bruce BD, Pelletier DA, Davison BH, Hettich RL, Larimer FW, Hurst GB. Characterization of the 70S Ribosome from Rhodopseudomonas palustris using an integrated ″top-down″ and ″bottom-up″ mass spectrometric approach. J. Proteome Res. 2004;3:965–978. doi: 10.1021/pr049940z. [DOI] [PubMed] [Google Scholar]
- 31.Chang FN. Temperature-dependent variation in the extent of methylation of ribosomal proteins L7 and L12 in Escherichia coli. J. Bacteriol. 1978;135:1165–1166. doi: 10.1128/jb.135.3.1165-1166.1978. [DOI] [PMC free article] [PubMed] [Google Scholar]
- 32.Malecki J, Dahl HA, Moen A, Davydova E, Falnes PO. The METTL20 Homologue from Agrobacterium tumefaciens Is a Dual Specificity Protein-lysine Methyltransferase That Targets Ribosomal Protein L7/L12 and the beta Subunit of Electron Transfer Flavoprotein (ETFbeta) J. Biol. Chem. 2016;291:9581–9595. doi: 10.1074/jbc.M115.709261. [DOI] [PMC free article] [PubMed] [Google Scholar]
- 33.Crestfield AM, Moore S, Stein WH. The preparation and enzymatic hydrolysis of reduced and S-carboxymethylated proteins. J. Biol. Chem. 1963;238:622–627. [PubMed] [Google Scholar]
- 34.Boja ES, Fales HM. Overalkylation of a protein digest with iodoacetamide. Anal. Chem. 2001;73:3576–3582. doi: 10.1021/ac0103423. [DOI] [PubMed] [Google Scholar]
- 35.Guray MZ, Zheng S, Doucette AA. Mass spectrometry of intact proteins reveals + 98 u chemical artifacts following precipitation in acetone. J. Proteome Res. 2017;16:889–897. doi: 10.1021/acs.jproteome.6b00841. [DOI] [PubMed] [Google Scholar]
- 36.Cain JA, Solis N, Cordwell SJ. Beyond gene expression: the impact of protein post-translational modifications in bacteria. J. Proteomics. 2014;97:265–286. doi: 10.1016/j.jprot.2013.08.012. [DOI] [PubMed] [Google Scholar]
- 37.Villen J, Gygi SP. The SCX/IMAC enrichment approach for global phosphorylation analysis by mass spectrometry. Nat. Protoc. 2008;3:1630–1638. doi: 10.1038/nprot.2008.150. [DOI] [PMC free article] [PubMed] [Google Scholar]
- 38.Hansen AM, Chaerkady R, Sharma J, Diaz-Mejia JJ, Tyagi N, Renuse S, Jacob HK, Pinto SM, Sahasrabuddhe NA, Kim MS, Delanghe B, Srinivasan N, Emili A, Kaper JB, Pandey A. The Escherichia coli phosphotyrosine proteome relates to core pathways and virulence. PLoS Pathog. 2013;9:e1003403. doi: 10.1371/journal.ppat.1003403. [DOI] [PMC free article] [PubMed] [Google Scholar]
- 39.Weinert BT, Iesmantavicius V, Wagner SA, Scholz C, Gummesson B, Beli P, Nystrom T, Choudhary C. Acetyl-phosphate is a critical determinant of lysine acetylation in E. coli. Mol. Cell. 2013;51:265–272. doi: 10.1016/j.molcel.2013.06.003. [DOI] [PubMed] [Google Scholar]
- 40.Kuhn ML, Zemaitaitis B, Hu LI, Sahu A, Sorensen D, Minasov G, Lima BP, Scholle M, Mrksich M, Anderson WF, Gibson BW, Schilling B, Wolfe AJ. Structural, kinetic and proteomic characterization of acetyl phosphate-dependent bacterial protein acetylation. PLoS One. 2014;9:e94816. doi: 10.1371/journal.pone.0094816. [DOI] [PMC free article] [PubMed] [Google Scholar]
- 41.Soufi B, Krug K, Harst A, Macek B. Characterization of the E. coli proteome and its modifications during growth and ethanol stress. Front. Microbiol. 2015;6:103. doi: 10.3389/fmicb.2015.00103. [DOI] [PMC free article] [PubMed] [Google Scholar]
- 42.Schmidt A, Kochanowski K, Vedelaar S, Ahrne E, Volkmer B, Callipo L, Knoops K, Bauer M, Aebersold R, Heinemann M. The quantitative and condition-dependent Escherichia coli proteome. Nat. Biotechnol. 2016;34:104–110. doi: 10.1038/nbt.3418. [DOI] [PMC free article] [PubMed] [Google Scholar]
- 43.Brown CW, Sridhara V, Boutz DR, Person MD, Marcotte EM, Barrick JE, Wilke CO. Large-scale analysis of post-translational modifications in E. coli under glucose-limiting conditions. BMC Genomics. 2017;18:301. doi: 10.1186/s12864-017-3676-8. [DOI] [PMC free article] [PubMed] [Google Scholar]
- 44.Bunger MK, Cargile BJ, Ngunjiri A, Bundy JL, Stephenson JL., Jr Automated proteomics of E. coli via top-down electron-transfer dissociation mass spectrometry. Anal. Chem. 2008;80:1459–1467. doi: 10.1021/ac7018409. [DOI] [PubMed] [Google Scholar]
- 45.Marshall AG, Guan SH. Advantages of high magnetic field for Fourier transform ion cyclotron resonance mass spectrometry. Rapid Commun. Mass Spectrom. 1996;10:1819–1823. doi: 10.1002/(SICI)1097-0231(199611)10:14<1829::AID-RCM697>3.0.CO;2-U. [DOI] [PubMed] [Google Scholar]
- 46.Sobott F, Hernandez H, McCammon MG, Tito MA, Robinson CV. A tandem mass spectrometer for improved transmission and analysis of large macromolecular assemblies. Anal. Chem. 2002;74:1402–1407. doi: 10.1021/ac0110552. [DOI] [PubMed] [Google Scholar]
Associated Data
This section collects any data citations, data availability statements, or supplementary materials included in this article.