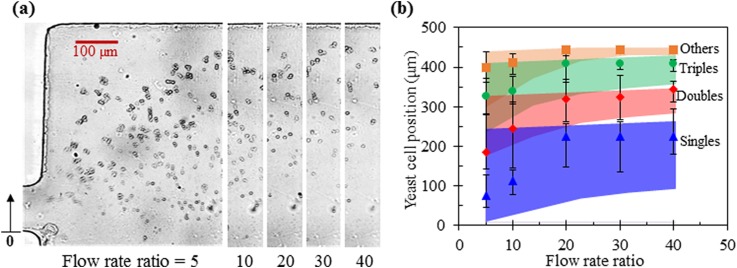
FIG. 5.
Effect of the flow rate ratio between the sheath ferrofluid (fixed at 180 μl/h) and cell suspension (varied from 36 μl/h to 4.5 μl/h) on yeast cell fractionation by morphology in 0.1× EMG 408 ferrofluid: (a) Superimposed images of four groups of yeast cells at the expansion of the main branch; (b) Comparison of the experimentally measured (symbols with error bars to cover the span of the cell stream) and numerically predicted (colored band) positions of each cell group at the expansion of the main branch. The upright arrow in the right-most image of (a) indicates the reference point to which the position of each group of cells in (b) was measured.

