

Summary
Chronic fatigue syndrome (CFS) is characterized by fatigue after exertion. A systematic review suggested that transforming growth factor (TGF)‐β concentrations are often elevated in cases of CFS when compared to healthy controls. This study attempted to replicate this finding and investigate whether post‐exertional symptoms were associated with altered cytokine protein concentrations and their RNA in CFS patients. Twenty‐four patients fulfilling Centers for Disease Control criteria for CFS, but with no comorbid psychiatric disorders, were recruited from two CFS clinics in London, UK. Twenty‐one healthy, sedentary controls were matched by gender, age and other variables. Circulating proteins and RNA were measured for TGF‐β, tumour necrosis factor (TNF), interleukin (IL)‐8, IL‐6 and IL‐1β. We measured six further cytokine protein concentrations (IL‐2, IL‐4, IL‐5, IL‐10, IL‐12p70, and interferon (IFN)‐γ). Measures were taken at rest, and before and after both commuting and aerobic exercise. CFS cases had higher TGF‐β protein levels compared to controls at rest (median (quartiles) = 43·9 (19·2, 61·8) versus 18·9 (16·1, 30·0) ng/ml) (P = 0·003), and consistently so over a 9‐day period. However, this was a spurious finding due to variation between different assay batches. There were no differences between groups in changes to TGF‐β protein concentrations after either commuting or exercise. All other cytokine protein and RNA levels were similar between cases and controls. Post‐exertional symptoms and perceived effort were not associated with any increased cytokines. We were unable to replicate previously found elevations in circulating cytokine concentrations, suggesting that elevated circulating cytokines are not important in the pathophysiology of CFS.
Keywords: chronic fatigue syndrome, cytokines, exercise, myalgic encephalomyelitis, TGF‐β
Introduction
Chronic fatigue syndrome (CFS) is an established condition of chronic and disabling fatigue and associated symptoms, which is not caused by an obvious medical disease or psychiatric illness 1, 2. Some authors believe that myalgic encephalomyelitis (ME) is a different illness, whereas others believe that ME is synonymous with CFS. The prevalence is between 0·2 and 2·6%, depending on definition 2. The most characteristic symptoms of sufferers are fatigue and malaise that are brought on by minimal exertion 1. The aetiology and pathophysiology of CFS are essentially unknown 2. The illness can be precipitated by certain infections, but we do not know why only a small proportion of people go on to develop CFS 2.
The symptoms of CFS are similar to those of acute sickness behaviour (ASB) 3. ASB has been found to be associated with proinflammatory cytokine concentrations, which are themselves associated with the individual symptoms of ASB 4. Changes in certain cytokines, such as transforming growth factor (TGF)‐β, may induce symptoms or behaviour similar to CFS 5. The similarity between the symptoms of CFS and ASB and the effects of some cytokines, along with the commonly observed onset after infections, has led to the hypothesis that abnormal cytokine regulation may be important in CFS pathophysiology 5, 6, 7. There have been three systematic reviews of the role of the immune system in CFS 8, 9, 10. The cytokines that have been measured most often in patients at rest include interleukin (IL)‐1β, tumour necrosis factor (TNF) and IL‐6 10. No significant differences between cases and controls in protein levels of these cytokines were found in between 75 and 80% of studies 10. The most consistent finding in five of eight case controls studies was that circulating TGF‐β was elevated at rest 10.
Apart from the criticisms of using different methods and not considering confounders 8, 9, 10, such as body mass index (BMI), the other problem with measuring baseline cytokine levels without behavioural stimulation is that this does not test whether or not abnormal cytokine release is associated with the characteristic symptom of post‐exertional malaise. Our pilot study showed that ordinary physical activity (commuting) was associated with significantly elevated plasma TGF‐β protein concentrations, and that aerobic exercise was associated with significantly elevated serum TNF protein concentrations in CFS cases compared to healthy controls 11.
One systematic review, of 23 case–control studies of immune changes with exercise in CFS, found no evidence to support cytokine changes with exercise 9. They did, however, find that gene expression (mRNA) was elevated for IL‐10 and Toll‐like receptor (TLR)‐4, as well as evidence to support complement 4a split product activation 9. One study, which was included in this review, also found an association between the level of mRNA, measured as the area under the curve, for both IL‐10 and TLR‐4 and post‐exercise symptom exacerbation 12. A case–control study, not included in this review, found no differences in IL‐10 receptor mRNA between groups 13.
Blundell and colleagues 10 reviewed 38 control studies systematically, which included studies examining evidence specifically for cytokine changes with exercise. Only three cytokines had been measured in five or more studies (IL‐6, IL‐1β and TNF), with the large majority of studies showing no differences between cases and controls. Two of two studies found elevated IL‐2 after exercise, and a further two of two studies found elevated TGF‐β after exercise, but no association with post‐exertional symptoms 10.
This research, highlighting the possible relevance of TGF‐β, TNF, IL‐6 and IL‐1β as well as the literature on exercise and cytokine response in the healthy population, in which TNF, IL‐1, IL‐6, IL‐10 and IL‐8 seem to be involved 14, informed our choice of hypothesized cytokine proteins (IL‐6, IL‐8, TNF and TGF‐β) for this study. By also measuring the RNA of these four hypothesized cytokines (along with IL‐1β as a correlation control for detectable protein versus RNA) we were able to explore their biological pathway. It is possible that the complex temporal regulation of cytokine expression during physical activity may not be reflected fully in simple blood concentrations 15. Although there is little evidence for this 16, it is possible that some cytokines may remain cell surface‐bound, so bioactive and peripheral levels may not be fully representative 17, 18. Measuring RNA alongside proteins allows us to determine cytokine gene expression, allowing a greater understanding of cytokine involvement in pathology and physiological processes.
The aim of this study was to test the hypothesis that cytokines are expressed excessively as a response to physical activity in patients suffering from CFS. Our hypotheses were as follows:
Aerobic exercise and commuting to hospital induce greater increases in serum protein concentrations of TGF‐β, TNF, IL‐6, IL‐8 and their RNA in cases of CFS compared to healthy sedentary controls.
Perceived effort with exercise and post‐exercise increases in malaise, fatigue and pain are associated with increased serum protein concentrations of proinflammatory cytokines, including TNF, IL‐8, IL‐6 and their RNA in cases, but not controls.
Increased post‐commuting malaise, fatigue and pain are associated with an increased serum protein concentration of TGF‐β and its RNA in cases, but not controls.
Depressed and anxious mood, physical deconditioning and sleep disturbance are mediating factors in the increased protein concentrations of the cytokines TNF, IL‐6, IL‐8 and TGF‐β in cases.
Materials and methods
CFS patients
Consecutive new adult (aged 16–65 years) out‐patient attenders at the CFS clinics at St Bartholomew's and the Royal Free hospitals in London, UK were invited to take part in this study if they met inclusion criteria. No patient from our original pilot study was recruited into this study 11. Patients with CFS diagnosed by Centers for Disease Control (CDC) (international) criteria 1, with the modification of not having any concurrent co‐morbid psychiatric disorder, were studied. We excluded those with co‐morbid psychiatric disorders (with the exception of simple phobias) in order to reduce the heterogeneity of the patient sample and reduce confounders, as certain (non‐excluding) co‐morbid psychiatric disorders such as non‐melancholic depressive disorder may also be associated with abnormal cytokine concentrations 19. We used the Standardized Clinical Interview for DSM‐IV (SCID) to screen patients and controls for psychiatric disorders 20. We excluded participants (patients and controls) if they had been taking any prescribed medications regularly during the past 2 weeks that might affect the immune system or exercise challenge. We allowed the use of selective serotonin re‐uptake inhibitors, tricyclic antidepressants and paracetamol. Participants could have certain co‐morbid medical conditions if in remission (e.g. hypothyroidism if biochemically euthyroid on thyroxine replacement therapy) 1. Medications taken during the previous week were recorded and examined in the analysis as potential confounders. We chose to recruit from secondary care, as our pilot data were from this population and because it allowed for ease of recruitment to test our primary hypotheses.
Healthy controls
The comparison group were 21 healthy but sedentary volunteers (engaging in moderate‐intensity exercise or physical activity, for up to 20 min in a single episode, less than once a week). We group‐matched controls by age (± 5 years), sex, body mass index (± 2·5) and distance that they lived from the hospital (± 2 miles). We recruited the healthy volunteers through the CFS patients and patient groups (healthy but sedentary friends or relatives who were not blood relatives), the participating hospitals and medical schools (employees or their friends or family) and people living or working locally. We used e‐mails, posters in waiting rooms, local advertising in bulletins, newsletters and newspapers to target potential healthy volunteers. Health status was assessed with a brief interview by the researcher, with standard questions, excluding all those with a current infection, chronic disease, taking medicines or psychiatric disorder as above.
Study design and ethics
This was a 16‐day study whereby participants (both patients and controls) attended the hospital on four occasions, with blood samples taken over a 9‐day period from days 7 to 16. A baseline assessment on day 1 comprised mainly obtaining written informed consent, self‐completion of questionnaires and the SCID 20. A ‘commuting challenge’ was completed on day 7, which included the participant having blood drawn at home after a night's sleep/rest, before they rose from their bed. Another blood sample was taken when they arrived at the hospital on the same day after commuting from their home to the hospital. An aerobic exercise challenge was completed on day 14. On this day blood was drawn before, immediately after and 3 h after exercise. On day 16 (2 days after the exercise) a final blood sample was taken at the hospital and follow‐up questionnaires were administered. Participants were studied 48 h after the exercise rather than 72 h afterwards, as in the pilot study 11, as our clinical impression suggested that CFS patients perceive most post‐exertional symptoms at this time.
Participants’ blood samples were drawn between 9 a.m. and 2 p.m., except for the sample taken while resting at home before commuting (day 7), which was often earlier, and a 3‐h post‐exercise sample (day 14), which was often later. Samples were obtained at a fixed time after arrival at the hospital (15 min) and in a fixed sequence (protein assays followed by RNA) from ante‐cubital venous puncture. All participants were required to have eaten breakfast prior to their arrival at each of their hospital appointments, but to have abstained from caffeinated drinks that morning. Menstrual phase was recorded in pre‐menopausal female subjects. As appointments spanned 16 days it was not possible to co‐ordinate testing during one (luteal) phase of the cycle.
Normal activities at home were resumed between appointments, with 7 days considered as giving sufficient time for participants to re‐establish baseline cytokine concentrations after each hospital visit; gene expression usually returns to normal 24 h after exercise in healthy people 21. Symptom exacerbations were rare a week after hospital travel in the pilot study 11.
To maximize participant retention without influencing the validity of the results we allowed some flexibility with appointment days. If a participant was unable to attend an appointment on the scheduled day, they were allowed to attend on the day before or the day after. However, the final appointment always took place 2 days after the exercise challenge, and the home visit always occurred on the same day as the commuting challenge.
This study was approved by the London Bridge Research Ethics committee (11/LO/1572). Written informed consent was obtained from all participants, who were paid travel expenses. Healthy volunteers were also paid £10 for each of their four hospital visits.
Questionnaires
On days 1 and 16 of the study, fatigue was measured with the 11‐item Chalder fatigue questionnaire 22, perceived physical disability was measured using the Short Form (SF‐36) physical function subscale 23, self‐rated mood was measured with the Hospital Anxiety and Depression Scale (HADS) 24 and sleep disturbance was measured using the Jenkins sleep scale 25. The International Physical Activity Questionnaire (IPAQ) was used on day 1 to measure physical activity participation during the past week 26. The McGill present pain intensity scale was used to measure pain intensity on day 1, before and after travelling on day 7, before and after exercise on day 14 and on day 16 27. Ad‐hoc self‐rated five‐item Likert scales were used to measure the effect of activity/exercise on delayed fatigue, pain and malaise (unwell) at the same times. Response options ranged from ‘strongly disagree’ to ‘neither agree nor disagree’ to ‘strongly agree’. Fear of exercise was determined on day 14 using the Tampa scale for kinesiophobia for fatigue 28, with healthy volunteers being asked to recall the last time they felt extreme tiredness that was not related to a medical condition, being pregnant or dehydration.
Exercise challenge
The aerobic exercise challenge used a friction‐loaded cycle ergometer (Monark 808, Vansbro, Sweden). The cycle ergometer was chosen in preference to a treadmill because it requires limited familiarization, was used in our pilot study and is generally perceived by participants as less distressing. All subjects completed a 5‐min familiarization period of unloaded cycling at a cadence of 60 rev/min−1. After the familiarization period, the subjects fulfilled a submaximal exercise protocol. We chose this protocol because in our pilot study we found no statistically significant differences in either subjective reactions or immune variables between the 70% submaximal test and the 100% maximal test 11. The workload was increased by 30 Watts every 3 min until a heart rate (HR) equal to 70% of age predicted maximum HR (192–0·007 × age in years2) was achieved 29 to within 10 beats per min (bpm). After this point, the participants continued to exercise at this workload for 20 min or until volitional exhaustion. Volitional exhaustion was considered to have occurred if the subject was no longer able to maintain cadence within 10 rev/min−1 of the required 60 rev/min−1, in spite of encouragement.
During the exercise challenge participants were asked to breathe through a mouthpiece connected to a system of open circuit spirometry, with a nose‐clip preventing air escaping. Expired gases were analysed breath‐by‐breath throughout the exercise by a cardiorespiratory analyser (CPX/D, Medical Graphics Inc., St Paul, MN, USA), calibrated according to the manufacturer's instructions prior to each test. The oxygen consumption (V̇O2 ml/kg/min−1) was averaged every 30 s, with peak V̇O2 determined as the highest V̇O2 value obtained. HR was also recorded every 5 s using a HR monitor (Polar Electro, Kempele, Finland). The highest 30‐s average HR (b/min−1) was deemed to be the peak HR. The exercise challenge duration (s) was also recorded. The original Borg scale of rating of perceived exertion (RPE) was self‐rated throughout the exercise test and immediately after the exercise was completed 30. The RPE score at 70% of peak HR was used as the split‐point for the analysis of perceived effort in hypothesis 2, as all participants reached this point.
Laboratory assays
At each bleed, we took 15 ml of blood in three tubes: 10 ml for serum proteins and 5 ml for RNA extraction. The samples were sent to the laboratory and would have arrived at the latest the following morning (if taken in the afternoon). One tube was centrifuged immediately for storage and the second was stored at ambient room temperature for 24 h and then centrifuged. All samples were then frozen and stored at −70 °C until analysed in three batches. The RNA tube was stored immediately as it was at −80°C, in line with the manufacturer's guidance. All laboratory work was completed by laboratory staff blind to group membership. Eleven cytokines (IL‐1β, IL‐2, IL‐4, IL‐5, IL‐6, IL‐8, IL‐10, IL‐12p70, TGF‐β, TNF and IFN‐γ) were measured on the basis that they would either be expected to be regulated abnormally in CFS after exertion and reflect a broad range of cell types, or that in some studies they had been shown previously to be elevated in CFS 9, 10. Serum protein concentrations of TGF‐β were analysed by enzyme‐linked immunosorbent assay (ELISA) methodology, according to the manufacturer's instructions (R&D Systems, Indianapolis, MN, USA). The TGF‐β samples were analysed in three batches by two laboratory technicians, with one technician analysing the first batch of samples in 2009 and the other technician analysing the second and third batches of the samples in 2011. As part of the standard operating procedure, the serum was centrifuged at 2500 rpm for 10 min. This is important, in that TGF‐β is released from platelets in greater quantities with faster centrifuging speeds. The remaining cytokines were analysed in three batches, separately from TGF‐β, and were determined using multiplex cytokine bead array as per the manufacturer's instructions (BenderMed Systems, Vienna, Austria). We measured all the cytokines at all time‐points and have reported values as picograms per millilitre (pg/ml). The lowest levels of quantification (LOQ), below which each cytokine in the assay were considered undetectable, are shown in Table 1, and these values are used where a value was undetectable. For quality assurance, in the first batch, where an analyte looked to be a possible outlier, we re‐analysed the sample and took the mean of the two assays. These values did not alter the results, so we did not repeat this with the remaining batches. We analysed RNA for five of the cytokines (IL‐1β, IL‐6, IL‐8, TGF‐ β and TNF), for which we report relative expression values.
Table 1.
List of lowest level of quantification (LOQ) for cytokine proteins
| Cytokine name | Lowest level of quantification (pg/ml) |
|---|---|
| IL‐1β | 4·2 |
| IL‐2 | 16·4 |
| IL‐4 | 20·8 |
| IL‐5 | 1·6 |
| IL‐6 | 1·2 |
| IL‐8 | 0·5 |
| IL‐10 | 1·9 |
| IL‐12p70 | 1·5 |
| TGF‐β | 10·0 |
| TNF | 3·2 |
| IFN‐γ | 1·6 |
IL = interleukin; TGF = transforming growth factor; IFN = interferon.
In our pilot study 11 we analysed platelet‐poor plasma when investigating the circulating levels of TGF‐β. TGF‐β are synthesized as precursor forms, which are biologically latent; the precursor form is cleaved by serine proteases, and following dissociation from the latency peptide becomes biologically active 31. As the latent pool is bioavailable following protease cleavage, TGF‐β assessment should be of active and latent acid‐activated subsets. The use of platelet‐poor plasma has been largely superseded by serum‐based assays, following an understanding that platelet‐derived (and usually non‐bioavailable) TGF‐β is sequestered in the matrix of the clot in serum 32. There is less experimental variation in the coagulation of serum in serum separator tubes than in producing platelet‐poor plasma 33. TGF‐β protein levels in serum and plasma are the same (when plasma is prepared optimally), so serum was employed as the preferred substrate in this study 32.
Sample quality control, cDNA synthesis, endogenous control selection and qPCR
RNA purity and concentration were measured by the NanoDrop 2000 spectrophotometer (Thermo Fisher Scientific Inc., Fremont, CA, USA), and RNA integrity was evaluated using the Agilent Bioanalyzer 2100 (Agilent Technologies, Santa Clara, CA, USA). Initial quality control showed significant DNA contamination of the RNA samples, characterized by masking of the 28‐s peak on the bioanalyser traces. Contaminating DNA was removed using an in‐solution DNase treatment, followed by concentration and clean‐up using Qiagen RNEasy MinElute columns (Qiagen, Valencia, CA, USA). RNA concentration and integrity were remeasured post‐DNAse treatment. cDNA was synthesized using 200 ng of total RNA in a reaction volume of 20 μl using the high‐capacity RNA‐to‐cDNA Master Mix kit (Life Technologies, Paisley, UK). The resulting cDNA was diluted 1 : 10 for use in subsequent quantitative polymerase chain reactions (qPCR).
The most appropriate endogenous control assays from a panel of six reference genes [18S, β2M, adenosine triphosphate (ATP)5β, eukaryotic initiation factors (EIF)A42, glyceraldehyde 3‐phosphate dehydrogenase (GAPDH) and ubiquitin C (UBC)] were selected after qPCR analysis of 10 representative RNA samples from the study using all six assays. The geNorm software package was used to assess the stability of the six genes in this sample set. The two most stable genes, ATP5β and GAPDH, were selected to run alongside the assays of interest in order to evaluate relative expression of the candidate genes 34. Primers and probes used for qPCR were available as inventoried Taqman® assays from Life Technologies (Table 2) and PCR reactions were carried out using the Taqman Universal PCR Master Mix (Life Technologies) in a 10 μl reaction volume. Thermal cycling was performed using the 7900HT Sequence Detection System (SDS) (Applied Biosystems), and PCR program 50°C for 2 min, 95°C for 10 min followed by 40 cycles of 95°C for 10 s and 60°C for 1 min. Each reaction included a no‐template control as a negative sample, and each cDNA sample was run in triplicate.
Table 2.
List of genes and gene expression IDs
| Gene name | Life technologies assay ID |
|---|---|
| 18S | Hs99999901_s1 |
| β2M | Hs99999907_m1 |
| ATP5β | Hs00969567_g1 |
| EIFA42 | Hs00756996_g1 |
| GAPDH | Hs99999905_m1 |
| UBC | Hs00824723_m1 |
| IL‐1β | Hs01555413_m1 |
| IL‐6 | Hs99999032_m1 |
| IL‐8 | Hs01553824_g1 |
| TNF | Hs00174128_m1 |
| TGF‐β1 | Hs00998133_m1 |
IL = interleukin; TGF = transforming growth factor; ATP = adenosine triphosphate; EIF = eukaryotic initiation factors; GAPDH = glyceraldehyde 3‐phosphate dehydrogenase; UBC = ubiquitin C.
Relative expression compared with GAPDH and ATP5B was generated using the 2–ΔΔCt method, using cycle threshold values (Ct) generated automatically by the 7900HT SDS software. Standard deviations and coefficients of variation were calculated for each set of triplicate data, and any outliers were removed.
Statistical analysis
Non‐detectable cytokine protein concentrations were approximated as the LOQ value (Table 1) for the purpose of the analyses. Testing the hypotheses required non‐parametric statistical testing using the Mann–Whitney U‐test, as the majority of data were not distributed normally. For hypothesis 1 we first compared absolute cytokine protein values, and their RNA at each time‐point between groups and then the difference between groups in any relative change (delta) in the values from baseline to post commuting/exercise. We also used the Wilcoxon signed‐rank test to determine any differences over time within groups.
For the across‐group analyses for responses to commuting in hypothesis 1, we compared post‐ to pre‐commuting cytokine protein concentrations and their RNA, and for the response to aerobic exercise we compared pre‐exercise to immediately post‐exercise, 3 h post‐exercise and 2 days post‐exercise. Where necessary, we adjusted the analyses for multiplicity using a Bonferroni adjustment.
Analysing the patients and controls separately, we tested hypothesis 2 using Mann–Whitney U‐tests to determine any differences in the relative change in cytokine protein and RNA levels between those reporting an RPE during the exercise test that was above or below the group median value. We compared pre‐exercise to immediately post‐exercise, 3 h post‐exercise and 2 days post‐exercise. We used the same analyses to determine any differences in cytokine protein and RNA levels for those reporting increased fatigue, pain and malaise after exercise and to determine any differences in TGF‐β protein and RNA levels for those reporting increased fatigue, pain and malaise after commuting compared to those who reported no change (hypothesis 3).
Analysing only the patients, we tested hypothesis 4 using Spearman's rank correlation coefficient to determine the relationships between cytokine protein level (when elevated significantly) and potential mediating factors of depression, anxiety, sleep disturbance and physical deconditioning (using time spent active during a week, time exercising during the exercise test and maximum power output achieved within the exercise test). We used the cytokine protein values 2 days after exercise, as our clinical impression suggested that CFS patients perceive most post‐exertional symptoms at this time. As a post‐hoc analysis we examined the distribution of TGF‐β protein in the cases and found it to be bimodal in its distribution.
As an exploratory analysis, we examined all additional 7 cytokine protein levels (IL‐1β, IL‐2, IL‐4, IL‐5, IL‐10, IL‐12p70 and IFN‐γ) using the Mann–Whitney U‐test. We first compared absolute cytokine protein values at each time‐point between groups. If there were sufficient detectable data we then looked at the difference in the relative change (delta) scores from pre‐ to post‐commuting and from pre‐exercise to immediately, 3 h and 2 days after the exercise between groups. As all cytokine proteins were measured six times, we corrected when necessary for multiple measures using a Bonferroni adjustment.
Confounders
To determine further whether the results were influenced by possible confounders, we adjusted significant findings for assay batch technician, gender, contraceptive pill use, whether taking tricyclic anti‐depressants (TCAs), smoking status, use of anti‐histamines, homeopathy, vitamins and minerals or other complementary or alternative medicines (CAMs), age, BMI, day of menstrual cycle at time of blood test, duration of CFS (> or < 3 years) 35, time spent walking in 1 week, time spent in bed in a week, perceived effort of the exercise test (RPE at 70% peak HR), fear of having blood taken, sleep disturbance 25 and levels of anxiety and depression 24. We only explored cytokines’ protein and RNA that showed significant differences between groups and we used cytokine values 2 days after the exercise challenge. We modelled significantly associated (P ≤ 0.10) confounders using appropriate regression models.
Power analyses
We used our pilot data to guide our calculation and took the significance level as 0·05 and the power of the study at 80%. In order to detect a difference in baseline TGF‐β protein between cases and controls of 0·35 ng/ml with an estimated standard deviation (s.d.) of 0·31 we needed 14 cases in each group. Due to non‐normality of the data we adjusted the sample size upwardly to 16 in each group 36. When we repeated the power calculations using the pilot data for TGF‐β protein 3 days after exercise and the mean (s.d.) difference in TGF‐β protein before and after travelling to hospital, the number of samples required was similar. We increased the sample sizes to 24 in each group in order to allow our hypothesis‐generating work. As there have been no previous studies of the associations between cytokine protein levels and dependent variables such as post‐exertional symptoms or activity, this part of the study was exploratory.
Results
A total of 24 patients (cases) and 21 controls were recruited into the study. Gender, age, smoking status, distance they lived from the hospital, amount of physical activity they undertook and time spent sitting were not significantly different throughout the groups (Table 3). There were no statistically significant differences in the use of anti‐depressants, anti‐histamines, the oral contraceptive pill and thyroxine, but cases were generally more likely to be taking vitamins, minerals or other complementary and alternative medicines (CAMs) and spent more time in bed each night (Table 3).
Table 3.
Demographics and clinical data [n (%) unless stated otherwise]
|
CFS n = 24 |
Control n = 21 |
P‐value | |
|---|---|---|---|
| Age (years) * | 40·3 (12·2) | 39·3 (14·1) | 0·81 |
| Gender (female) | 15 (63%) | 16 (76%) | 0·32 |
| BMI | 23·2 (4·5) | 25·5 (4·4) | 0·08 |
| Distance from hospital (miles) † | 6·9 (3·8, 11·0) | 7·8 (6·0, 11·7) | 0·26 |
| Taking anti‐depressants (SSRIs or TCAs) | 7 (29%) | 2 (10%) | 0·14 |
| Taking anti‐histamines | 3 (13%) | 1 (5%) | 0·61 |
| Taking thyroxine | 1 (4%) | 2 (10%) | 0·59 |
| Taking the oral contraceptive pill (females only) | 4 (27%) | 1 (6%) | 0·17 |
| Cigarette smoker | 4 (17%) | 4 (19%) | 1·000 |
| Taking vitamins, minerals and/or CAMs | 13 (54%) | 4 (20%) | 0·015 |
| Daily activity (min) † | 21·8 (7·3, 46·4) | 25·0 (7·9, 40·0) | 0·91 |
| Above recommendations for PA | 10 (42%) | 10 (44%) | 0·69 |
| Time spent sitting on usual day (min) † | 600 (458, 803) | 690 (495, 765) | 0·91 |
| Time spent in bed at night (min) † | 540 (480, 600) | 480 (420, 480) | 0·001 |
*Mean (standard deviation); †median (quartiles).
BMI = body mass index; CFS = chronic fatigue syndrome; SSRI = selective serotonin reuptake inhibitors; TCAs = tricyclic anti‐depressant; PA = physical activity; CAMs = complementary and alternative medicines.
The median (quartiles) duration of illness in the cases was 61 (37, 122) months. As expected, cases had significantly worse scores for fatigue, physical functioning, mood (anxiety and depression), pain and sleep measures than controls (Table 4).
Table 4.
Questionnaire scores at baseline [median (quartiles)]
|
CFS n = 24 |
Control n = 21 |
P‐value | |
|---|---|---|---|
| Duration of illness (months) | 60·5 (37, 122) | – | – |
| Chalder fatigue score | 27 (22, 30) | 11 (10, 11) | < 0·001 |
| SF‐36 PF | 60 (40, 75) | 100 (95, 100) | < 0·001 |
| Jenkins sleep | 9 (6, 12) | 4 (2, 5) | < 0·001 |
| HADS depression | 5 (4, 7) | 0 (0, 1·5) | < 0·001 |
| HADS D (excluding ‘slowed down’) | 3 (1, 5) | 0 (0, 1) | < 0·001 |
| HADS anxiety | 7·5 (5, 9) | 3 (1·5, 7) | 0·003 |
| McGill pain (discomforting or distressing)* | 18 (75) | 0 (0) | < 0·001 |
CFS = chronic fatigue syndrome; *n (%).
SF‐36 PF = SF‐36 physical functioning subscale; HADS = Hospital Anxiety and Depression Scale.
Median (quartiles) rating of perceived exertion (RPE) measured at 70% of predicted peak HR during the exercise challenge was significantly higher in cases [15 (14, 17)] compared to controls [13 (12·5, 13)] (P = 0·002) (Table 5). Furthermore, four times as many cases had an RPE > 14 (median for all subjects) at 70% of their predicted peak HR during the exercise test (16 versus 4; P = 0·001). Cases spent significantly less time cycling during the exercise test (P = 0·027), but showed a similar peak V·O2 (ml/kg/min−1) and peak HR (bpm).
Table 5.
Exercise test variables (medians and quartiles)
| CFS (n = 23) | Control (n = 20) | P‐value | |
|---|---|---|---|
| RPE score at HR 70% peak | 15 (14, 18) | 13 (12, 13) | P = 0·002 |
| RPE > median of 14 at HR 70% peak | 16 (70%) | 4 (20%) | P = 0·001 |
| Time on bike (s) | 960 (675, 1530) | 1530 (1080, 1620) | P = 0·027 |
| V·O2 peak (ml/kg/min−1) | 20·4 (16·8–22·2) | 19·5 (14·1–21·2) | P = 0·31 |
| Peak HR (b/min−1) | 143 (136–154) | 151 (145–159) | P = 0·09 |
| Max power (watts) | 90 (60–90) | 90 (60–90) | P = 0·62 |
| Competed test (yes) | 9 (39%) | 14 (70%) | P = 0·043 |
RPE = rating of perceived exertion; HR = heart rate; V·O2 = volume of oxygen; CFS = chronic fatigue syndrome.
Table 6 shows baseline levels of all cytokines protein and RNA measured at rest in bed, before rising, on day 7. There was no significant difference between groups in the number of detectable versus undetectable levels in any of the cytokines (in analysis of the protein or RNA results).
Hypothesis 1: Increases in cytokines in cases compared to controls
Table 6.
Baseline cytokine (protein and RNA) concentrations at rest, (at home in bed, on day 7) using lowest level of quantification (LOQ) for undetected values (medians and quartiles)
| CFS (n = 24) | Control (n = 21) | |||
|---|---|---|---|---|
| Cytokine pg/ml | Undetectable (n) | All CFS, imputing LOQ for undetectable values *† | Undetectable (n) | All controls, imputing LOQ for undetectable values † |
| IL‐1β | 20 | 4·2 (4·2, 4·2) | 18 | 4·2 (4·2, 4·2) |
| IL‐2 | 13 | 16·4 (16·4, 66·5) | 17 | 16·4 (16·4, 16·4) |
| IL‐4 | 17 | 20·8 (20·8, 23·2) | 15 | 20·8 (20·8, 20·8) |
| IL‐5 | 21 | 1·6 (1·6, 1·6) | 16 | 1·6 (1·6, 1·6) |
| IL‐6 | 24 | 1·2c | 18 | 1·2 (1·2, 1·2) |
| IL‐8 | 4 | 119·7 (38·1, 322·7) | 5 | 82·8 (0·8, 261·1) |
| IL‐10 | 15 | 1·9 (1·9, 8·8) | 15 | 1·9 (1·9, 1·9) |
| IL‐12p70 | 16 | 1·5 (1·5, 3·8) | 18 | 1·5 (1·5, 1·5) |
| TGF‐β (ng/ml) | 0 | 43·9 (19·2, 61·8) | 0 | 18·9 (16·1, 30·0) |
| TNF | 15 | 3·2 (3·2, 11·9) | 17 | 3·2 (3·2, 3·2) |
| IFN‐γ | 12 | 1·6 (1·6, 25·6) | 15 | 1·6 (1·6, 6·7) |
| Cytokine RNA (relative expression) | CFS (n = 24) | Control (n = 21) | ||
|---|---|---|---|---|
| IL‐1β RNA | 0·42 (0·29, 0·60) | 0·37 (0·32, 0·43) | ||
| IL‐6 RNA | 0·00002 (0, 0·00003) | 0·00001 (0, 0·00003) | ||
| IL‐8 RNA | 0·05 (0·03, 0·11) | 0·07 (0·04, 0·13) | ||
| TGF‐β RNA | 0·40 (0·35, 0·53) | 0·37 (0·32, 0·50) | ||
| TNF RNA | 0·41 (0·27, 0·51) | 0·36 (0·26, 0·45) | ||
*The only missing data were from one case of transforming growth factor (TGF)‐β; †These values included the imputed lowest LOQ score for a cytokine where a case had undetectable levels: this was repeated for all cytokine protein values. IL = interleukin; TNF = tumour necrosis factor; IFN = interferon; c = constant at 1·2 as all undetectable, therefore no quartiles available; CFS = chronic fatigue syndrome.
After a Bonferroni adjustment for multiple testing (×6), TGF‐β protein levels were elevated significantly in cases compared to controls at rest (median = 43·9 ng/ml versus 18·9 ng/ml; P = 0·003), after commuting (median = 56·9 ng/ml versus 21·4 ng/ml; P = 0·002) and 2 days post‐exercise (median = 49·1 ng/ml versus 21·9 ng/ml; P = 0·007) (Fig. 1). The changes in TGF‐β protein concentrations due to either commuting or exercise were not significantly different between the groups, although there was a significant increase pre‐ to post‐commuting in the cases (P = 0·003), but not pre‐ to post‐exercise.
Figure 1.
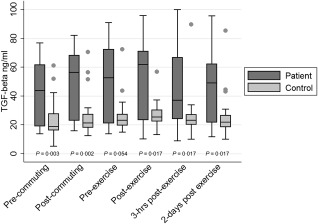
Serum protein concentrations of transforming growth factor (TGF)‐β in chronic fatigue syndrome (CFS) cases compared to controls (median scores in ng/ml); single dots represent control outliers.
After a Bonferroni adjustment for multiple‐testing, IL‐8 protein levels were not significantly higher in the cases compared to controls at any time‐point. Values for IL‐6 and TNF proteins were not significantly higher in the cases compared to controls at any time‐point.
No RNA values were significantly different between cases and controls at any time point from pre‐commuting to 2 days post‐exercise. Neither commuting nor exercise induced greater relative increases in concentrations of RNA of TGF‐β, TNF, IL‐8 or IL‐6 in cases compared to controls.
Hypothesis 2a: Perceived effort with exercise
Cases that reported an effort (RPE) during the exercise above the median did not demonstrate significantly greater increases in values for protein or RNA for TNF, IL‐8 or IL‐6 either immediately, 3 h or 2 days after the exercise compared to those reporting a lower effort with exercise.
Hypothesis 2b: Pain, malaise and fatigue with exercise
Significantly more cases, compared to controls, agreed or strongly agreed that they were more fatigued (19; 83% versus 1; 5%; P < 0·001), in more pain (13; 57% versus 1; 5%; P < 0·001) or felt more malaise (15; 65% versus 0; 0%; P < 0·001) 2 days after the exercise.
Cases who agreed that their fatigue, malaise or pain increased after the exercise test did not have significantly greater relative changes in TNF, IL‐8 or IL‐6 protein or RNA either immediately, 3 h or 2 days after the exercise, compared to those who disagreed.
Hypothesis 3: Post‐commuting symptoms related to TGF‐β
After commuting to the hospital, neither TGF‐β protein nor RNA were increased significantly in patients who agreed they felt more fatigue, malaise or pain after commuting, compared to those who disagreed. In the control group there were not enough data to analyse, because only two participants reported feeling more fatigued and none reported more malaise or pain after commuting.
Hypothesis 4: Potential mediators in cases
When analysing TGF‐β protein levels in cases alone, we noticed a clearly bimodal pattern to the data, with 12 (50%) cases having consistently high values and the other 12 having consistently low values (Fig. 2). The cut‐off we used was 37 ng/ml. The mean values for TGF‐β protein levels in the ‘high TGF‐β’ group were significantly higher than the values for the ‘low TGF‐β’ group (P < 0·001) when compared after exercise.
Figure 2.
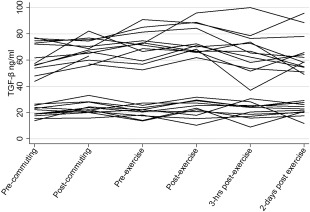
Transforming growth factor (TGF)‐β protein concentrations in cases at each time‐point (ng/ml).
In cases, concentrations of TGF‐β protein after the exercise challenge were not associated significantly with depressed or anxious mood, with physical deconditioning or sleep disturbance (data not shown).
Exploratory work
The exploratory work did not show any statistically significant differences in cytokine protein levels between cases and controls at any time‐point, and there were no significantly different relative changes in any of the exploratory cytokine levels between cases and controls after commuting or the exercise challenge.
Confounders in cases and controls
On deeper analysis of confounders, we examined TGF‐β values by both assay batches and by the two laboratory technicians who ran the assays. We show these data for one of the times where there was a significant difference between groups (Table 7). This shows that batch 1 TGF‐β concentrations (both for cases and controls) were significantly higher than the concentrations for batches 2 and 3. Comparing the results of the two technicians shows that technician 1 found significantly higher concentrations than technician 2 (patient versus patient P < 0·001).
Table 7.
TGF‐β Assay values (pg/ml) by laboratory technician (medians; quartiles)
| n | TFG‐β post‐commuting | P‐value | |
|---|---|---|---|
| Batch/operator 1 | |||
| Patient | 13 | 67 833 (63 066, 74 606) | 0·686 |
| Control | 2 | 63 505 (56 497, 70 512) | |
| Batch 2 | |||
| Patient | 11 | 22 216 (20 548, 26 273) | 0·766 |
| Control | 9 | 21 361 (18 683, 26 376) | |
| Batch 3 | |||
| Patient | 0 | – | – |
| Control | 10 | 19 894 (14 934, 27 377) | |
| Operator 2 | |||
| Patient | 11 | 22 216 (20 548, 26 273) | 0·471 |
| Control | 19 | 21 298 (17 361, 26 554) | |
Operator 1 versus operator 2: patient versus patient, P < 0·001; control versus control, P = 0·010. TGF = transforming growth factor.
Analysing cases and controls together, menstrual cycle phase, allowable medications and smoking status did not influence TGF‐β protein levels. However, taking the oral contraceptive pill (OCP) (P = 0·02), having a higher depression score (P = 0·03) and having a sample analysed by operator 1 (P < 0·001) predicted higher levels of TGF‐β protein 2 days after exercise. We undertook a multiple regression analysis which included laboratory technician, group, OCP and depression, plus BMI (P = 0·07). We used the stepwise method using transformed TGF‐β protein (log e) on day 16 and found that laboratory technician (1 versus 2) was the only significant predictor, which accounted for 79% of the variance in TGF‐β protein (adjusted R 2 = 0·79; P < 0·001).
Summary of findings
After correcting for multiple analyses, TGF‐β protein was the only cytokine protein or RNA that showed significantly different values between CFS and control groups. This was found to be a spurious finding, explained by assay variation between laboratory technicians. Neither protein nor RNA concentrations of any other cytokines were significantly higher in cases after commuting or an exercise test.
Discussion
In this study we investigated circulating cytokines and their RNA in patients with CFS at rest, after commuting and after an acute bout of physical activity. We found no evidence to support our hypothesis that these activities increased cytokine levels or their RNA, or that they were associated with post‐exertional symptoms and higher perceived effort of exercise that are commonly experienced by people with CFS. In contrast, our data showed a significant elevation in circulating TGF‐β at rest and afterwards during the 9 days of testing in patients compared to controls. Further analysis showed a clear bimodal distribution to TGF‐β, particularly in cases. This was found to be an artefact explained by a laboratory anomaly, with technician 1 finding consistently higher values for TGF‐β in both cases and controls compared to technician 2. As there were 13 (54%) cases and only two (10%) controls assayed by technician 1, it therefore appeared as though cases were more likely to have elevated concentrations when analysed by summarized group. Changes in TGF‐β protein levels due to commuting or exercise were similar in patients and controls.
Previous studies have been criticized for not accounting for confounding factors that can affect cytokine concentrations 9, 10. We measured a number of possible confounders and found that only laboratory variation influenced TGF‐β protein levels. We were unable to replicate finding a difference by duration of illness 35, although this study had a smaller number of patients. Contrary to some previous studies, including our own pilot study 11, we found no differences in concentrations of TNF between patients and controls. Our finding that any change in TGF‐β after exercise was not significantly different from any change in the control group replicates previous work 37.
We cannot know whether the same laboratory variation explains the previous case–control findings for TGF‐β, but case–control studies can start subject recruitment with cases in order to ascertain accurate matching of controls, so any interbatch assay variation might explain why it appeared that cases had different concentrations from controls. We were unable to ascertain the differences in laboratory processing that led to the differences between batches, but assume that the difference was due to using different centrifuge times, which might affect TGF‐β release from platelets leading to differences in TGF‐β concentrations. Great care needs to be taken in any case–control study, where matters such as centrifuge speed and timing can determine release of cytokines such as TGF‐β.
This study does not rule out a role for local release of cytokines in the central nervous system (CNS). There is a two‐way relationship between the immune system and the CNS 3, 4. Cytokines can cross the blood–brain barrier, particularly when the blood–brain barrier is modified by factors such as intercurrent infections or distress 38. Cytokines are released locally by glial cells in the CNS, and TGF‐β can cause central motor fatigue in animals 5, 39. Cytokines such as TGF‐β could thus affect the perception of pain and fatigue through both direct and indirect effects. There is some recent evidence to support neuroinflammation in CFS/ME 40. TGF‐β appears to have complex effects in the brain, but may promote a proinflammatory state and disturbance of blood–brain barrier function 41.
It is known that sufficient exercise can modulate cytokines at the level of gene expression to protein ligand release and receptor activation, with associated local and systemic consequences in the healthy population 16, 42. Although there is little evidence for this in patients with CFS 16, 43, it is possible that cytokines such as TGF‐β1 remain cell surface‐bound, so bioactive and peripheral levels may not be represented fully either at rest or after exercise. By investigating RNA in this study it allowed us to determine the presence of such cytokine gene expression. However, we did not find RNA concentrations elevated in cases compared to controls with any of the cytokines for which it was measured, and it did not change differently between groups with either commuting or exercise in RNA extracted from whole peripheral blood. Finding no statistically significant difference in TGF‐β RNA supports the spurious nature of the elevated TGF‐β protein levels found in this study.
This study had some limitations. This was a relatively small patient sample (with 24 cases), particularly for the number of cytokines we wished to investigate; it is likely that we were underpowered. Finding cases without psychiatric co‐morbidity, who were not on medicines that excluded them, was a challenge. There is good evidence that CFS is a heterogeneous group of conditions 44, but our sample of cases was too small to divide into subgroups, which a larger study has suggested may affect circulating cytokine concentrations 35. Although we tried to match on a number of criteria, including smoking status and those taking the oral contraceptive pill (both known to effect cytokine levels), it was difficult to recruit sedentary and yet healthy participants who were not taking any excluding medicines. This is why we were able to recruit only 21 controls, and they had a trend towards a higher BMI, were taking less vitamins and spent less time in bed, all of which could have confounded intergroup differences. In addition, because the protocol required a number of visits to the hospital, the CFS patients volunteering for this study would have been more physically able and those declining would probably have been the most disabled, leading to an increased risk of a type 2 error.
The strengths of this study include the reliability of the findings in having six measures of the same cytokines over 9 days and testing for confounding factors, such as taking the oral contraceptive. We also excluded participants with co‐morbid psychiatric disorders (a novel approach) that could have confounded cytokine levels, so our findings are more specific to CFS. We were able to analyse a good number of cytokines, including five in which more than one study had shown previous elevations, and others that had not been measured previously. We also suggest there is heuristic value in reporting this study, as an apparent bimodal distribution of a potential biomarker in CFS was found which, on a deeper analysis of confounders, was found to be spurious.
Implications for future research
A systematic review of the association between circulating cytokines and CFS showed that only TGF‐β was elevated in the majority of case–control studies 10: a finding we were unable to replicate. Another systematic review concluded that cytokine concentrations were not abnormal after exercise in CFS 9, a finding we replicated. We suggest that circulating levels of cytokines are unlikely to be important in the pathophysiology of CFS.
Conclusions
We replicated the finding of consistently higher circulating TGF‐β at rest in cases of CFS compared to healthy controls, but deeper analysis showed this to be a spurious finding, due to laboratory variation. Post‐exertional symptoms and perception of effort with exercise were not associated with an increase in circulating cytokine protein or RNA concentrations in patients with CFS. There have been many studies showing associations between various biomarkers and CFS, which have not been replicated; due caution should be taken before the next biomarker is reported.
Disclosure
P. D. W. is a member of the Independent Medical Experts Group, which advises the UK Ministry of Defence regarding its Armed Forces Compensation Scheme, and is a consultant adviser to a re‐insurance company. No other authors declare any conflicts of interest.
Acknowledgements
We thank the Barts Charity for funding this work. We would also like to thank Professor Anthony Pinching for co‐leading the grant application. P. D. W., L. V. C., M. B. and V. V. designed the study, which was run by L. V. C., P. D. W. and G. M. recruited patients from their clinics. C. M. and E. W. undertook RNA analyses. M. B. oversaw cytokine analyses. M. S., L. V. C. and N. T. analysed the study. All authors contributed to and approved the manuscript. We are particularly grateful for discussions with Megan Roerink regarding an earlier draft of this paper, and we are also grateful to our reviewers for their wise advice.
References
- 1. Reeves WC, Lloyd A, Vernon SD et al Identification of ambiguities in the 1994 chronic fatigue syndrome research case definition and recommendations for resolution. BMC Health Serv Res 2003; 3:25. [DOI] [PMC free article] [PubMed] [Google Scholar]
- 2. Prins JB, van der Meer JWM, Bleijenberg G. Review. Chronic fatigue syndrome. Lancet 2006; 367:346–55. [DOI] [PubMed] [Google Scholar]
- 3. Dantzer R. Cytokine‐induced sickness behavior: where do we stand? Brain Behav Immun 2001; 15:7–24. [DOI] [PubMed] [Google Scholar]
- 4. Vollmer‐Conna U, Fazou C, Cameron B et al Production of pro‐inflammatory cytokines correlates with the symptoms of acute sickness behaviour in humans. Psychol Med 2004; 34:1289–97. [DOI] [PubMed] [Google Scholar]
- 5. Inoue K, Yamazaki H, Manabe Y, Fukuda C, Hanai K, Fushiki T. Transforming growth factor‐beta activated during exercise in brain depresses spontaneous motor activity of animals: relevance to central fatigue. Brain Res 1999; 846:145–53. [DOI] [PubMed] [Google Scholar]
- 6. Ur E, White PD, Grossman A. Hypothesis: cytokines may be activated to cause depressive illness and chronic fatigue syndrome. Eur Arch Psychiatry Clin Neurosci 1992; 241:317–22. [DOI] [PubMed] [Google Scholar]
- 7. Medical Research Council. CFS Research Advisory Group . CFS Research Strategy; 2003. Available at: http://www.mrc.ac.uk/pdf-cfs_me_research_strategy.pdf. Accessed 17 August 2017.
- 8. Lyall M, Peakman M, Wessely S. A systematic review and critical evaluation of the immunology of chronic fatigue syndrome. J Psychosom Res 2003; 55:79–90. [DOI] [PubMed] [Google Scholar]
- 9. Nijs J, Nees A, Paul L et al Altered immune response to exercise in patients with chronic fatigue syndrome/myalgic encephalomyelitis: a systematic literature review. Exerc Immunol Rev 2014; 20:94–116. [PubMed] [Google Scholar]
- 10. Blundell S, Ray KK, Buckland M, White PD. Chronic fatigue syndrome and circulating cytokines: a systematic review. Brain Behav Immun 2015; 50:186–95. [DOI] [PubMed] [Google Scholar]
- 11. White PD, Nye KE, Pinching AJ et al Immunological changes after both exercise and activity in chronic fatigue syndrome: a pilot study. J Chronic Fatigue Syndr 2004; 12:51–66. [Google Scholar]
- 12. Light AR, White AT, Hughen RW, Light KC. Moderate exercise increases expression for sensory, adrenergic, and immune genes in chronic fatigue syndrome patients but not in normal subjects. J Pain 2009; 10:1099–112. [DOI] [PMC free article] [PubMed] [Google Scholar]
- 13. Meyer JD, Light AR, Shukla SK et al Post‐exertion malaise in chronic fatigue syndrome: symptoms and gene expression. Fatigue Biomed Health Behav 2013; 1:190–209. [Google Scholar]
- 14. Pedersen BK. Exercise and cytokines. Immunol Cell Biol 2000; 78:532–5. [DOI] [PubMed] [Google Scholar]
- 15. Moldoveanu AI, Shephard RJ, Shek PN. The cytokine response to physical activity and training. Sports Med 2001; 31:115–44. [DOI] [PMC free article] [PubMed] [Google Scholar]
- 16. Moldoveanu AI, Shephard RJ, Shek PN. Exercise elevates plasma levels but not gene expression of IL‐1β, IL‐6, and TNF‐α in blood mononuclear cells. J Appl Physiol 2000; 89:1499–504. [DOI] [PubMed] [Google Scholar]
- 17. Dugue B, Leppanen E, Grasbeck R. Preanalytical factors and the measurement of cytokines in human subjects. Int J Clin Lab Res 1996; 26:99–105. [DOI] [PubMed] [Google Scholar]
- 18. Wadhwa M, Thorpe R. Cytokine immunoassays: recommendations for standardisation, calibration and validation. J Immunol Methods 1998; 219:1–5. [DOI] [PubMed] [Google Scholar]
- 19. Anisman H, Ravindran AV, Griffiths J, Merali Z. Endocrine and cytokine correlates of major depression and dysthymia with typical and atypical features. Mol Psychiatry 1999; 4:182–8. [DOI] [PubMed] [Google Scholar]
- 20. First MB, Spitzer RL, Gibbon M et al Structured clinical interview for DSM‐IV axis I disorders: research version (SCID‐I/P). New York: Biometrics Research, 1996. [Google Scholar]
- 21. Pilegaard H, Ordway GA, Saltin B, Neufer PD. Transcriptional regulation of gene expression in human skeletal muscle during recovery from exercise. Am J Physiol Endocrinol Metab 2000; 279:E806–14. [DOI] [PubMed] [Google Scholar]
- 22. Chalder T, Berelowitz G, Pawlikowska T et al Development of a fatigue scale. J Psychosom Res 1993; 37:147–53. [DOI] [PubMed] [Google Scholar]
- 23. Ware JE, Sherbourne CD. The MOS 36‐item short form health survey (SF36): conceptual framework and item selection. Med Care 1992; 30:473–83. [PubMed] [Google Scholar]
- 24. Zigmond A, Snaith R. The hospital anxiety and depression scale. Act Psychiatr Scand 1983; 67:361–70. [DOI] [PubMed] [Google Scholar]
- 25. Jenkins CD, Stanton B‐A, Niemcryk SJ, Rose RM. A scale for the estimation of sleep problems in clinical research. J Clin Epidemiol 1988; 41:313–21. [DOI] [PubMed] [Google Scholar]
- 26. Craig CL, Marshall AL, Sjostrom M et al International Physical Activity Questionnaire: 12‐country reliability and validity. Med Sci Sports Exerc 2003; 35:1381–95. [DOI] [PubMed] [Google Scholar]
- 27. Melzack R. The McGill pain questionnaire: major properties and scoring methods. Pain 1975; 1:277–99. [DOI] [PubMed] [Google Scholar]
- 28. Silver A, Haeney M, Vijayadurai P, Wilks D, Pattrick M, Main CJ. The role of fear of physical movement and activity in chronic fatigue syndrome. J Psychosom Res 2002; 52:485–93. [DOI] [PubMed] [Google Scholar]
- 29. Gellish RL, Goslin BR, Olson RE, McDonald A, Russi GD, Moudgil VK. Longitudinal modelling of the relationship between age and maximal heart rate. Med Sci Sports Exerc 2007; 39:822–9. [DOI] [PubMed] [Google Scholar]
- 30. Borg G. Perceived exertion as an indicator of somatic stress. Scand J Rehab Med 1970; 2:92–8. [PubMed] [Google Scholar]
- 31. Kanzaki T, Olofsson A, Moren A et al TGF‐beta I binding protein: a component of the large latent complex of TGF‐β1 with multiple repeat sequences. Cell 1990; 61:1051–61. [DOI] [PubMed] [Google Scholar]
- 32. Grainger DJ, Mosedale DE, Metcalfe JC, Weissberg PL, Kemp PR. Active and acid‐activatable TGF‐β in human sera, platelets and plasma. Clinica Chim Acta 1995; 235:11–31. [DOI] [PubMed] [Google Scholar]
- 33. Cheng HH, Yi HS, Kim Y et al Plasma Processing conditions substantially influence microRNA biomarker levels. PLOS ONE 2013; 8:e64795. [DOI] [PMC free article] [PubMed] [Google Scholar]
- 34. Vandesompele J, De Preter K, Pattyn F et al Accurate normalization of real‐time quantitative RT‐PCR data by geometric averaging of multiple internal control genes. Genome Biol 2002; 18:0034. [DOI] [PMC free article] [PubMed] [Google Scholar]
- 35. Hornig M, Montoya JG, Klimas NG et al Distinct plasma immune signatures in ME/CFS are present early in the course of illness. Sci Adv 2015; 1:e1400121. [DOI] [PMC free article] [PubMed] [Google Scholar]
- 36. Lehmann EL, D’Abrera HJM. Nonparametrics: Statistical Methods Based on Ranks, rev. ed. Englewood Cliffs, NJ: Prentice‐Hall, pp. 292, 300, and 323, 1998. https://www.amazon.com/exec/obidos/ASIN/013997735X/ref=nosim/ericstreasuretro
- 37. Peterson PK, Sirr SA, Grammith FC et al Effects of mild exercise on cytokines and cerebral blood flow in chronic fatigue syndrome patients. Clin Diagn Lab Immunol 1994; 1:222–6. [DOI] [PMC free article] [PubMed] [Google Scholar]
- 38. Bested AC, Saunders PR, Logan AC. Chronic fatigue syndrome: neurological findings may be related to blood‐brain barrier permeability. Med Hypotheses 2001; 57:231–7. [DOI] [PubMed] [Google Scholar]
- 39. Manabe Y, Yamazaki H, Fukuda C, Inoue K, Fusiki T, Hanai K. Determination of TGF‐β‐like activity in the rat cerebrospinal fluid after exhaustive exercise using anti‐TGF‐β IgG and the Hydra bioassay. Biomed Res 2000; 21:191–6. [Google Scholar]
- 40. Nakatomi Y, Mizuno K, Ishii A et al Neuroinflammation in patients with chronic fatigue syndrome/myalgic encephalomyelitis: an 11C‐(R)‐PK11195 PET study. J Nucl Med 2014; 55:945–50. [DOI] [PubMed] [Google Scholar]
- 41. Rustenhoven J, Aalderink M, Scotter EL et al TGF‐beta1 regulates human brain pericyte inflammatory processes in neurovasculature function. J Neuroinflammation 2016; 13:37. [DOI] [PMC free article] [PubMed] [Google Scholar]
- 42. Shephard RJ. Cytokine response to physical activity, with particular reference to IL‐6: sources, actions and clinical implications. Crit Rev Immunol 2002; 22:165–82. [PubMed] [Google Scholar]
- 43. Natelson BH, Haghighi MH, Ponzio NM. Evidence for the presence of immune dysfunction in chronic fatigue syndrome. Clin Diagn Lab Immunol 2002; 9:747–52. [DOI] [PMC free article] [PubMed] [Google Scholar]
- 44. Williams TE, Chalder T, Sharpe M, White PD. Heterogeneity in chronic fatigue syndrome – empirically defined subgroups from the PACE trial. Psychol Med 2017; 47:1454–65. [DOI] [PubMed] [Google Scholar]