Abstract
Background
Custom HIV staging assays, including the Sedia™ HIV-1 Limiting Antigen Avidity EIA (LAg) and avidity modifications of the Ortho VITROS® anti-HIV-1+2 and Abbott ARCHITECT HIV Ag/Ab Combo assays, are used to identify ‘recent’ infections in clinical settings and for cross-sectional HIV incidence estimation. However, the high dynamic range of chemiluminescent platforms allows differentiating recent and longstanding infection on signal intensity, and this raises the prospect of using unmodified diagnostic assays for infection timing and surveillance applications.
Methods
We tested a panel of 2,500 well-characterised specimens with estimable duration of HIV infection with the three assays and the unmodified ARCHITECT. Regression models were used to estimate mean durations of recent infection (MDRI), context-specific false-recent rates (FRR) and correlation between diagnostic signal intensity and LAg measurements. Hypothetical epidemiological scenarios were constructed to evaluate utility in surveillance applications.
Results
Over a range of MDRIs (reflecting recency discrimination thresholds), a diluted ARCHITECT-based RITA produced lower FRRs than the VITROS platform (FRR ≈ 0.5% and 1.5% respectively at MDRI ≈ 200 days) and the unmodified diagnostic ARCHITECT produces incidence estimates with comparable precision to LAg (RSE ≈ 17.5% and 15% respectively at MDRI ≈ 200 days). ARCHITECT S/CO measurements were highly correlated with LAg ODn measurements (r = 0.80) and values below 200 are strongly predictive of LAg recency and duration of infection less than one year.
Conclusions
Low quantitative measurements from the unmodified ARCHITECT obviate the need for additional recency testing and its use is feasible in clinical staging and incidence surveillance applications.
Keywords: infection timing, infection staging, incidence, recent infection, diagnostic assays, staging assays
Introduction
Laboratory assays for the detection, staging and management of HIV have been a significant priority over the course of the HIV/AIDS epidemic. In particular, the idea of using a test for ‘recent’ HIV infection to generate incidence estimates from cross-sectional surveys has attracted substantial attention and investment (1–11). A variety of candidate immunological and virological markers have been investigated, with most early applications focused on the expansion of the dynamic range of serological assays used to identify recent infection (i.e. increasing the length of time an incident case could still be classified as recently infected). In conventional plate reader-based ELISA platforms, high diagnostic sensitivity requires a rapid rise of signal strength with increasing antibody titre and avidity, so that patients’ readings rapidly traverse the range of quantifiable detection as the infection progresses. Customisations to expand the dynamic range and facilitate the introduction of a reproducible recent/non-recent threshold have variously taken the form of dilution, incubation time reduction, or antibody-antigen binding degradation (sometimes in combination) to produce markers indicative of antibody titre, HIV-specific proportion, or avidity.
Individuals who are virally suppressed (either through effective endogenous control or by antiretroviral treatment) tend to undergo at least partial seroreversion, leading to ‘false’ recent classifications under protocols designed for cross-sectional incidence estimation. Inspired by the hypothesis that antibody quality reverts less than antibody titre or proportion, the notion of a ‘two-well avidity modification’ has gained some traction. In this case a specimen is subjected to two runs on the diagnostic platform under different conditions: an ‘untreated’ reaction well (i.e. close to standard conditions for diagnostic use) and a ‘treated’ reaction well, in which conditions are altered to restrict antibody-antigen binding. The ratio of the signals generated by ‘treated’ vs. ‘untreated’ reaction wells – usually named an ‘avidity index’ – is interpreted as a measure of antibody binding capacity. Avidity typically increases over time after infectious exposure as the antibody response matures.
Two-well avidity modifications of two modern chemiluminescent platforms with high intrinsic dynamic range, the Ortho VITROS® anti-HIV-1+2 Assay (VITROS) (12) and the Abbott ARCHITECT HIV Ag/Ab Combo Assay (ARCHITECT) (13), have been proposed. These employ ‘chaotropic’ agents – i.e. agents that interfere with antibody-antigen binding – in the ‘treated’ reaction well to inhibit the formation of antibody-antigen complexes or disrupt complexes after formation. While not relying on specimen dilution (which is an alternative, non-avidity approach to dynamic range expansion), the use of an additional reagent in the modified run requires some dilution of samples in the ‘untreated’ run to match input volumes and ensure that the resulting signals are comparable.
Performance of the VITROS and ARCHITECT avidity assays for use in cross-sectional incidence estimation has been investigated by the CEPHIA collaboration, as part of an independent evaluation of leading candidate HIV incidence assays (9,10). During application of the proposed procedures for recency ascertainment to the CEPHIA ‘evaluation panel’, these two-well avidity protocols additionally produced results from diluted (1:10) but otherwise unmodified runs. These previously unreported data, and a new evaluation of the unmodified Abbott ARCHITECT HIV Ag/Ab Combo Assay (i.e., applied according to the manufacturer’s Instructions for Use [IFU] in diagnostic applications) form the subject of this work. We additionally report, for comparison, results from the Sedia™ HIV-1 Limiting Antigen Avidity (LAg) assay on the same specimen panel.
Until recently, no practical recent/non-recent infection classification scheme has been constructed using only markers available through unmodified diagnostic platforms and algorithms. This is a noteworthy opportunity, given that the Western blot, at times widely used as a ‘confirmatory’ diagnostic test, provides a compelling picture of immune response evolution (14). In many settings, it has been noted that ‘indeterminate’ Western blot patterns tend to evolve into unambiguously HIV-positive patterns within a few weeks. However, lack of consistent production and quantitation of Western blot band intensity has been one key limitation preventing use of the Western blot as a staging assay. Similarly, the cost and complexity of using customised recency assays in disease surveillance has limited adoption (15). A recent analysis of the Bio-Rad Geenius™ HIV1/2 supplemental assay (16), though using a platform available in diagnostic settings, requires a research-use-only modification of the cartridge reader software to facilitate the extraction of quantitative band intensities, which form the basis of the recency classification. The potential to interpret data routinely available from diagnostic assays to classify infections as recent or non-recent may improve the feasibility of incidence surveillance in many settings.
In clinical settings, the only well-known early infection staging scheme is ‘Fiebig staging’ (14), based on unmodified commercial assays, but using only the qualitative results. Fiebig stages are based on discordance between tests of varying diagnostic sensitivity, specifically, the average time from infectious exposure to test conversion. Given progress in the reduction of diagnostic delays (window periods), such a staging system has utility only in the very early stages of infection, and inferences about the duration of infection can in practice only be made when specific diagnostic platforms are employed. Many of these assays are no longer commercially available.
We report the first evidence that certain unmodified 4th generation chemiluminescent diagnostic assays can provide meaningful infection staging information applicable to incidence surveillance and for clinical interpretation. The latter application is already being practised in several countries where custom recency staging assays (such as LAg) are applied to specimens from newly diagnosed persons. This involves additional laboratory resources and longer turnaround times, as specimens are usually reflexed to a small number of centralised specialist laboratories for recency ascertainment.
Methods
The CEPHIA Specimen Repository and Evaluation Panel
The CEPHIA specimen repository houses over 25,000 HIV-1-positive specimens. Specimen details and background clinical data (obtained from contributing clinical cohort studies) are stored in harmonised form in a research database. As previously described (9,10,16), the CEPHIA Evaluation Panel consists of 2,500 plasma specimens, selected to allow a full independent assessment of promising tests for recent infection, including estimation of test properties relevant to HIV incidence estimation. The specimens were obtained from 932 unique subjects (1-13 specimens per subject). Most specimens were obtained from subjects infected with subtype B (53% of specimens), C (27%), A1 (12%) and D (6%). The panel further contained multiple blinded aliquots of three control specimens (25 replicates of each), with antibody reactivity characteristic of recent, intermediate and longstanding infection, to allow evaluation of the reproducibility of assay results.
The majority (67%) of subjects contributing specimens to the panel had sufficient clinical data to produce Estimated Dates of Detectable Infection (EDDIs), which are obtained by systematically interpreting diverse diagnostic testing histories by means of ‘diagnostic delays’, i.e. the average time elapsed from exposure to a first positive result on the assay in question (11). The distribution of times since EDDI and subtype composition of specimens in the evaluation panel are shown in Figure 1.
Figure 1. Distribution of times since estimated date of detectable infection in the CEPHIA Evaluation Panel.
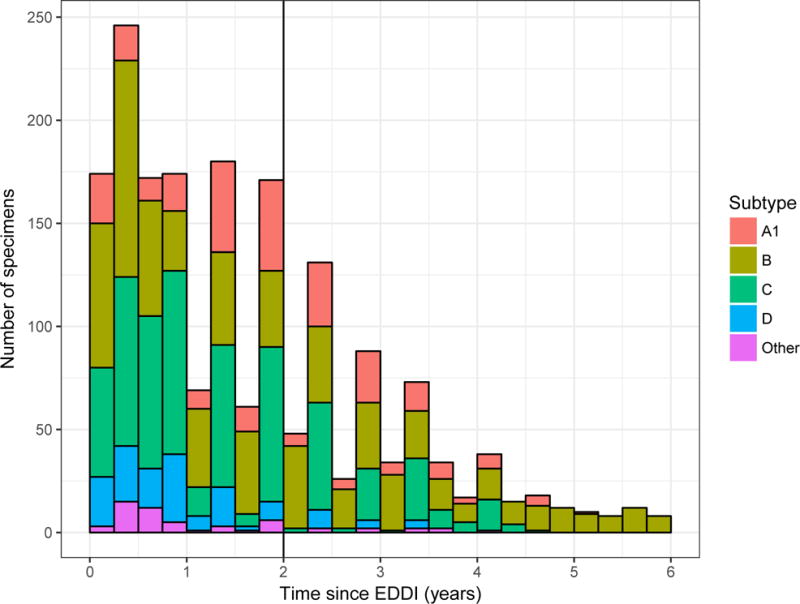
Number of specimens in the CEPHIA Evaluation Panel by HIV subtype and time since estimated date of detectable infection (EDDI), in 3-month intervals.
The UCSF Human Research Protection Program & IRB (formerly CHR, #10-02365) approved study procedures.
Laboratory procedures
For the present analysis, data for the VITROS Avidity, ARCHITECT Avidity and LAg assays were generated as previously described (9,10), with the exception that the data from the CEPHIA evaluations of the VITROS Avidity and the ARCHITECT Avidity assays were reanalysed using only the ‘untreated’ (diluted) run (i.e. the sample diluted 1:10 with PBS). Additional testing of the CEPHIA evaluation panel was undertaken according to the manufacturer’s IFU for the Abbott ARCHITECT HIV Ag/Ab Combo assay. Data for the LAg assay is included for comparison.
Specimens were independently tested in CEPHIA laboratories – Blood Systems Research Institute, San Francisco, CA (VITROS Avidity) and National Infection Service, Public Health England, London, UK (ARCHITECT Avidity, unmodified ARCHITECT, LAg) – by technicians blinded to specimen background data.
The procedures used in the testing of the two avidity modifications and LAg have been previously described (9). The unmodified ARCHITECT HIV Ag/Ab Combo assay is a two-step immunoassay which detects both the presence of HIV p24 antigen and antibodies to HIV-1 and HIV-2 in human serum and plasma. For this evaluation, we investigated anti-HIV-1 antibody detection, and recommend that recency interpretations only be applied to confirmed HIV-1-positive specimens. All specimens in the CEPHIA evaluation panel are from HIV-1-infected individuals and confirmed antibody-positive. In the first step, the sample, assay diluent, and paramagnetic microparticles are combined. HIV p24 antigen and anti-HIV-1/anti-HIV-2 antibodies present in the sample bind to the HIV p24 monoclonal (mouse) antibody and HIV-1/HIV-2 antigen-coated microparticles. After washing, the HIV p24 antigen and anti-HIV-1/HIV-2 antibodies bind to the acridinium-labelled conjugates (HIV-1/HIV-2 antigens, synthetic peptides, and HIV p24 antibody). Following another wash cycle, pre-trigger and trigger solutions are added to the reaction mixture. The resulting chemiluminescent reaction is measured as relative light units (RLUs). The assay incorporates a number of controls and calibrator specimens, which are used to define a per-cycle ‘cut-off’ value, and results are then reported as a signal-to-cut-off ratio (S/CO). Regular maintenance of the ARCHITECT platform is required to ensure accuracy of results. For the purpose of this evaluation specimens were tested and analysed in singleton but for diagnostic purposes the manufacturer suggests specimens be tested in duplicate.
Statistical Analysis
For use in incidence surveillance, the performance of recent infection tests is summarised by two parameters, the Mean Duration of Recent Infection (MDRI) and the False-Recent Rate (FRR).
MDRI denotes the average amount of time that individuals spend exhibiting the ‘recent’ biomarker, while infected for less than some cut-off time (denoted T, 2 years in the present work). This captures the defining biological aspects of the recency test, and should be more than approximately half a year to yield informative incidence estimates from feasibly-sized surveys, even in high incidence settings. As described previously (3, 4), MDRI was estimated by fitting a linear binomial regression model for the probability of testing recent as a function of estimated time since infection, , using a logit link function and a cubic polynomial in time (since estimated date of detectable infection). The function was fit to data points up to 800 days post-infection. The MDRI was then obtained by integrating the function from 0 to T. Confidence intervals were obtained by resampling subjects in 10,000 bootstrap iterations.1
The FRR is the proportion of those individuals who are infected for longer than the cut-off time T, but who nevertheless produce a recent result on the test. For surveillance, values of FRR above approximately 1-2% are highly vulnerable to bias and artefacts during the incidence estimation procedure.
FRR is inevitably context-dependent. In order to estimate FRR, three hypothetical epidemiological scenarios were constructed and the FRR in untreated and treated individuals estimated and weighted according to the treatment coverage specified in each scenario. The primary epidemiological scenario used in the present study (scenario A) can be summarised as: 1) HIV prevalence of 30%; 2) incidence of 1.5 cases per 100 person-years (PY); 3) treatment coverage (defined as proportion of HIV-infected individuals who are on ART, all of whom are assumed to be virally suppressed) of 80% and 4) predominant subtypes distributed as in the Evaluation Panel. This scenario is one in which precision would be expected to be fairly good on all assays. To evaluate sensitivity of performance metrics to epidemiological context, two further scenarios were specified, designed to resemble a medium-prevalence generalised epidemic and a concentrated epidemic, respectively. Scenario B is summarised as 1) HIV prevalence of 10%, 2) incidence of 0.5 cases/100 PY, 3) treatment coverage of 60%, and d) predominantly subtype C infections. Scenario C is summarised as 1) HIV prevalence of 15%, 2) incidence of 1.5 cases/100 PY, 3) treatment coverage of 90%, and d) predominantly subtype B infections.
To estimate the FRR in untreated individuals, the function was fit using data from all times post-infection, and weighted according to the probability density function for times since infection in the untreated population. The distribution of times since infection was parameterised as a Weibull survival function, with the shape and scale parameters chosen to produce the desired treatment coverage in a population with the specified incidence and prevalence, and normalised to the specified recent incidence. The FRR in treated subjects, is simply the binomially estimated probability that treated subjects infected for longer than T would produce a recent result.2
where c is the treatment coverage, and For surveillance applications, utility is defined in terms of the standard error on the incidence estimator (17). To assess this, MDRI and context-specific FRR were calculated for a range of ‘recent/non-recent’ discrimination thresholds, and the variance on the incidence estimator was calculated for the specified epidemiological contexts, assuming demonstrative simple random samples of 10,000 individuals in scenarios A and B, and 3000 in scenario C. A key difference between a previously constructed scenario (10) and the present analysis is in the HIV-positive case definition, which previously required a fully-developed Western blot, and in the present case is expanded to all individuals who test positive on a qualitative nucleic acid (NAT) assay (threshold of detection 30 HIV-RNA copies/mL). This has ramifications for MDRI, which was estimated using EDDIs in which detectable infection is defined as positivity on a hypothetical viral load assay with a detection threshold of 1 copy/mL. Reported MDRI estimates must be interpreted against this reference standard, and for the purposes of incidence estimation, MDRI was adjusted to account for the sensitivity of the HIV screening algorithm (i.e., 4.8 days shorter than reported MDRI to account for the diagnostic delay of the NAT screening assay).
MDRI, FRR and the variance of the incidence estimate in the hypothetical scenarios were computed using the R package inctools (18).
Linear regression was used to assess the correlation between ARCHITECT S/CO readings and LAg ODn readings on the untreated subset of the evaluation panel. Binomial logistic regression models were employed to assess the predictive value of ARCHITECT S/CO values for 1) duration of infection ≤ one year, and 2) LAg ODn values ≤ 1.5 (the conventional recency discrimination threshold). The logistic regression models had the following form:
with the probability of recency (duration of infection ≤ 1 year or LAg ≤ 1.5), the logit link function and X the ARCHITECT S/CO measurements.
Results
Figure 2 shows, in four panels customised to the apparent dynamic range of each assay, the MDRI (y-axis) as a function of recent/non-recent discrimination threshold (x-axis, range chosen to yield MDRI values from approximately 50 to approximately 400 days). A viral load threshold of 100 HIV RNA copies/mL is applied in all cases. MDRI is tuneable by adjusting the recent/non-recent discrimination threshold, but FRR increases with increasing MDRI.
Figure 2. Mean Duration of Recent Infection by recency discrimination threshold.
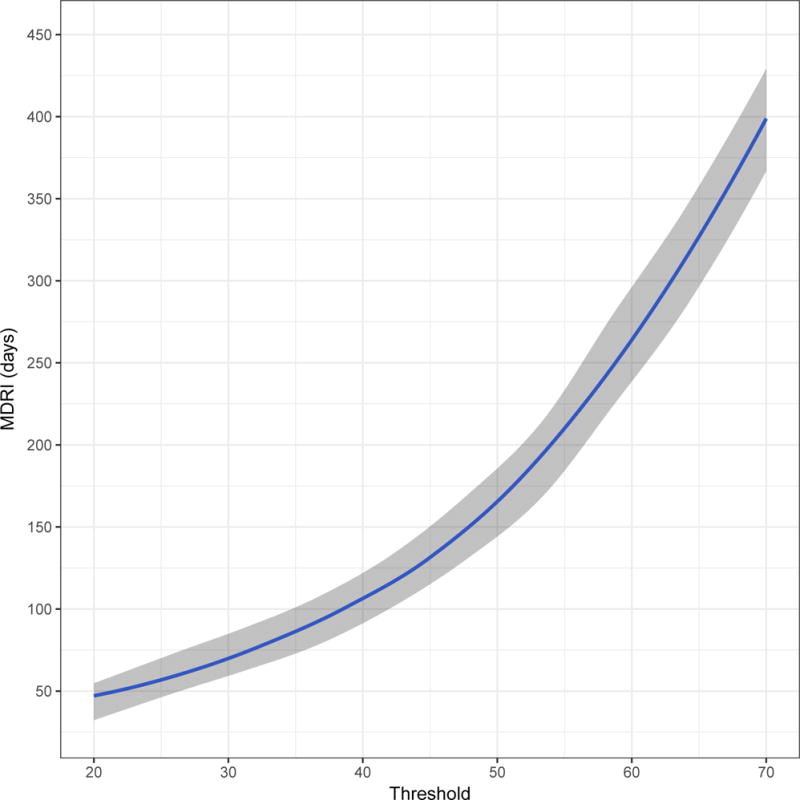
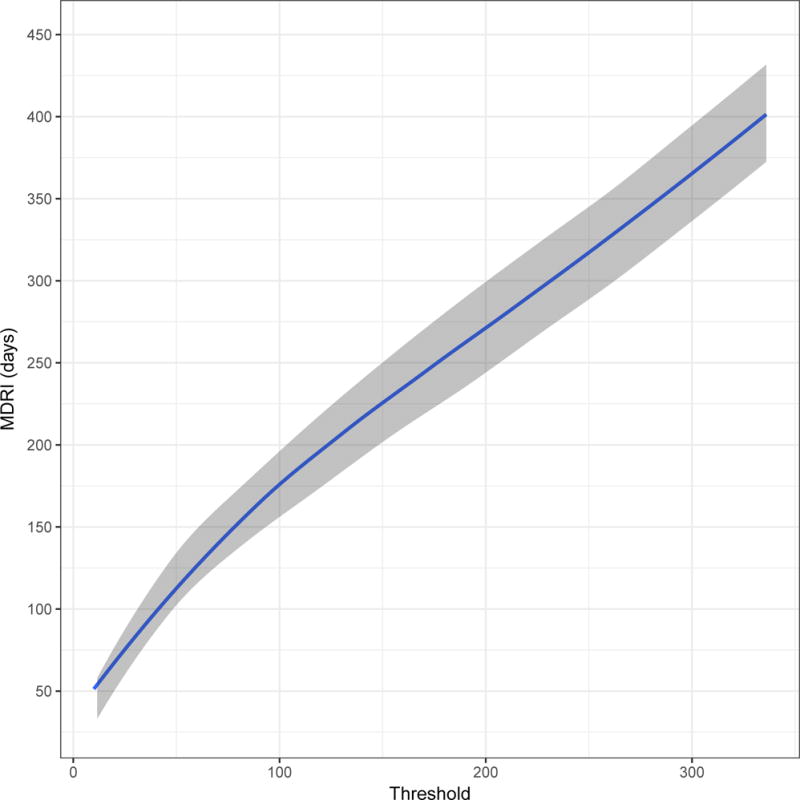
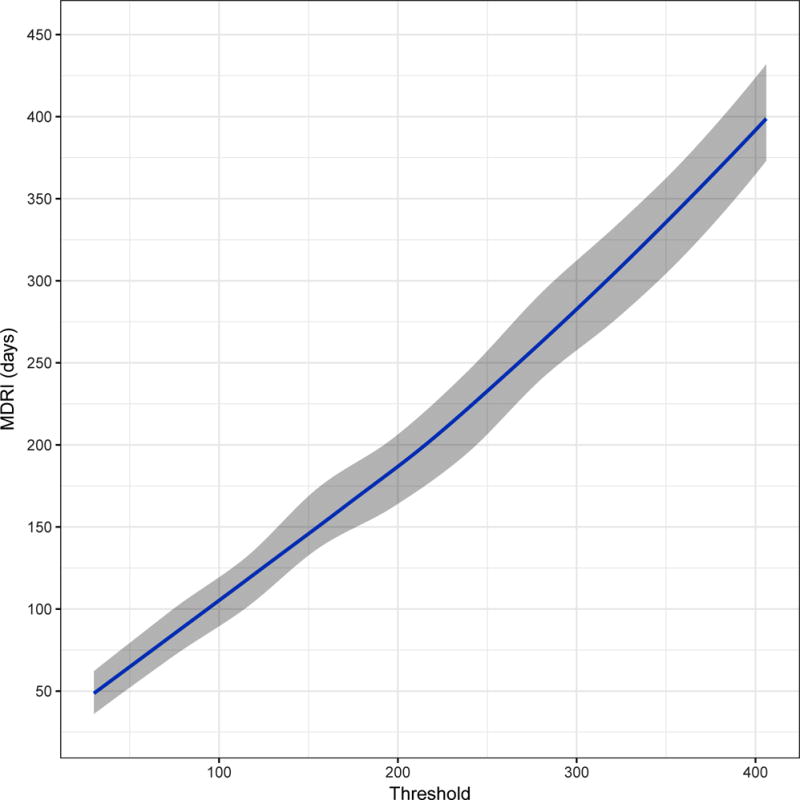
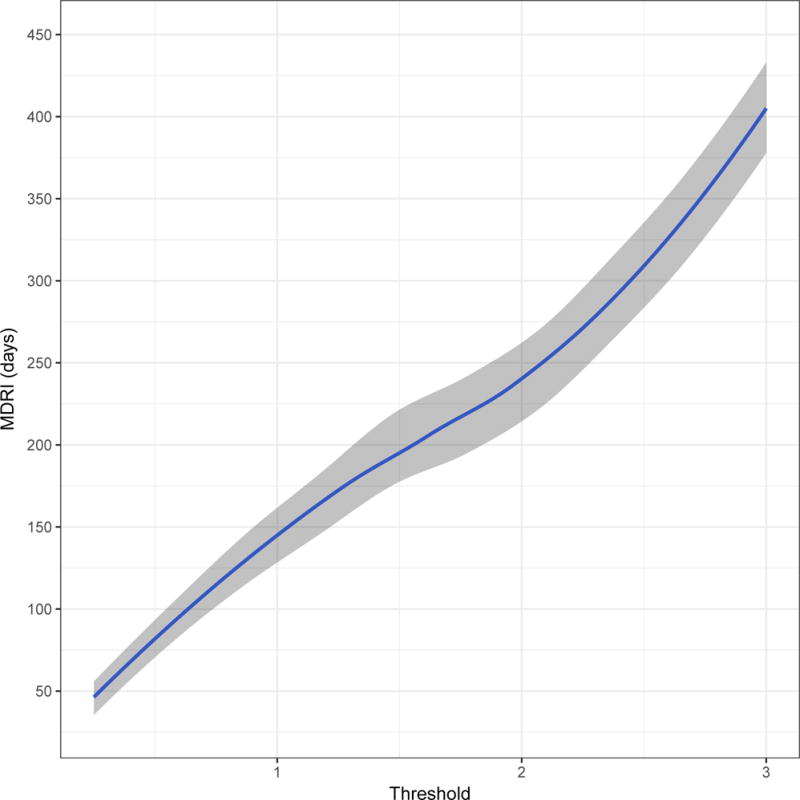
Mean Duration of Recent Infection (y axis), as a function of recency discrimination threshold (x axis, range chosen to yield MDRI values from approximately 50 to 400 days).
A) Minimally diluted (‘untreated well’) of the Ortho VITROS® anti-HIV-1+2 Assay avidity modification
B) Minimally diluted (‘untreated well’) of the Abbott ARCHITECT HIV Ag/Ab Combo Assay avidity modification
C) The completely unmodified (manufacturer IFU) Abbott ARCHITECT HIV Ag/Ab Combo Assay
D) (As a reference) the Sedia™ HIV-1 Limiting Antigen Avidity EIA (LAg)
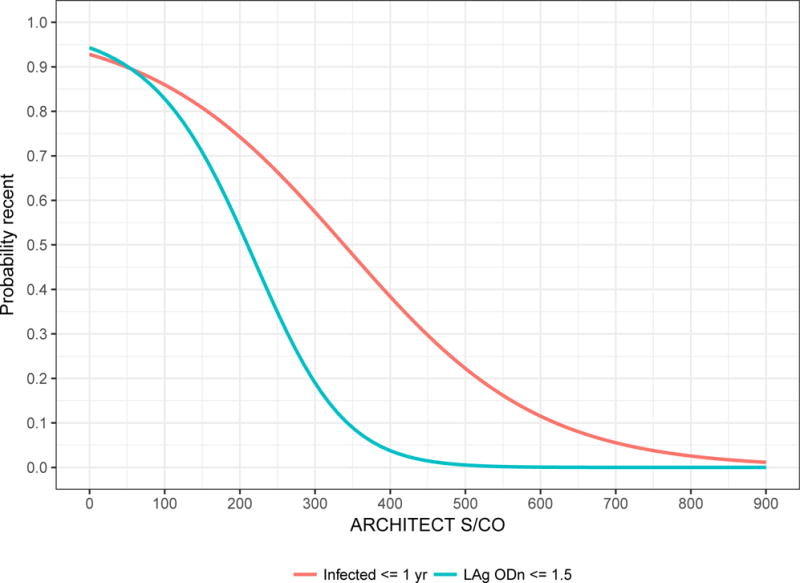
ARCHITECT S/CO measurements are highly correlated with LAg normalised optical density (ODn) measurements (Pearson’s correlation coefficient of 0.796). Low ARCHITECT measurements are highly ‘predictive’ of low LAg measurements, as can be seen in Figure 3, which shows a scatterplot and linear regression model for LAg ODn vs. ACRHITECT S/CO (panel A) and binomial logistic regression for the probability of obtaining an ODn ≤ 1.5 (the conventional recent/non-recent discrimination threshold) and duration of infection less than one year (panel B). Table 1 further reports that 78% of untreated specimens in the evaluation panel with S/CO readings < 200 and viral load measurements > 100 copies/mL produce LAg ODn values ≤ 1.5, and 87% of these specimens were drawn within one year of EDDI. Low quantitative readings from the diagnostic assay, together with above-threshold viral load, therefore appear to obviate the need for additional staging assays.
Figure 3. Low ARCHITECT S/CO measurements ‘predict’ low LAg ODn measurements and short duration of infection.
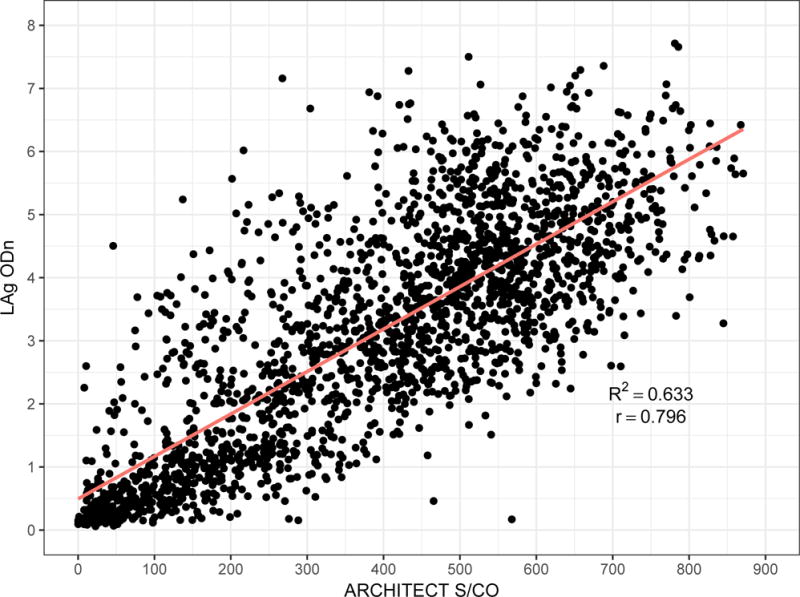
A) Scatterplot of ARCHITECT (x-axis) and LAg (y-axis) readings, and linear regression model
B) Binomial logistic regression models for the probability of obtaining a LAg ‘recent’ result (ODn ≤ 1.5) and probability of duration of infection ≤ 1 year
Table 1. Performance characteristics of the unmodified ARCHITECT assay.
Mean Duration of Recent Infection, context-specific False-Recent Rate and Relative Standard Error on the incidence estimate, in three hypothetical surveillance scenariosproportion LAg-recent and proportion infected less than one year, by Signal-to-Cutoff Ratio recency discrimination threshold and viral load threshold.
| S/CO Threshold < | VL Threshold > | MDRI* (95% CI) days | Scenario A | Scenario B | Scenario C | Proportion LAg ODn < 1.5 % | Proportion time since EDDI < 1 year % | |||
|---|---|---|---|---|---|---|---|---|---|---|
| FRR# % | RSE‡ % | FRR# % | RSE‡ % | FRR# % | RSE‡ % | |||||
| 50 | 100 | 71 (57,86) | 0.0% | 24.7% | 0.0% | 35.8% | 0.0% | 38.7% | 94% | 90% |
| 100 | 100 | 105 (90,121) | 0.1% | 20.4% | 0.1% | 29.9% | 0.2% | 32.3% | 91% | 91% |
| 150 | 100 | 150 (132,169) | 0.1% | 17.4% | 0.2% | 25.4% | 0.3% | 27.2% | 85% | 91% |
| 200 | 100 | 186 (165,208) | 0.4% | 17.0% | 0.5% | 24.4% | 0.6% | 25.2% | 78% | 87% |
| 250 | 100 | 232 (207,257) | 0.7% | 17.0% | 0.9% | 23.9% | 0.6% | 22.5% | 72% | 85% |
| 300 | 100 | 281 (254,310) | 1.3% | 19.0% | 3.6% | 37.1% | 0.7% | 20.4% | 63% | 81% |
| 350 | 100 | 337 (307,366) | 1.7% | 18.3% | 5.0% | 39.4% | 1.1% | 19.0% | 57% | 77% |
Mean Duration of Recent Infection relative to hypothetical viral load assay with detection threshold of 1 copy/ml.
Context-specific False-Recent Rate, estimated for the specified epidemiological scenario.
Relative Standard Error on the incidence estimate for the specified epidemiological scenario. MDRI of RITA adjusted for screening with a qualitative NAT assay (detection threshold 30 copies/ml).
Figure 4 summarises performance metrics for the minimally diluted ‘untreated wells’ of the VITROS and ACRHITECT Avidity assays, the unmodified ARCHITECT diagnostic assay and LAg as part of a RITA in surveillance applications. Panel A shows context-specific FRR in epidemiological scenario A, against MDRI (encoding recency discrimination threshold) and panel B shows the relative standard error (RSE) on the incidence estimate in Scenario A against MDRI. Comparison of the diluted VITROS and ACRHITECT platforms shows a more rapid rise in FRR for the VITROS platform, reaching more than 5% when MDRI is approximately one year. For this reason, the ARCHITECT platform was selected for further evaluation in entirely unmodified form (manufacturer’s IFU). The results indicate that a RITA based on the unmodified ARCHITECT achieves an only marginally higher FRR than the diluted version, and that its performance for surveillance purposes (as captured in the precision of incidence estimates) is very similar to that of a RITA based on the widely-employed LAg assay. In the range of thresholds explored (MDRI ranging from approximate 50 days to approximately 400 days), the lowest RSE on the incidence estimate (in scenario A) achieved with a LAg-based RITA was 13.6%, with the ARCHITECT Avidity (untreated well) 16.0%, with the VITROS Avidity (untreated well) 22.7% and with the unmodified ARCHITECT 17.0%.
Figure 4. Performance characteristics by Mean Duration of Recent Infection.
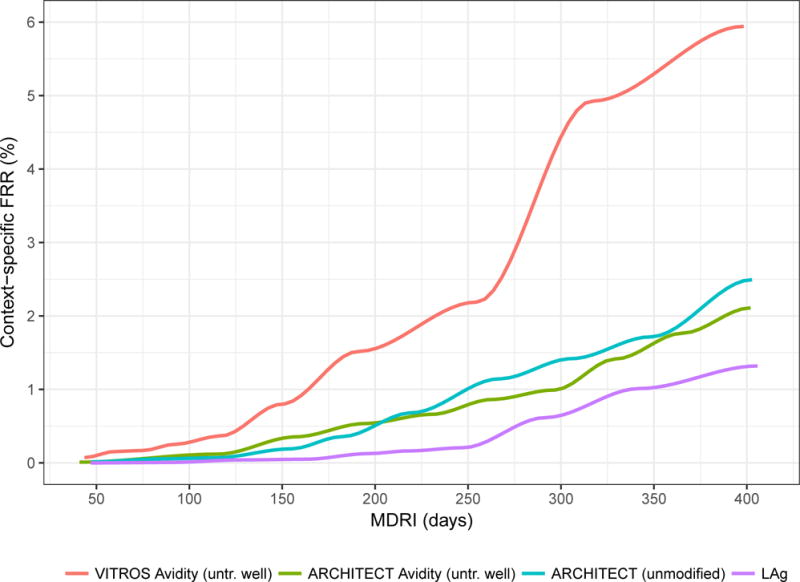
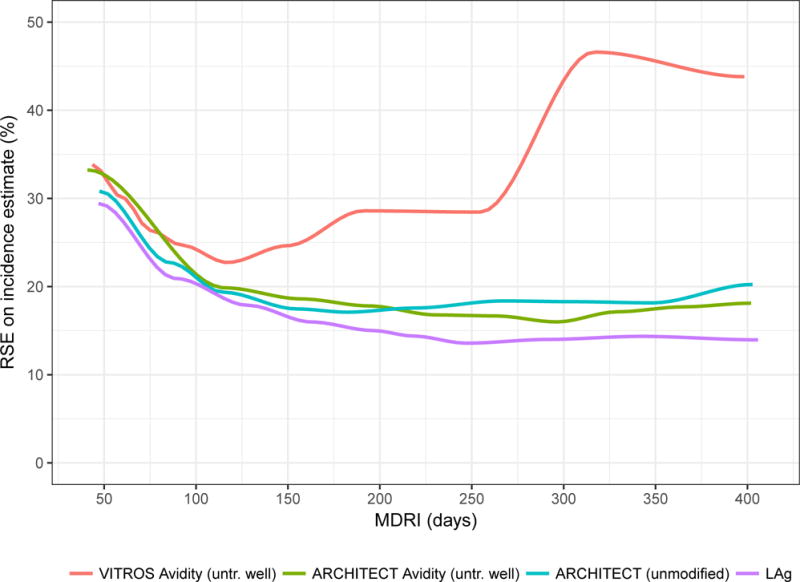
Context-specific False-Recent Rate (FRR) and relative standard error (RSE) on incidence estimate in a demonstrative epidemiological context (30% HIV prevalence, 1.5% per annum incidence, 80% treatment coverage) and using an unstructured sample of 10,000 respondents.
A) Context-specific False-Recent Rate
B) Precision of Incidence Estimate
Table 1 shows performance metrics for a range of S/CO thresholds. MDRI, context-specific FRR and RSE on the incidence estimate under epidemiological scenarios A, B and C. For estimating the RSE on the incidence estimate, MDRI was adjusted for the sensitivity of a NAT-based screening algorithm. In Scenario A, an S/CO threshold of 200 to 250 appears close to optimal, yielding MDRIs of 186 days (95% CI: 165 to 208) and 232 days (207 to 258) respectively, context-specific FRRs of 0.4% and 0.7%, and RSEs on the incidence estimate of 17.0%). In scenario B, an S/CO threshold of 250 produced the highest precision in the incidence estimate, and in scenario C, a threshold of 350 (RSEs of 23.9% and 19.0% respectively). Precision declines at low S/CO thresholds as a result of shorter MDRI and at high thresholds as a result of higher FRRs. Lower thresholds may be useful for clinical staging applications.
Discussion
In Figure 2 we can see that, although the actual ranges of plausible thresholds vary considerably between platforms, the chemiluminescent diagnostic assays have sufficient dynamic range to support simple threshold-based definitions of recent infection. For surveillance applications, such as case-based surveillance, where central laboratories apply recency staging assays to a large number of cases identified in a health system, blood banking applications, and large population-based surveys, the use of custom recency staging assays appear to offer little benefit over interpretation of the information contained in routinely available diagnostic results. Optimal threshold choice depends on the specific epidemiological and methodological context of application, but would involve a similar trade-off between MDRI and FRR as that demonstrated in Table 1 and Figure 4. This was evident in all three epidemiological scenarios, with both MDRI and context-specific FRR increasing with higher thresholds, and different thresholds producing the ‘optimal’ trade-off (i.e. highest precision incidence estimate). Thresholds should therefore be chosen in order to optimise performance in the specific context of any surveillance application.
It is worth noting that even state-of-the-art staging algorithms exhibit disappointing performance in surveillance applications, with precise incidence estimates emerging only at extraordinarily high sample sizes or high values of incidence (10,19). Recency staging data is unlikely ever to be the only source of incidence-related information – meaning that it should be used in conjunction with estimation procedures which also use the demographic (age and time) structure of prevalence data and mortality (20,21).
In interpreting data for individual use, it is important to consider an inherent limitation of any diagnostic test: the potential for false positive results. While an HIV diagnosis would not be based on the outcome of a single test, the lack of confirmatory tests for ‘recent’ infection means that a single test is often used for recency determination. It is likely that a false positive or non-specific reaction would give a low S/CO reading, and thus would be more likely to be misclassified as a recent infection. Consideration must be given to confirming the antibody positive status of the individual. In addition, the very nature of 4th generation combined antigen/antibody tests implies that antigen-only positive samples may also be detected. These results, which are almost certainly truly recent infections, may also generate a low S/CO depending on a number of factors, including the amount of antigen present and whether this antigen has complexed with developing antibody, and should not be discarded over the absence of antibody reactivity, as long as HIV infection is confirmed by, e.g., NAT. Given this, before interpreting a test for recency it is critical to ensure that the HIV diagnosis is confirmed by local testing algorithms and criteria that identify non-specific reactivity and differentiate antibody and antigen reactivity.
One must not dismiss the performance of the unmodified ARCHITECT demonstrated in the present analysis, simply because it is not quite as good as what can currently be achieved by other staging algorithms based on more complex protocols. Substantial logistical and cost advantages, in both routine contexts and population-based surveys, could be achieved by using a single serological assay for diagnostic and staging purposes, especially in the light of the high-throughput, automated nature of these platforms. However, it is recognised that platforms such as ARCHITECT and VITROS are expensive and the benefits of HIV recency testing in conjunction with diagnostic testing would be most apparent in settings where these are already available in laboratories and used for multiple diagnostic or monitoring assays. In settings where routine diagnosis is performed using point-of-care rapid tests, and laboratory confirmation is the exception, these advantages may be less relevant.
Throughout Western Europe, the US, Canada, Australia and in many other countries the standard of laboratory diagnosis for HIV infection includes testing using a 4th generation diagnostic assay (i.e. able to detect HIV p24 antigen and anti-HIV antibody simultaneously). This testing is now available using large automated platforms such as VITROS and ARCHITECT, as part of a wide panel of microbiological, virological and chemical markers. Consequently, such platforms have been widely adopted at local laboratories to provide diagnostic support to facilities in their catchment areas. In contrast, LAg testing is restricted to only a few sites (one in the United Kingdom). Using the UK as an example, anti-HIV-1-positive specimens identified locally, often by testing on ARCHITECT or VITROS, are aliquoted and shipped to a central laboratory for LAg testing, and reporting from the central laboratory back to the local laboratory, which in turn passes the results on to the requesting clinic. This process adds a minimum of two weeks to the determination of HIV recency status. Interpreting recency from the ARCHITECT or VITROS result would reduce delays and costs, by avoiding additional shipping and testing. In many international studies specimens are collected and shipped to central laboratories for HIV confirmatory testing. Our study suggests that if such confirmatory testing is performed using platforms such as ARCHITECT or VITROS, the recency status could be determined contemporaneously – negating the need for further recency testing.
Estimating time since infection based on HIV biomarker progression is made difficult by the complex nonlinear growth exhibited by immune markers of disease progression. The absence of a robust model for capturing inter-subject variability leads to an inability to formally measure the precision of the timing estimate. Nevertheless, simply ‘looking up’ the assay result on the threshold-MDRI curve, and noting that “X reactivity level of this diagnostic assay is one that subjects, on average, spend Y time beneath”, provides clinically meaningful information. In principle, the most natural and coherent way to provide realistic estimates for individual-level times since infection would involve the use of testing histories and other contextually-derived ‘prior information’ in a Bayesian framework. This would require a high level of confidence that the chosen model of biomarker growth correctly captures complex inter-subject variability.
Critical clinical decisions – such as whether to offer expedited antiretroviral treatment – could be based on the transformation, through a calibration curve, of a test result into a timescale (only loosely interpreted as an estimate of time since infection). Currently, a simple “likely recent/non-recent” result is usually fed back to clinician and patient, qualified by a mean time meant by recent, with caveats outlining a number of known confounders of assay performance. Our proposal uses the specific assay result, rather than simply dichotomising results into a recent/non-recent classification, which is based on a single threshold that may be far from the particular patient’s result. It therefore offers an interpretation that is much more informative.
This analysis provides the first evidence that unmodified diagnostic assays can provide meaningful staging information applicable in clinical and surveillance settings. It must be noted that these assays are primarily intended for HIV diagnosis and that these additional interpretations are ‘off-label’ uses of the assay. Previous data have shown that HIV incidence assays, that often work at the limits of detection, are relatively robust to specimen handling conditions (22), and CEPHIA evaluations have not shown anomalous results attributable to specimen handling. However, the possibility does exist that specimen collection methods, handling and storage – even within the manufacturer’s IFU – affect the quantitative results of diagnostic assays, and therefore infection staging interpretations of these results.
Tests that intrinsically serve as part of both a diagnostic algorithm and a staging algorithm offer obvious practical advantages, and perhaps more significantly, create a genuine market advantage. This may stimulate investment in the otherwise unattractive sector of staging assays (15). While customised staging assays will remain useful in many contexts, the ability to extract staging information from diagnostic assays constitutes a significant advance for the fields of clinical staging and incidence surveillance.
Acknowledgments
Sources of Funding: All authors, as members or collaborators of the Consortium for the Evaluation and Performance of HIV Incidence Assays (CEPHIA), are supported by a grant from the Bill and Melinda Gates Foundation (OPP1017716). Additional support for analysis was provided by a grant from the US National Institutes of Health (R34MH096606) and specimen and data collection were funded in part by additional grants from the NIH (P01 AI071713, R01 HD074511, P30 AI027763, R24 AI067039, AI43638, AI74621 and AI106039); California HIV-1 Research Program (RN07-SD-702); Brazilian Program for STD and AIDS, Ministry of Health (914/BRA/3014-UNESCO); and São Paulo City Health Department (2004-0.168.922–7). S.M.K and M.P.B. receive ongoing grant support from Abbott, Ortho Clinical Diagnostics and Sedia Biosciences Corporation for the evaluation of their respective assays. M.A.P. and selected samples from IAVI-supported cohorts are funded by IAVI with the generous support of USAID and other donors; a full list of IAVI donors is available at www.iavi.org.
Footnotes
Since the estimation procedure does not rely on longitudinal biomarker progression within individuals, the bootstrapping procedure resamples subjects rather than individual data points (with replacement) to account for the non-independence of measurements on specimens drawn from the same individual.
In the CEPHIA Evaluation Panel, all treated subjects were virally suppressed, resulting in an estimate of in all cases where a supplemental viral load threshold is applied. In real-world populations, it is likely that a certain (unknown) proportion of treated subjects would be virally unsuppressed and that the FRR in treated subjects would therefore be non-zero.
Author Contributions: E.G. and A.W. analysed the data and wrote the manuscript; G.M., J.H. and S.M.K. conducted the laboratory testing; S.N.F., K.M. and E.G. managed the specimen repository and clinical data; G.M., A.W., C.D.P., and M.P.B. were principal investigators for the study and provided input on analysis; J.N.M., S.L., M.A.P., E.G.K., and C.D.P. were principal investigators for the clinical cohorts; G.M. conceived and oversaw the study; All authors reviewed and provided input on the manuscript.
Previous presentation: Portions of these data presented at the 2016 HIV Diagnostics Conference, Atlanta, GA, March 24, 2016 and at the 2017 Conference on Retroviruses and Opportunistic Infections (CROI), Seattle, WA, February 13-16, 2017.
References
- 1.Brookmeyer R, Quinn TC. Estimation of current human immunodeficiency virus incidence rates from a cross-sectional survey using early diagnostic tests. Am J Epidemiol. 1995 Jan 15;141(2):166–72. doi: 10.1093/oxfordjournals.aje.a117404. [DOI] [PubMed] [Google Scholar]
- 2.McDougal JS, Parekh BS, Peterson ML, Branson BM, Dobbs T, Ackers M, et al. Comparison of HIV type 1 incidence observed during longitudinal follow-up with incidence estimated by cross-sectional analysis using the BED capture enzyme immunoassay. AIDS Res Hum Retroviruses. 2006 Oct;22(10):945–52. doi: 10.1089/aid.2006.22.945. [DOI] [PubMed] [Google Scholar]
- 3.McWalter TA, Welte A. A Comparison of Biomarker Based Incidence Estimators. PLoS One. 2009;4(10) doi: 10.1371/journal.pone.0007368. [DOI] [PMC free article] [PubMed] [Google Scholar]
- 4.Guy R, Gold J, Calleja JMG, Kim AA, Parekh B, Busch M, et al. Accuracy of serological assays for detection of recent infection with HIV and estimation of population incidence: a systematic review. Lancet Infect Dis. 2009 Dec;9(12):747–59. doi: 10.1016/S1473-3099(09)70300-7. [DOI] [PubMed] [Google Scholar]
- 5.Mastro TD, Kim AA, Hallett T, Rehle T, Welte A, Laeyendecker O, et al. Estimating HIV Incidence in Populations Using Tests for Recent Infection: Issues, Challenges and the Way Forward. J HIV/AIDS Surveill Epidemiol. 2010 Jan 1;2(1):1–14. [PMC free article] [PubMed] [Google Scholar]
- 6.Busch MP, Pilcher CD, Mastro TD, Kaldor J, Vercauteren G, Rodriguez W, et al. Beyond detuning: 10 years of progress and new challenges in the development and application of assays for HIV incidence estimation. AIDS. 2010 Nov 27;24(18):2763–71. doi: 10.1097/QAD.0b013e32833f1142. [DOI] [PubMed] [Google Scholar]
- 7.Kassanjee R, McWalter TA, Bärnighausen T, Welte A. A New General Biomarker-based Incidence Estimator. Epidemiology. 2012 Sep;23(5):721–8. doi: 10.1097/EDE.0b013e3182576c07. [DOI] [PMC free article] [PubMed] [Google Scholar]
- 8.Laeyendecker O, Brookmeyer R, Cousins MM, Mullis CE, Konikoff J, Donnell D, et al. HIV Incidence Determination in the United States: A Multiassay Approach. J Infect Dis. 2013 Jan 15;207(2):232–9. doi: 10.1093/infdis/jis659. [DOI] [PMC free article] [PubMed] [Google Scholar]
- 9.Kassanjee R, Pilcher CD, Keating SM, Facente SN, McKinney E, Price MA, et al. Independent assessment of candidate HIV incidence assays on specimens in the CEPHIA repository. AIDS. 2014 Oct;28(16):2439–49. doi: 10.1097/QAD.0000000000000429. [DOI] [PMC free article] [PubMed] [Google Scholar]
- 10.Kassanjee R, Pilcher CD, Busch MP, Murphy G, Facente SN, Keating SM, et al. Viral load criteria and threshold optimization to improve HIV incidence assay characteristics. AIDS. 2016 Sep;30(15):2361–71. doi: 10.1097/QAD.0000000000001209. [DOI] [PMC free article] [PubMed] [Google Scholar]
- 11.Murphy G, Pilcher CD, Keating SM, Kassanjee R, Facente SN, Welte A, et al. Moving towards a reliable HIV incidence test - current status, resources available, future directions and challenges ahead. Epidemiol Infect. 2016 Dec 22;:1–17. doi: 10.1017/S0950268816002910. [DOI] [PMC free article] [PubMed] [Google Scholar]
- 12.Chawla A, Murphy G, Donnelly C, Booth CL, Johnson M, Parry JV, et al. Human immunodeficiency virus (HIV) antibody avidity testing to identify recent infection in newly diagnosed HIV type 1 (HIV-1)-seropositive persons infected with diverse HIV-1 subtypes. J Clin Microbiol. 2007 Feb;45(2):415–20. doi: 10.1128/JCM.01879-06. [DOI] [PMC free article] [PubMed] [Google Scholar]
- 13.Suligoi B, Rodella A, Raimondo M, Regine V, Terlenghi L, Manca N, et al. Avidity Index for anti-HIV antibodies: comparison between third- and fourth-generation automated immunoassays. J Clin Microbiol. 2011 Jul;49(7):2610–3. doi: 10.1128/JCM.02115-10. [DOI] [PMC free article] [PubMed] [Google Scholar]
- 14.Fiebig EW, Wright DJ, Rawal BD, Garrett PE, Schumacher RT, Peddada L, et al. Dynamics of HIV viremia and antibody seroconversion in plasma donors: implications for diagnosis and staging of primary HIV infection. AIDS. 2003 Sep 5;17(13):1871–9. doi: 10.1097/00002030-200309050-00005. [DOI] [PubMed] [Google Scholar]
- 15.Morrison C, Homan R, Averill M, Seepolmuang P, Taylor J, Mastro T. Assays to Measure HIV Incidence: Updated Global Market Assessment and Estimated Public Health Value. 2017 doi: 10.1002/jia2.25018. [DOI] [PMC free article] [PubMed] [Google Scholar]
- 16.Keating SM, Kassanjee R, Lebedeva M, Facente SN, MacArthur JC, Grebe E, et al. Performance of the Bio-Rad Geenius HIV1/2 Supplemental Assay in Detecting “Recent” HIV Infection and Calculating Population Incidence. J Acquir Immune Defic Syndr. 2016 Dec;73(5):581–8. doi: 10.1097/QAI.0000000000001146. [DOI] [PMC free article] [PubMed] [Google Scholar]
- 17.Kassanjee R, McWalter TA, Welte A. Short Communication: Defining Optimality of a Test for Recent Infection for HIV Incidence Surveillance. AIDS Res Hum Retroviruses. 2014 Jan;30(1):45–9. doi: 10.1089/aid.2013.0113. [DOI] [PMC free article] [PubMed] [Google Scholar]
- 18.Welte A, Grebe E, McIntosh A, Bäumler P, Ongarello S. inctools: Incidence Estimation Tools R package version 1.0.10. 2017 Available from: https://cran.r-project.org/package=inctools.
- 19.Kassanjee R. Characterisation and Application of Tests for Recent Infection for HIV Incidence Surveillance. PhD Thesis. School of Computational and Applied Mathematics. Johannesburg: University of the Witwatersrand; 2014. [Google Scholar]
- 20.Mahiane GS, Ouifki R, Brand H, Delva W, Welte A. A General HIV Incidence Inference Scheme Based on Likelihood of Individual Level Data and a Population Renewal Equation. PLoS One. 2012;7(9) doi: 10.1371/journal.pone.0044377. [DOI] [PMC free article] [PubMed] [Google Scholar]
- 21.Grebe E, Huerga H, Van Cutsem G, Welte A. Cross-sectionally estimated age-specific HIV incidence among young women in a rural district of Kwazulu-Natal, South Africa [Internet]. 21st International AIDS Conference; 18–22 July, 2016; Durban, South Africa. Durban: 2016. Available from: http://programme.aids2016.org/PAGMaterial/eposters/0_6506.pdf. [Google Scholar]
- 22.Laeyendecker O, Latimore A, Eshleman SH, Summerton J, Oliver AE, Gamiel J, et al. The effect of sample handling on cross sectional HIV incidence testing results. PLoS One. 2011;6(10) doi: 10.1371/journal.pone.0025899. [DOI] [PMC free article] [PubMed] [Google Scholar]


