

Abstract
Objectives
There have been very few longitudinal studies of dental caries in adolescents, and little study of the caries risk factors in this age group. The purpose of this study was to describe different caries trajectories and associated risk factors among members of the Iowa Fluoride Study (IFS) cohort.
Methods
The IFS recruited a birth cohort from 1992 to 1995, and has gathered dietary, fluoride and behavioral data at least twice yearly since recruitment. Examinations for dental caries were completed when participants were ages 5, 9, 13 and 17 years. For the current study, only participants with DFS caries data at ages 9, 13, and 17 were included (N=396). The individual DFS counts at age 13 and the DFS increment from 13 to 17 were used to identify distinct caries trajectories using Ward’s hierarchical clustering algorithm. A number of multinomial logistic regression models were developed to predict trajectory membership, using longitudinal dietary, fluoride and demographic/behavioral data from 9 to 17 years. Model selection was based on the Akaike Information Criterion (AIC).
Results
Several different trajectory schemes were considered, and a 3 trajectory scheme – no DFS at age 17 (n=142), low DFS (n=145) and high DFS (n=109) – was chosen to balance sample sizes and interpretability. The model selection process resulted in use of an arithmetic average for dietary variables across the period from 9 to 17 years. The multinomial logistic regression model with the best fit included the variables maternal education level, 100% juice consumption, brushing frequency and sex. Other favored models also included water and milk consumption and home water fluoride concentration. The high caries cluster was most consistently associated with lower maternal education level, lower 100% juice consumption, lower brushing frequency and being female.
Conclusions
The use of a clustering algorithm and use of Akaike’s Information Criterion (AIC) to determine the best representation of the data were useful means in presenting longitudinal caries data. Findings suggest that high caries incidence in adolescence is associated with lower maternal educational level, less frequent tooth brushing, lower 100% juice consumption and being female.
Introduction
Adolescence, the period between ages 12 and 20, is characterized by many physical and social changes. This life phase is also marked by increased independence from parents, resulting in changes in behavior, including those relating to diet and oral hygiene1. As such, the development of these “independent” behaviors can affect oral health and establish life-long patterns of behavior1,2.
Despite the myriad of changes occurring during adolescence that can affect oral health, relative to early childhood, there has been relatively little study of caries in adolescents. The most recent U.S. NHANES found that 50% of 12- to 15-year-olds and 67% of 16- to 19-year-olds had caries experience3. In addition to these national data, studies conducted in individual states have also demonstrated the prevalence of caries experience to be 50% or greater4,5.
Factors associated with risk for caries in adolescents have been identified in recent cross-sectional studies. These studies identified lower socioeconomic status7–9, daily consumption of sugary drinks8, not eating breakfast9 and infrequent tooth brushing8,9 as factors associated with caries among individuals in mid-adolescence. There are relatively few longitudinal studies of caries risk factors, but one such study of 13-year-olds in Finland found that previous caries experience and incipient caries, as well as sucrose consumption, were associated with 11-month caries incidence10. Another study11 found that lower socioeconomic status and previous caries experience were associated with caries incidence among adolescents followed from age 12 to age 14 in Sweden. Finally, Foster Page and Thomson12 assessed factors associated with 3-year caries increment among New Zealand teens who were 13 years old at baseline, finding significant risk factors to be lower SES and being male.
While these studies have identified risk factors for caries in adolescents, the two strongest predictors (previous caries experience and low SES) are neither biological nor readily modifiable, and thus, there is a need for a deeper understanding of caries risk in this age group. In addition, there are virtually no longer term studies of this life stage that consider a larger variety of modifiable risk factors. This paper presents data on longitudinal caries patterns of adolescents in the Iowa Fluoride Study using a clustering technique similar to the approach used by Broadbent, et al13, which used trajectory modelling to identify 3 clusters of individuals based on DMFS scores among those participating a longitudinal study in New Zealand which covered ages 5 through 32. The present study also utilized trajectory modelling to identify DMFS trajectories (clusters), but also included an analysis of longitudinal risk factors related to caries cluster membership. The purpose of this study was to describe different caries clusters and associated risk factors among members of the Iowa Fluoride Study (IFS) cohort.
Methods
Descriptions of the Iowa Fluoride Study (IFS) cohort, its recruitment and the study design have been reported previously, so only a brief description is included here14–16. The IFS recruited a birth cohort from 8 Iowa post-partum wards during 1992–1995, and has followed these children (now young adults) since recruitment by gathering questionnaire data through surveys every 6 months on fluoride exposures, oral hygiene practices and diet. Dental examinations for caries and fluorosis took place at the approximate ages of 5, 9, 13 and 17 by a team of trained and calibrated dentist examiners14, using caries criteria developed for the study which distinguished cavitated from non-cavitated lesions16. For these analyses, we included only those participants who had adequate questionnaire data (defined as having completed at least one questionnaire during each of five time periods between the ages of 9 and 17), and those who had completed all three dental examinations at ages 9, 13 and 17. This resulted in a sample size of 396 from the 413 who had completed dental examinations at ages 9, 13 and 17. The sample was comprised of 183 (46.2%) males and 213 (53.8%) females. Summary data on the number of decayed and filled surfaces (DFS) were computed for each subject at each time period, and these values were used to develop DFS clusters, as described below.
The number of decayed, filled, and filled & decayed permanent tooth surfaces (DFS) was determined at each of the three periods. For the age 9 examination, only the first molars and incisors (both lateral and central) were considered. Within each subject, the increments of DFS surfaces were calculated between the age 9 and 13 examinations and between the age 13 examination and 17 examination.
Analyses
A hierarchical clustering procedure was performed using the “hclust” function with Ward’s method from the “stats” package in R (64-bit Version R-3.0.2) to group the children into different DFS trajectories. Hierarchical clustering starts with every individual in his or her own group; it then iteratively combines participants until the entire population forms a single group. Specifically, Ward’s hierarchical method combined people into clusters to minimize within-group variability and maximize between-group variability. The target number of clusters was then specified manually, and the algorithm assigned a cluster membership for each individual.
Clustering was performed using two separate approaches among the 396 individuals who had observations at all three time points. The first approach allowed the clustering algorithm to mathematically determine the clusters among the entire sample. The second approach removed individuals who had zero DFS counts at age 17 (N=142) and “forced” a zero cluster upon them. The clustering algorithm was then performed on the remaining 254 individuals to mathematically determine new cluster memberships.
Initially, clusters were created using age 9 DFS counts, ages 9 to 13 DFS increment, and ages 13 to 17 DFS increment. Two through five sets of DFS clusters were assessed to determine clinical relevance. For both approaches of clustering (that is, mathematical and forced zero), the age 9 DFS mean counts were not clinically different between clusters regardless of the number created. Also, some clusters were created with a very small number of participants (for example, 15 people in a cluster). Owing to the clinical similarity at age 9 and the small sample size issue, the clustering algorithm for both approaches was repeated using only age 13 DFS counts and ages 13 to 17 DFS increment. Since hierarchical clustering is a descriptive technique, there is no “best” method for determining cluster membership. Instead, the goal is to determine a method which captures clinically meaningful patterns.
Due to the abundance of dietary data available, the best way to utilize this information in modeling the outcome cluster membership was determined. Several representation methods were considered including using dietary variable intakes around targeted visit dates (that is, at ages 9, 13 and 17) as separate predictors, using the change(s) in dietary intakes over exam visits, and averaging over the entire adolescent period (that is, over the years between ages 9 and 17). Separate multinomial logistic regressions predicting cluster membership were performed using four beverage intake variables (water and other sugar-free beverages, milk, sugar-sweetened beverages, and 100% juice) as predictors where each model employed separate representation methods. The logistic regressions used a generalized logit and were performed using PROC LOGISTIC in SAS 9.4. The different ways of representing these dietary data were evaluated using Akaike Information Criterion (AIC) values. The AIC is a statistical method that computes penalized fit scores for potential models17. It rewards models which fit the observed data and penalizes for increasing the number of predictors included. This helps users determine both an accurate and parsimonious model. Lower AIC values suggest a preferred model, and it has been proposed that a decrease of 2 or more indicates a significantly better penalized fit. Models within 2 AIC units of each other are deemed to have no worse penalized fit18.
Once the optimal dietary representation was identified, bivariate analyses were undertaken to assess the differences among cluster group memberships for demographic and dietary intake variables. Kruskal-Wallis analyses, the non-parametric form of one-way ANOVA, were performed to assess differences between clusters for the continuous dietary intake variables. The demographic and dietary variables considered in modeling clusters were sex, maternal education category, parental income category, total daily intake of fluoride (mg), home water fluoride concentration (ppm), daily brushing frequency, and the amounts (in liters) of daily water and other sugar-free beverages, milk, sugar-sweetened beverages and 100% juice (that is, undiluted juice with no added sugar) consumed in one day. The time-varying covariates (for example, daily brushing frequency) were all represented in the same way as the dietary variables. AIC was used to determine which subset of predictors best explained cluster membership.
Our approach to the statistical modeling was to avoid the selection of a single ‘best’ model, since the authors feel the selection of one model may overlook other potentially important predictors. Because models within 2 AIC units of each other are deemed to have no worse penalized fit, we present all models within 2 units of the lowest observed AIC value, which we call the “favored” model. This allows us to discuss other recurring predictor variables not chosen by AIC in the “favored” model.
Results
Among the 396 participants, 64.1%, had caries experience at age 17, while 37.4% had caries experience at age 13. Correspondingly, the mean DFS increased from 1.3 to 3.6 during this period, and 55.8% of the participants had caries increments, with the mean increment being 2.4 surfaces. It should be noted that most of the DFS increment was filled surfaces, and that no teeth were lost due to caries (that is, there were no “missing” teeth).
The forced zero clustering approach was chosen and the three clusters were defined as follows: Cluster 1 included participants who had zero DFS at age 17 and no incidence from the age 9 or 13 examinations (n=142); Cluster 2 included those who had some caries experience at age 13, but had low DFS incidence from 13 to 17 (n=145); and Cluster 3 included those who had higher DFS levels at age 13 and had higher incidence from 13 to 17 (n=109). The three clusters are depicted graphically in Figure 1.
Figure 1.
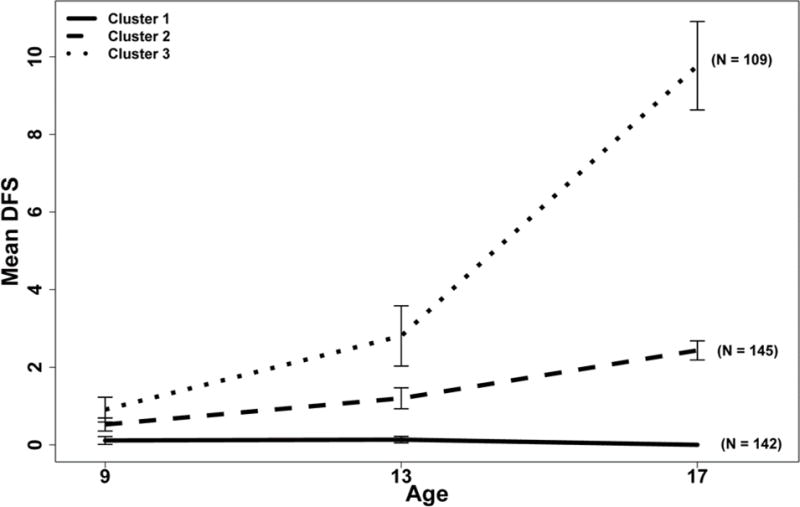
Mean DFS by Age at Examination and Cluster Membership for Participants in the Iowa Fluoride Study
Bivariate analyses (data not shown) revealed that the participants in Cluster 3 (high incidence) were slightly older at the age 17 exams than were the participants in Clusters 1 and 2, but this difference was not statistically significant. Females made up a disproportionate share of Cluster 3 (high incidence) – they comprised 66% of this cluster, while females comprised 50% and 48% for Clusters 1 and 2, respectively (p=0.010). Lower maternal education was associated with membership in Cluster 3, with 37% of mothers of Cluster 3 participants having 4-year college degrees, while 61% of Cluster 1 and 47% of Cluster 2 mothers, respectively, had 4-year college degrees (p<0.001). Similarly, children in Cluster 3 were significantly (p=0.007) less likely to be from families with higher incomes; specifically, 58% of these participants came from families with annual incomes of $60,000 or more, which is lower than for participants in Cluster 2 (68%) or Cluster 1 (75%).
Averaging the dietary variables over the period of 9 to 17 years provided a better penalized fit to the data compared to other representation methods considered19. This indicates that for individuals, the consumption from the 9–13 period was not different enough from the consumption from the 13–17 period to justify representing it as two separate variables. Table 1 presents bivariate analyses of cluster membership with dietary and fluoride intake variables defined as the average exposure and intakes over the period from 9 to 17 years. There were no differences among clusters based on mean daily fluoride intake or mean home water fluoride concentration, and no differences in mean daily sugar-sweetened beverage consumption. However, participants in Cluster 1 had higher 100% juice consumption (p<0.01) than those in either of the other clusters, while there was no difference in 100% juice consumption between Clusters 2 and 3 (p=1.00). Cluster 1 participants also had higher milk consumption (p=0.04), which was marginally higher than those in Cluster 2 (p=0.06) and Cluster 3 (p=0.07); again, there was no difference in milk consumption between Clusters 2 and 3 (p=1.00). For water and sugar-free beverage consumption, those in Cluster 1 had marginally higher consumption than did those in Cluster 3 (p=0.07), but there were no differences between Clusters 1 and 2 (p=0.22) or Clusters 2 and 3 (p=0.80). Finally, in addition to the data shown in Table 1, participants in Cluster 1 had significantly higher brushing frequency than did those in either Cluster 2 or 3 (p=0.02).
Table 1.
Summary Statistics for the Fluoride and Dietary Variables Averaged over the Age 9 to 17 Time Points for Iowa Fluoride Study Participants.
| Variable | Cluster 1 (N=142) |
Cluster 2 (N=145) |
Cluster 3 (N=109) |
Combined (N=396) |
p-value* | ||||
|---|---|---|---|---|---|---|---|---|---|
| Mean | SD | Mean | SD | Mean | SD | Mean | SD | ||
| Total fluoride consumption (mg) | 0.81 | 0.36 | 0.78 | 0.34 | 0.75 | 0.33 | 0.78 | 0.35 | 0.47 |
| Home fluoride level (ppm) | 0.80 | 0.34 | 0.85 | 0.36 | 0.77 | 0.35 | 0.81 | 0.35 | 0.24 |
| Water (liters/day) | 0.54 | 0.28 | 0.51 | 0.31 | 0.47 | 0.25 | 0.51 | 0.28 | 0.07 |
| Milk (liters/day) | 0.40 | 0.19 | 0.35 | 0.21 | 0.35 | 0.22 | 0.37 | 0.21 | 0.04 |
| Sugar-sweetened Beverage (liters/day) | 0.31 | 0.19 | 0.32 | 0.21 | 0.35 | 0.22 | 0.32 | 0.20 | 0.32 |
| 100% Juice (liters/day) | 0.08 | 0.07 | 0.06 | 0.06 | 0.05 | 0.04 | 0.07 | 0.06 | <0.01 |
p-values based on Kruskal-Wallis test
Boldface type indicates significant (p<0.05) differences overall among clusters based on longitudinal data modelling.
A series of multinomial logistic regression models were developed to predict cluster membership, with model selection based on the Akaike Information Criterion (AIC). Table 2 presents models with the least penalized (best) fits based on the AIC for models within 2 units of the lowest observed AIC value. All models included 100% juice consumption, sex, average daily tooth brushing frequency, and mother’s education level. Other variables, including water and sugar-free beverages, milk and home fluoride concentration appeared in some models, while sugar-sweetened beverage consumption, total daily fluoride intake and annual family income did not appear in any of the preferred models.
Table 2.
Model Selection using AIC for Dietary, Fluoride and Brushing Frequency Variables
| Model | Water | Milk | Sugar Bev. | Juice | Total mgF | Home Fluoride | Sex (Female) | Mother Educ. (4 Yr Degree) | Income | Brush Freq | AIC |
|---|---|---|---|---|---|---|---|---|---|---|---|
| 1 | 0.002 +/+ | 0.004−/− | 0.041+/+ | 0.036+/+ | 795.34 | ||||||
| 2 | 0.002+/+ | 0.18−/+ | 0.004−/− | 0.040+/+ | 0.033+/+ | 795.82 | |||||
| 3 | 0.25+/− | 0.002+/+ | 0.003−/− | 0.046+/+ | 0.034+/+ | 796.50 | |||||
| 4 | 0.28+/− | 0.002+/+ | 0.20−/+ | 0.003−/− | 0.044+/+ | 0.031+/+ | 797.21 | ||||
| 5 | 0.35+/+ | 0.001+/+ | 0.006−/− | 0.050+/+ | 0.061+/+ | 797.22 |
In each cell with values, the number provides the overall significance level for the variable. Below each number, there are two symbols (+ or −). The first symbol describes the relationship between cluster 1 and cluster 2, while the second symbol describes the relationship between cluster 1 and cluster 3. If the symbol is a “+” sign, then increasing the intake or being in the reference group increased the odds of being in cluster 1 over cluster 2. If the symbol is a “− “ sign, then decreasing the intake or not being in the reference group increased the odds of being in cluster 1 over cluster 2. If the symbol is bold and in larger font, then the estimate is statistically significant (p<0.05).
Table 3 presents detailed information about the most favored multinomial model (that is, Model 1 from Table 2). This model found that 100% juice intake (p<0.01), average brushing frequency (p=0.04), sex (p<0.01), and maternal education level (p=0.04) were predictors of DFS cluster membership. Participants in Cluster 1 had higher 100% juice intake than did participants in Cluster 2 (p=0.02) and Cluster 3 (p<0.01). Participants in Cluster 3 had higher odds of being female (p<0.01) and having mothers who did not have a 4-year college degree (p=0.01) than participants in Cluster 1. There were no observed differences in sex (p=0.72) or maternal educational level (p=0.11) between Cluster 1 and Cluster 2. Participants who brushed more frequently had higher odds of belonging to Cluster 1 than to Cluster 3 (p=0.01).
Table 3.
Parameter Estimates, Significance Levels, and Odds Ratios for Parameters in the Favored Model†
| Parameter | Cluster | Estimate | SE | p-value | Odds Ratio (CI) |
|---|---|---|---|---|---|
| Intercept | 1 | — | — | — | — |
| Intercept | 2 | −1.240 | 0.473 | 0.009 | — |
| Intercept | 3 | −1.354 | 0.518 | 0.009 | — |
| Juice (increase in 1 oz/day) | 1 | — | — | — | 1.00 |
| Juice (increase in 1 oz/day) | 2 | 0.141 | 0.058 | 0.015 | 1.15 (1.03, 1.29) |
| Juice (increase in 1 oz/day) | 3 | 0.250 | 0.075 | <0.001 | 1.28 (1.11, 1.49) |
| Brushing Average (increase in 1 time per day) | 1 | — | — | — | 1.00 |
| Brushing Average (increase in 1 time per day) | 2 | 0.411 | 0.279 | 0.141 | 1.51 (0.87, 2.60) |
| Brushing Average (increase in 1 time per day) | 3 | 0.798 | 0.310 | 0.010 | 2.22 (1.21, 4.08) |
| Sex (Female* vs Male) | 1 | — | — | — | 1.00 |
| Sex (Female* vs Male) | 2 | −0.090 | 0.249 | 0.717 | 0.91 (0.56, 1.49) |
| Sex (Female* vs Male) | 3 | −0.894 | 0.291 | 0.002 | 0.41 (0.23, 0.72) |
| Mother’s Education (4 Yr Degree or More* vs <4 Yr Degree) | 1 | — | — | — | 1.00 |
| Mother’s Education (4 Yr Degree or More* vs <4 Yr Degree) | 2 | 0.406 | 0.254 | 0.111 | 1.50 (0.91, 2.47) |
| Mother’s Education (4 Yr Degree or More* vs <4 Yr Degree) | 3 | 0.717 | 0.288 | 0.013 | 2.05 (1.16, 3.60) |
The estimate is the change in log-odds for being in cluster 1 when we increase one unit or are in the displayed group. The odds ratio and confidence interval are the multiplicative change in odds of being in cluster 1 compared to cluster 2 or 3 when the variable is increased by one unit or is in the reference group.
Indicates Reference Group
In addition to the data presented in Table 3, there were no significant pairwise differences observed between Clusters 2 and 3 in the odds of cluster membership for average 100% juice intake (p=0.15), average tooth brushing frequency (p=0.18), or maternal educational level (p=0.26). Females had significantly higher odds than males of belonging to Cluster 3 (p<0.01).
Discussion
These longitudinal trajectory (cluster) analyses demonstrate that there was an identifiable group who experienced high caries incidence during adolescence, while another group had virtually no caries incidence during that period. These findings are consistent with U.S. national data that have documented health disparities and shown that caries tends to be concentrated in a minority of individuals3. The findings also highlight that certain factors, (including lower maternal educational levels, less frequent tooth brushing, lower 100% juice consumption and being female) are associated with being in the high caries incidence cluster.
Our finding of a significant association between a lower SES indicator (maternal education) and the high caries cluster is not surprising, since caries is a disease that has been associated with poverty in many previous studies7–9, 11, 12, 20. Similarly, caries has also been associated with less frequent brushing8,9,21. Previous studies have been inconsistent in their findings on caries and sex, with no consistent pattern favoring higher caries in one sex or the other; thus, our finding of females making up a majority of individuals in the high caries cluster is surprising, but not inconsistent with the literature.
The findings of higher 100% juice consumption being associated with lower caries incidence is also consistent with some of our previous findings from this cohort15, but it nonetheless merits comment, as does our lack of a significant association between sugar-sweetened beverage intakes and high caries incidence. While both 100% juice and sugar-sweetened beverages contain sugars, and each is cariogenic, there are some important distinctions. First, 100% juice is more expensive than are most sugar-added beverages, so that its apparent protective effect could reflect the higher SES of those consuming it. Second, 100% juice consumption also could be associated with healthy behaviors including healthier, lower sugar diets overall and regularly eating breakfast, as well as healthier lifestyles. Lastly, the way 100% juice and sugar-sweetened beverages are consumed likely differ, in that 100% juice is often consumed in one sitting (at breakfast, for example) covering a brief amount of exposure to the oral cavity, whereas sugar-sweetened beverages may be consumed over longer periods. Although sugar-sweetened beverage consumption was slightly higher in the high caries incidence cluster, the clusters did not differ in sugar-sweetened beverage consumption (p=0.32). This could be due to the relatively low consumption of such beverages among members of the cohort, and to their relative affluence.
It should be noted that, while the most favored model found membership in the high caries cluster to be associated with lower maternal education, less frequent brushing, lower 100% juice consumption and being female, other models (Table 2), with similar model fits (as measured by AIC) also found lower milk and water consumption and lower home water fluoride concentration to be associated with the high caries cluster. As such, the most favored model (as detailed in Table 3) should not be considered as the “final” or definitive model, since other models with slightly different sets of independent variables could have been chosen based on similar AIC values. We believe that the AIC is a useful criterion to be used in analyses determining factors associated with dental caries incidence, because dental caries has a complex etiology and presenting a single, “final” model could over-simplify the complexity of the interplay among variables. The most favored model was chosen for interpretation in this paper based on the four variables being consistently included in all of the models tested and because it provided a more straightforward interpretation of the findings; nonetheless, we included the other possible models with similar AIC values to give the reader a more complete picture of caries risk factors. Moreover, it should be noted that all possible variable combinations were considered for models in this analysis (including models containing sugar-sweetened beverage consumption and total fluoride exposure variables), however including these variables in the model did not provide enough additional predictive information to justify their inclusion in the chosen models (i.e., the AIC values of the models where they were both included were larger than 2 units from the lowest observed AIC value). Therefore, these models were not presented in the manuscript.
As noted above, the IFS cohort is a relatively homogenous and high-SES group and this is a key limitation of the study. Moreover, those who remained in the study, completed the dental examinations at ages 9, 13 and 17, and provided sufficient data to meet our inclusion criteria were likely more knowledgeable about oral health and as a group practices healthier behaviors than the general population. Thus, findings from this study should be generalized to the larger population with caution. Nonetheless, large, long-term longitudinal studies are rare, and the ability to determine clusters based on long-term caries experience and predict cluster membership based on longitudinal risk factors is clearly a strength of the study.
In conclusion, the use of a clustering algorithm and use of Akaike’s Information Criterion (AIC) to determine the best representation of the data were demonstrated to be useful means of describing and presenting longitudinal caries data. The findings suggest that high caries incidence in adolescence is associated with lower maternal educational level, less frequent tooth brushing, lower 100% juice consumption and being female, although lower milk and water consumption and lower home water fluoride concentrations could also be risk factors.
Acknowledgments
This study was supported in part by the National Institutes of Health grants R03-DE023784, R01-DE12101, R01-DE09551, UL1-RR024979, UL1-TR000442, UL1-TR001013, M01-RR00059, the Roy J. Carver Charitable Trust, and Delta Dental of Iowa Foundation.
Footnotes
DR. JOHN WARREN (Orcid ID : 0000-0002-0090-9973)
References
- 1.Frech A. Healthy behavior trajectories between adolescence and young adulthood. Advances Life Course Res. 2012;17:59–68. doi: 10.1016/j.alcr.2012.01.003. [DOI] [PMC free article] [PubMed] [Google Scholar]
- 2.Umberson D, Crosnoe R, Reczek C. Social relationships and health behavior across the life course. Ann Rev Sociol. 2010;36:139–57. doi: 10.1146/annurev-soc-070308-120011. [DOI] [PMC free article] [PubMed] [Google Scholar]
- 3.Dye BA, Thornton-Evans G, Li X, Iafolla TJ. Dental caries and sealant prevalence in children and adolescents in the US, 2011–2012. Hyattsville, MD: National Center for Health Statistics; 2015. (NCHS data brief no 191). [PubMed] [Google Scholar]
- 4.Weyant RJ, Manz M, Corby P. Dental caries status and need for dental treatment of Pennsylvania public school children in grades 1, 3, 9, and 11. J Public Health Dent. 2004;64:136–44. doi: 10.1111/j.1752-7325.2004.tb02743.x. [DOI] [PubMed] [Google Scholar]
- 5.Skaret E, Weinstein P, Milgrom P, Kaakko T, Getz T. Factors related to severe untreated tooth decay in rural adolescents: a case-control study for public health planning. International J Paediatric Dent. 2004;14:17–26. doi: 10.1111/j.1365-263x.2004.00517.x. [DOI] [PubMed] [Google Scholar]
- 6.Mitchell DA, Ahluwalia KP, Albert DA, Zabos GP, Findley SE, Trinh-Shevrin CB, Marshall SE, Lamster IB, Formicola AJ. Dental caries experience in northern Manhattan adolescents. J Public Health Dent. 2003;63:189–94. doi: 10.1111/j.1752-7325.2003.tb03498.x. [DOI] [PubMed] [Google Scholar]
- 7.Polk DE, Weyant RJ, Manz MC. Socioeconomic factors in adolescents’ oral health: are they mediated by oral hygiene behaviors or preventive interventions? Community Dent Oral Epidemiol. 2010;38:1–9. doi: 10.1111/j.1600-0528.2009.00499.x. [DOI] [PubMed] [Google Scholar]
- 8.Skinner J, Johnson G, Blinkhorn A, Byun R. Factors associated with dental caries experience and oral health status among New South Wales adolescents. Austral New Zealand J Public Health. 2014;38:485–9. doi: 10.1111/1753-6405.12245. [DOI] [PubMed] [Google Scholar]
- 9.Dusseldorp E, Kamphuis M, Schuller A. Impact of lifestyle factors on caries experience n there different age groups: 9, 15, and 21-year-olds. Community Dent Oral Epidemiol. 2015;43:9–16. doi: 10.1111/cdoe.12123. [DOI] [PubMed] [Google Scholar]
- 10.Raitio M, Pienihäkkinen K, Scheinin A. Assessment of single risk indicators in relation to caries increment in adolescents. Acta Odontol Scand. 1996;54:113–17. doi: 10.3109/00016359609006015. [DOI] [PubMed] [Google Scholar]
- 11.Källestål C, Wall S. Socio-economic effect on caries Incidence data among Swedish 12-14-year-olds. Community Dent Oral Epidemiol. 2002;30:108–14. doi: 10.1034/j.1600-0528.2002.300204.x. [DOI] [PubMed] [Google Scholar]
- 12.Foster Page LA, Thomson WM. Caries prevalence, severity, and 3-year increment, and their impact upon New Zealand adolescents’ oral-health-related quality of life. J Public Health Dent. 2012;72:287–94. doi: 10.1111/j.1752-7325.2012.00336.x. [DOI] [PubMed] [Google Scholar]
- 13.Broadbent JM, Thomson WM, Poulton R. Trajectory patterns of dental caries experience in the permanent dentition to the fourth decade of life. J Dent Res. 2008;87:69–72. doi: 10.1177/154405910808700112. [DOI] [PMC free article] [PubMed] [Google Scholar]
- 14.Broffitt B, Levy SM, Warren J, Cavanaugh JE. Factors associated with surface-level caries incidence in children aged 9 to 13: the Iowa Fluoride Study. J Public Health Dent. 2013;73:304–10. doi: 10.1111/jphd.12028. [DOI] [PMC free article] [PubMed] [Google Scholar]
- 15.Chankanka O, Cavanaugh JE, Levy SM, Marshall TA, Warren JJ, Broffitt B, Kolker JL. Longitudinal associations between children’s dental caries and risk factors. J Public Health Dent. 2011;71:289–300. doi: 10.1111/j.1752-7325.2011.00271.x. [DOI] [PMC free article] [PubMed] [Google Scholar]
- 16.Warren JJ, Levy SM, Kanellis MJ. Dental caries in the primary dentition: assessing prevalence of cavitated and non-cavitated lesions. J Pub Health Dent. 2002;62:109–14. doi: 10.1111/j.1752-7325.2002.tb03430.x. [DOI] [PubMed] [Google Scholar]
- 17.Petrov BN, Csaki F, editors. 2nd International Symposium on Information Theory. Budapest: Akadémiai Kiadó; 1973. Information theory and an extension of the maximum likelihood principle. [Google Scholar]
- 18.Burnham KP, Anderson DR. Model selection and multimodel inference : A practical information-theoretic approach. New York: Springer; 2002. [Google Scholar]
- 19.VanBuren J, Cavanaugh J, Marshall T, Warren J, Levy SM. AIC identifies optimal representation of longitudinal dietary variables. J Public Health Dent. 2017 doi: 10.1111/jphd.12220. [Epub ahead of print] [DOI] [PMC free article] [PubMed] [Google Scholar]
- 20.Dye BA, Tan S, Smith V, et al. Trends in Oral Health Status: United States, 1988–1994 and 1999–2004. Vital Health Stat. 2007;11(248):1–92. [PubMed] [Google Scholar]
- 21.Kumar S, Tadakamadla J, Johnson NW. Effect of toothbrushing frequency on incidence and increment of dental caries – a systematic review and meta-analysis. J Dent Res. 2016;95:1230–6. doi: 10.1177/0022034516655315. [DOI] [PubMed] [Google Scholar]