
Fig. 2.
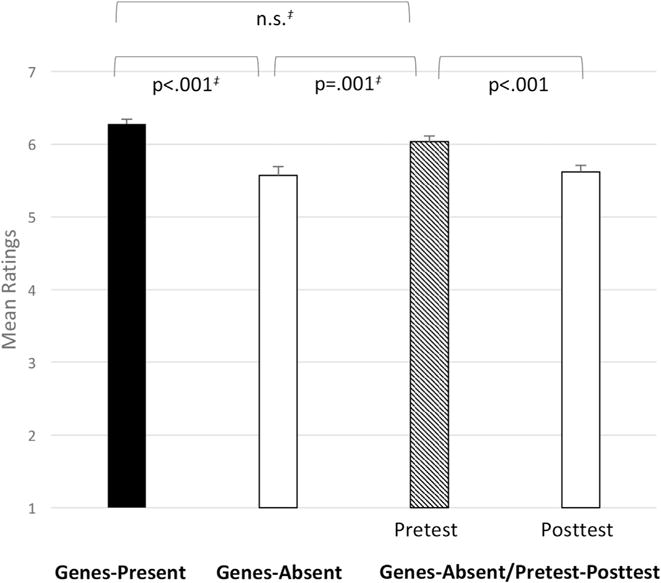
Mean ratings of the significance of diet and exercise broken down by the three conditions and by the pretest and posttest ratings in the genes-absent/pretest-posttest condition. Error bars indicate 1 standard error. P-values marked ‡ are results from Tukey HSD tests. White bars indicate ratings made by participants who had been told that they lacked a genetic predisposition to obesity.