Abstract
In this paper, we used the Hyper-Pure Germanium (HPGe) detector to measure 30 samples which are collected from north of Nile Delta near Rosetta beach in Egypt. The activity of primordial radionuclides, such as 238U, 235U, 232Th, and 40K was estimated. Concentrations ranged between 36.5–177.4, 50–397.5 and 56.1–168.9 Bq.kg−1 for 238U, 232Th and 40K respectively. Activity concentration of 235U and the variation in uranium isotopic ratio 235U/238U was calculated. External hazard indices (Hex) (or radium equivalent activity Raeq), activity concentration indices (I), alpha index (Iα), absorbed outdoor gamma dose rate (Dout), effective outdoor gamma dose rate (Eout) and Excess Lifetime Cancer Risk (ELCR) due to different samples are estimated. External hazard indices (Hex) are ranged between 0.32–2.04, radium equivalent activity (Raeq) are ranged between 118.67–753.91, the activity concentration indices (I) are 0.42–2.61, and alpha index (Iα) are 0.18–0.89. External hazard indices (Hex) in some samples more than unity then it exceeds the upper limit of exposure. Also, the radium equivalent activities (Raeq) are higher than the exemption limits (370 Bq.kg−1).
Introduction
Human beings always are exposed to natural radiation, which is mainly due to the activity of natural radionuclides: 238U (226Ra) series, 232Th series and 40K that are present in the earth’s crust, in building materials, air, water, food and the human body. Naturally occurring radionuclides in soils are the major contributors of outdoor terrestrial natural radiation1. Due to these radionuclides are not uniformly distributed, the understanding of their distribution in soil, sand, and rock are very important in radiation protection and measurement2. The associated external exposures due to gamma radiation emitted from these radionuclides depend on the geographical and geological conditions and were varied vary from region to another in the world. High background radiation areas, (HBRAs) are distributed through some regions in the world3. In Egypt, there are some areas known for their HBRAs whose geological and geochemical characteristics increase the levels of natural radiation. Black sand one of the most famous materials that have high background radiation and it contributes to increasing the environmental dose4. Beach sands are mostly composed of feldspar, quartz and other minerals opposing to wave abrasion. They are formed due to fragmentation, weathering, and degradation. Beach placer or “black sand” deposits around Mediterranean Sea’ beaches are known for their economic concentrations of different minerals such as Monazite, Zircon, Biotite, Rutile, Chromite, Garnet, Allanite and Sillimanite, Tourmaline, Sphene, Pyroxenes, Haematite, Ilmenite, Niobian-Rutile, and Pyrrhotite. Pyrrhotite and Niobian-Rutile were found in magnetite and Ilmenite respectively5,6. Hinterland geology, sub-tropical climate, geomorphology and intricate network drainage aided by wind, waves, and currents have influenced these formations. Monazite bearing black sands contains 232Th with some extent of 238U and 40K7,8. The main activity of the uranium and thorium series is due to the fractions of zircon, Imenite and little of it due to garnet 238U activity was controlled by heavy non-magnetic (HNM) fraction (Monazite, Zircon, Titanite and Apatite), while the heavy magnetic (HM) fraction, at least for the heavy mineral rich samples bearing high amounts of Epidote crystals with Allanite cores, control their 232Th content9–11. Studies concerning the radiation risks arising from exposure to black sand showed that is the main source of external dose to the world population was due to natural radiation12–14.
This study investigates the distribution of natural radionuclides in the north of Nile Delta near Rosetta beach to understand the radiological risks due to the gamma-ray exposure15. Samples were collected from east to west and locations were divided into 12 groups, spaced in-between by about 600 m and extending into the land from the beach line for about 50 m or less, Fig. (1).
Figure 1.
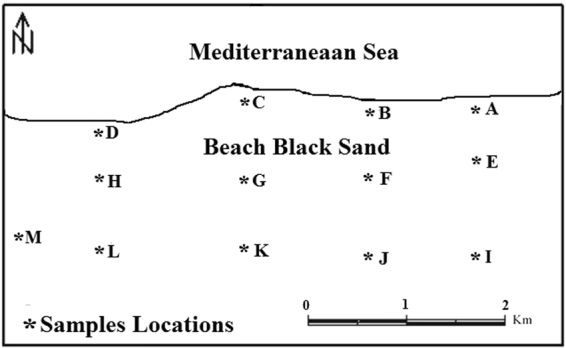
Sampling locations.
Results
Figure (2) shows an example of spectrum analysis of black sand beach. Samples are dominated by Th and U-bearing minerals due to the presence of significant amounts of Monazites and Zircon as shown in Fig. (3).
Figure 2.
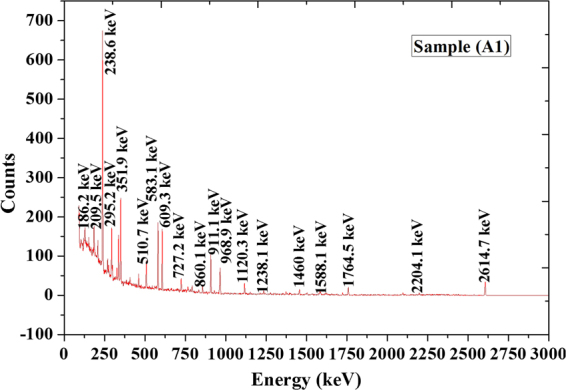
Spectrum analysis for sample (A1).
Figure 3.
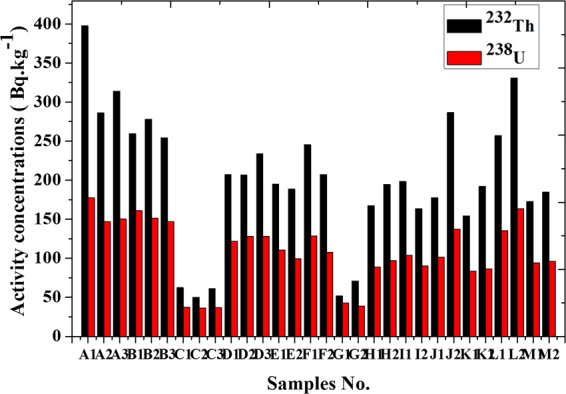
Activity concentrations of 232Th and 238U (Bq.kg−1) for different samples.
Table (1) shows activity concentration (Bq.kg−1) of different samples. They were ranged between 36.5–177.4 with an average of 107.6 Bq.kg−1 for 238U, 50–397.5 with an average of 201.6 Bq.kg−1 for 232Th and 56.1–168.9 with an average of 116.2 Bq.kg−1 for 40K.
Table 1.
Activity concentration of different samples at different locations and 235U/238U ratio.
| Sample | Activity Concentration (Bq.kg−1) 238U 232Th 40K 235U | 235U/238U ratio | |||
|---|---|---|---|---|---|
| A1 | 177.4 ± 39.7 | 397.5 ± 71.5 | 105.0 ± 15.8 | 9.8 ± 8 | 0.055 |
| A2 | 146.9 ± 26.6 | 286.0 ± 12.0 | 93.0 ± 10.7 | 7.3 ± 0.5 | 0.049 |
| A3 | 150.4 ± 42.9 | 313.9 ± 12.1 | 103.0 ± 13.5 | 6.3 ± 0.4 | 0.042 |
| B1 | 160.9 ± 63.9 | 259.4 ± 50.9 | 168.9 ± 17.5 | 11.1 ± 0.9 | 0.069 |
| B2 | 151.4 ± 40.7 | 278.1 ± 36.1 | 83.5 ± 11.3 | 9 ± 0.8 | 0.059 |
| B3 | 146.7 ± 21.0 | 254.2 ± 41.0 | 110.4 ± 12.7 | 6.6 ± 0.5 | 0.045 |
| C1 | 37.6 ± 4.9 | 62.5 ± 18.3 | 151.1 ± 14.9 | 4 ± 0.5 | 0.106 |
| C2 | 36.5 ± 7.0 | 50.0 ± 7.8 | 138.6 ± 19 | 2 ± 0.3 | 0.055 |
| C3 | 36.6 ± 7.2 | 61.0 ± 13.8 | 144.8 ± 17.5 | 2.5 ± 0.2 | 0.068 |
| D1 | 121.6 ± 26.9 | 207.3 ± 44.6 | 94.8 ± 11.5 | 11 ± 08 | 0.090 |
| D2 | 128.0 ± 28.1 | 206.7 ± 20.2 | 117.6 ± 13.4 | 5.7 ± 0.6 | 0.045 |
| D3 | 128.3 ± 36.2 | 233.7 ± 51.0 | 89.4 ± 14.3 | 9.4 ± 0.8 | 0.073 |
| E1 | 110.6 ± 22.7 | 194.8 ± 24.4 | 91.8 ± 12.6 | 6.7 ± 0.7 | 0.061 |
| E2 | 99.3 ± 19.8 | 188.5 ± 32.6 | 129.9 ± 18.2 | 5.2 ± 0.5 | 0.052 |
| F1 | 128.8 ± 19.0 | 245.2 ± 36.8 | 76.0 ± 9.8 | 10.6 ± 0.9 | 0.082 |
| F2 | 107.5 ± 23.5 | 207.1 ± 34.9 | 118.0 ± 12.7 | 7.8 ± 0.7 | 0.073 |
| G1 | 42.7 ± 5.4 | 52.2 ± 13.5 | 150.0 ± 14.6 | 3.1 ± 0.2 | 0.073 |
| G2 | 39.1 ± 21.4 | 70.9 ± 5.2 | 134.1 ± 14.2 | 3.8 ± 0.2 | 0.097 |
| H1 | 88.7 ± 13.7 | 167.1 ± 39.7 | 92.9 ± 8.5 | 5.1 ± 0.4 | 0.057 |
| H2 | 96.9 ± 22.7 | 194.6 ± 13.7 | 107.5 ± 9.2 | 11.1 ± 0.9 | 0.115 |
| I1 | 103.6 ± 33.5 | 198.4 ± 32.2 | 133.8 ± 12.6 | 3.1 ± 0.2 | 0.030 |
| I2 | 90.4 ± 32.0 | 163.4 ± 38.9 | 142.2 ± 12.8 | 6.8 ± 0.5 | 0.075 |
| J1 | 101.5 ± 31.8 | 177.6 ± 21.2 | 130.5 ± 11.6 | 5.8 ± 0.4 | 0.057 |
| J2 | 137.4 ± 35.6 | 286.6 ± 61.9 | 130.7 ± 13.1 | 10.4 ± 0.8 | 0.076 |
| K1 | 83.4 ± 21.6 | 154.5 ± 25.0 | 110.1 ± 8.8 | 2.5 ± 0.2 | 0.030 |
| K2 | 86.4 ± 13.8 | 192.2 ± 9.7 | 107.5 ± 7.6 | 5.7 ± 0.3 | 0.066 |
| L1 | 135.2 ± 35.7 | 257.1 ± 47.9 | 131.8 ± 11.5 | 7.6 ± 0.7 | 0.056 |
| L2 | 163.3 ± 28.1 | 330.9 ± 65.5 | 122.8 ± 10.3 | 10.8 ± 0.9 | 0.066 |
| M1 | 93.9 ± 12.5 | 172.5 ± 34.2 | 56.1 ± 5.8 | 8.2 ± 0.6 | 0.087 |
| M2 | 95.9 ± 31.3 | 184.8 ± 30.2 | 120.5 ± 11.9 | 2.5 ± 0.4 | 0.026 |
| Min | 36.6 ± 7.2 | 50.0 ± 7.8 | 56.1 ± 5.8 | 2 ± 0.3 | 0.026 |
| Max | 177.4 ± 39.7 | 397.5 ± 71.5 | 168.9 ± 17.5 | 11.1 ± 0.9 | 0.115 |
| Average ± St. Dev. | 107.6 ± 40.2 | 201.6 ± 84.8 | 116.2 ± 25.2 | 6.86 ± 2.9 | 0.065 ± 0.021 |
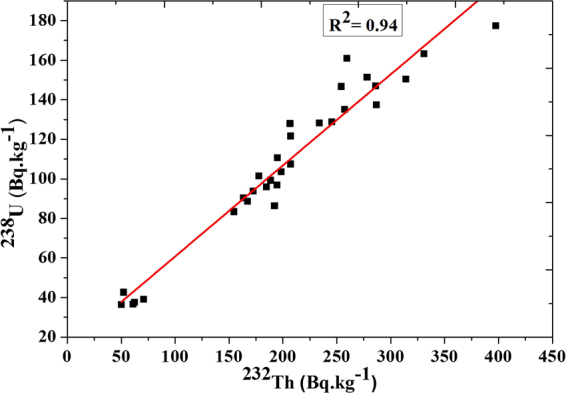
The specific activities ratio (232Th/238U) in sand samples varied from 1.22 to 2.24 with a mean value of 1.84 this is due to that Monazite contains more thorium than uranium16. A correlation exists between the activity of 232Th and 238U in black sand beach samples (R2 = 0.94) with fitting equation 232 Th = 2.17 × 238 U – 20.71 and standard error ( ± 4.7) as shown in Fig. (4).
Figure 4.
Correlation between the activity concentrations for 232Th and 238U.
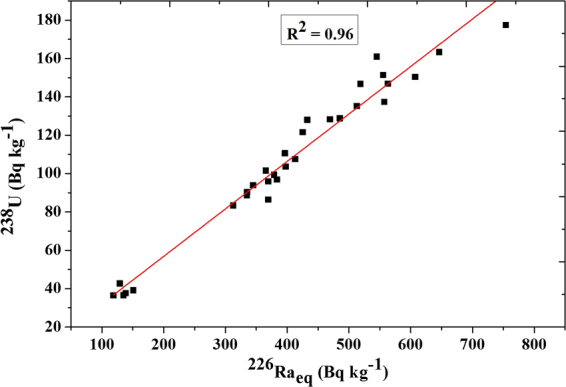
Figure (5) illustrates the relation between 226Raeq and 238U activity with the fitted straight line (R2 = 0.96). This indicated a positive and strong correlation coefficient between uranium concentration and radium equivalent activity level in black sand beach samples.
Figure 5.
Correlation between the activity concentrations for 238U and 226Raeq.
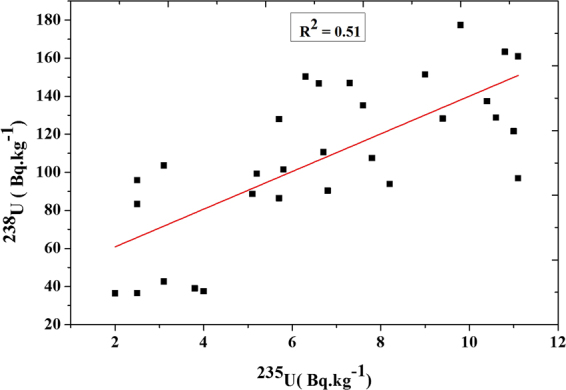
Activity concentration of 235U and the variation in uranium isotopic ratio 235U/238U also is shown in the Table (1). The specific activities ratio (235U/238U) in black sand beach samples varied from 0.026 to 0.115 with an average value of 0.065. A correlation exists between 235U and 238U in black sand beach samples (R2 = 0.51) with fitting equation 235 U = 238 U/9.9 – 4.15 and standard error (±1.1) as shown in Fig. (6). Figure (7) shows an example for U-235 concentration spectrum.
Figure 6.
Correlation between the activity concentrations for 235U and 238U.
Figure 7.
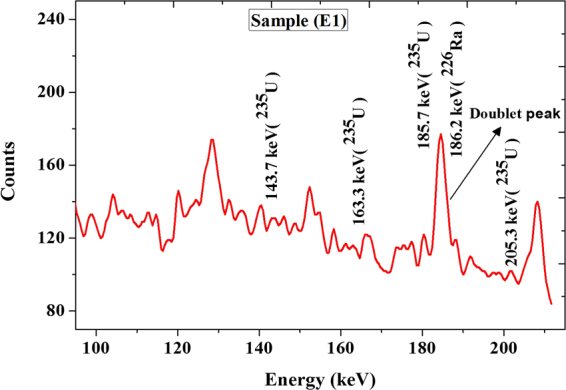
Spectrum of 235U Gamma ray energies and doublet peak of 235U (185.7 keV) plus 226Ra (186.2 keV) for sample (E1).
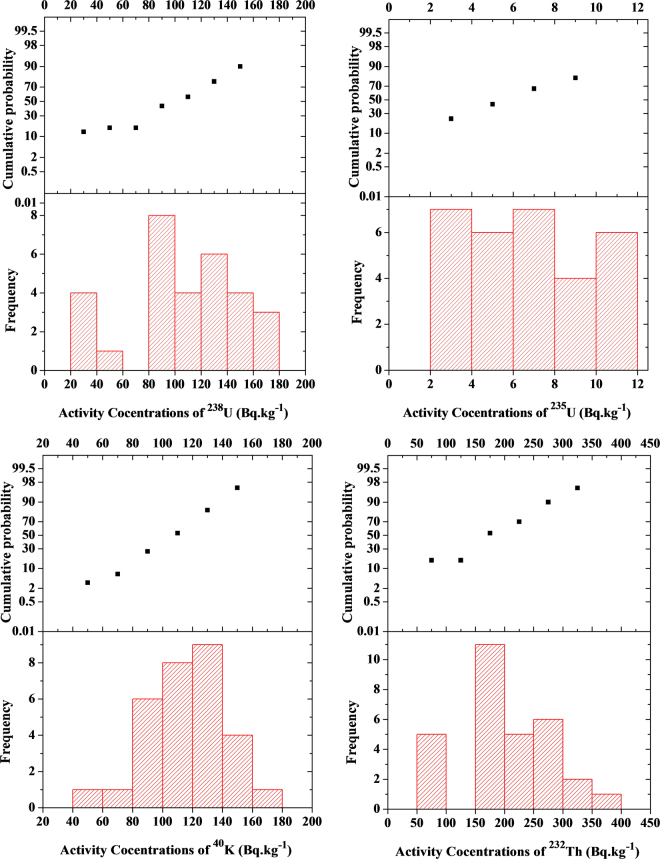
The frequency distribution and the cumulative probability of different isotopes (238U,235U,232Th and 40K) for different samples are shown in Fig. (8).
Figure 8.
Histogram and cumulative probability plots for the frequency distribution of 238U,235U,232Th and 40K for different samples.
Table (2) shows external hazard indices (Hex), activity concentration indices (I), radium equivalent activity (Raeq), alpha index (Iα), absorbed outdoor gamma dose rate (Dout) and effective outdoor gamma dose rate (Eout) due to different samples. External hazard indices (Hex) were ranged between 0.32 and 2.04, radium equivalent activity (Raeq) were ranged between 118.67 to 753.91, activity concentration indices (I) were 0.42–2.61, and alpha index (Iα) were 0.18 to 0.89.
Table 2.
External hazard indices (Hex), radium equivalent Raeq, activity concentration indices (I), alpha index Iα, absorbed dose (Dout), effective (Eout) outdoor gamma dose rate and Excessive Lifetime Cancer Risk (ELCRout) due to different samples.
| Sample | Raeq | Hex | I | Iα | Dout | Eout | ELCRout × 10-3 |
|---|---|---|---|---|---|---|---|
| A1 | 753.91 | 2.04 | 2.61 | 0.89 | 345.95 | 0.42 | 1.49 |
| A2 | 563.04 | 1.52 | 1.95 | 0.73 | 258.01 | 0.32 | 1.1 |
| A3 | 607.21 | 1.64 | 2.11 | 0.75 | 278.57 | 0.34 | 1.20 |
| B1 | 544.85 | 1.47 | 1.89 | 0.80 | 249.89 | 0.31 | 1.07 |
| B2 | 555.51 | 1.50 | 1.92 | 0.76 | 254.24 | 0.31 | 1.09 |
| B3 | 518.71 | 1.40 | 1.80 | 0.73 | 237.57 | 0.29 | 1.02 |
| C1 | 138.61 | 0.37 | 0.49 | 0.19 | 64.89 | 0.08 | 0.28 |
| C2 | 118.67 | 0.32 | 0.42 | 0.18 | 55.51 | 0.07 | 0.24 |
| C3 | 134.98 | 0.36 | 0.48 | 0.18 | 63.17 | 0.08 | 0.27 |
| D1 | 425.34 | 1.15 | 1.47 | 0.61 | 194.81 | 0.24 | 0.84 |
| D2 | 432.64 | 1.17 | 1.50 | 0.64 | 198.23 | 0.24 | 0.85 |
| D3 | 469.37 | 1.27 | 1.63 | 0.64 | 215.02 | 0.26 | 0.92 |
| E1 | 396.23 | 1.07 | 1.37 | 0.55 | 181.61 | 0.22 | 0.78 |
| E2 | 378.86 | 1.02 | 1.32 | 0.50 | 174.35 | 0.21 | 0.75 |
| F1 | 485.29 | 1.31 | 1.68 | 0.64 | 222.26 | 0.27 | 0.95 |
| F2 | 412.74 | 1.11 | 1.43 | 0.54 | 189.70 | 0.23 | 0.81 |
| G1 | 128.90 | 0.35 | 0.45 | 0.21 | 60.18 | 0.07 | 0.26 |
| G2 | 150.81 | 0.41 | 0.53 | 0.20 | 70.34 | 0.09 | 0.30 |
| H1 | 334.81 | 0.90 | 1.16 | 0.44 | 153.80 | 0.19 | 0.66 |
| H2 | 383.46 | 1.04 | 1.33 | 0.48 | 176.32 | 0.22 | 0.76 |
| I1 | 397.61 | 1.07 | 1.38 | 0.52 | 182.97 | 0.22 | 0.79 |
| I2 | 335.01 | 0.90 | 1.17 | 0.45 | 154.38 | 0.19 | 0.66 |
| J1 | 365.52 | 0.99 | 1.27 | 0.51 | 168.06 | 0.21 | 0.72 |
| J2 | 557.30 | 1.51 | 1.93 | 0.69 | 256.10 | 0.31 | 1.10 |
| K1 | 312.81 | 0.84 | 1.09 | 0.42 | 143.93 | 0.18 | 0.62 |
| K2 | 369.52 | 1.00 | 1.28 | 0.43 | 170.21 | 0.21 | 0.73 |
| L1 | 513.00 | 1.39 | 1.78 | 0.68 | 235.56 | 0.29 | 1.01 |
| L2 | 645.94 | 1.74 | 2.24 | 0.82 | 296.37 | 0.36 | 1.27 |
| M1 | 344.89 | 0.93 | 1.19 | 0.47 | 157.90 | 0.19 | 0.68 |
| M2 | 369.44 | 1.00 | 1.28 | 0.48 | 169.98 | 0.21 | 0.73 |
| Min. | 118.67 | 0.32 | 0.42 | 0.18 | 55.51 | 0.07 | 0.24 |
| Max. | 753.91 | 2.04 | 2.61 | 0.89 | 345.95 | 0.42 | 1.49 |
| Av. ± Stdev | 1.1 ± 0.4 | 404.8 ± 159.9 | 1.4 ± 0.6 | 0.54 ± 0.2 | 186. ± 73 | 0.2 ± 0.1 | 0.8 ± 0.3 |
These results show that some locations lead to over-exposure, for example, external hazard indices (Hex) in some samples are found to be more than unity then it exceeds the upper limit of exposure, Fig. (9). Also, radium equivalent activity (Raeq), Fig. (10), was higher than the exemption limits (370 Bqkg−1) that keep the external dose below 1.5 mSvyr−1 as reported by UNSCEAR (2010)17. While activity concentration indices (I) slightly exceed the permissible limits which met 0.3 mSvyr−1 as shown in Fig. (11). Outdoor Excessive Lifetime Cancer Risk (ELCRout) is found to be ranged between 0.24E-3-1.49E-3 with an average of 0.8E-3 which is 2.8 times more than the upper limits 0.29E-318.
Figure 9.
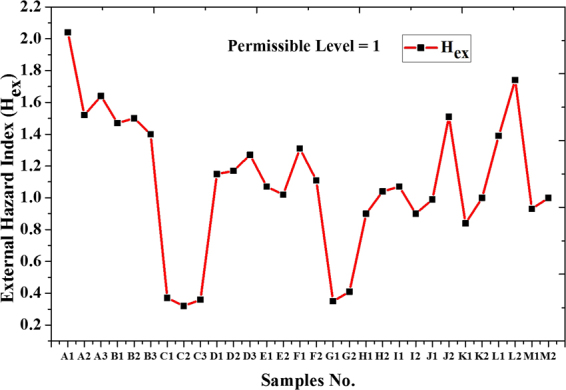
External Hazard Index (Hex) for different samples.
Figure 10.
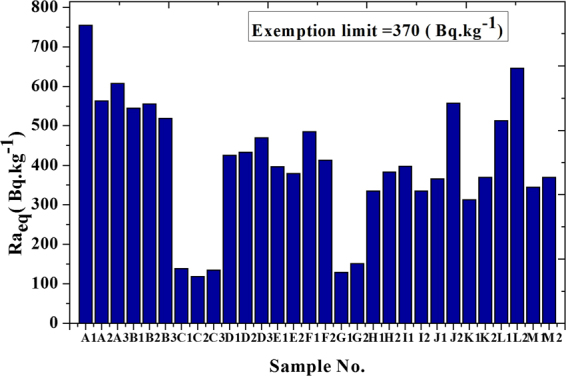
Radium equivalent for different samples.
Figure 11.
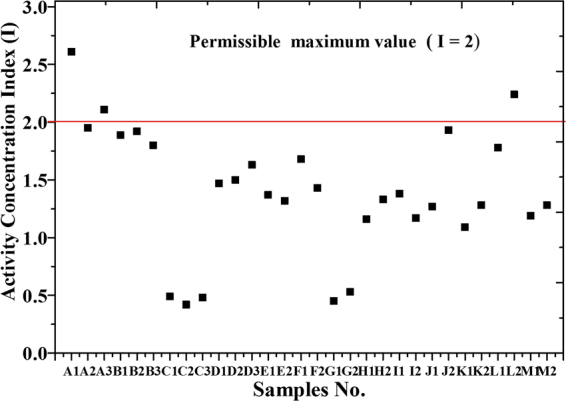
Activity concentration indices for different samples.
Figure (12) shows the outdoor absorbed gamma dose rate (Dout). It was ranged between 55.51 to 345.95 with an average of 186 nGy.h−1 which leads to effective outdoor gamma dose rate (Eout) ranged between 0.07 to 0.42 with an average of 0.23 mSvyr−1 which represented more than 3 times higher than the world’s average of 0.07 mSv.yr−1. The outdoor absorbed gamma dose rate was within the range as reported by UNSCEAR-2010 to Nile Delta region which met 20–400 nGy.h−1 as shown in the Table (3) in which a comparison between some high background radiation areas among the world was reported.
Figure 12.
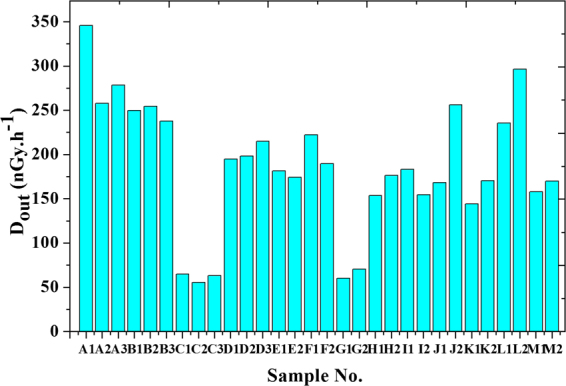
Outdoor absorbed dose for different samples.
Table 3.
A comparison of our study with other studies of black sand beaches22.
| Country | Area | Area Characteristics | Absorbed dose rate in air (nGy.h−1) |
|---|---|---|---|
| Brazil | Guarapari | Monazite sands; coastal areas | 90–170 (streets) 90–90000 (beaches) 110–1 300 |
| China | Yangjiang Quangdong | Monazite particles | 370 average |
| India | Kerala Ganges Delta | Monazite sands, | 200–4000 1800 average 260–440 |
| Egypt | Nile Delta | Monazite sands | 20–400 |
| Present study | North of Nile Delta | Monazite sands | 55.51–345.95 186 average |
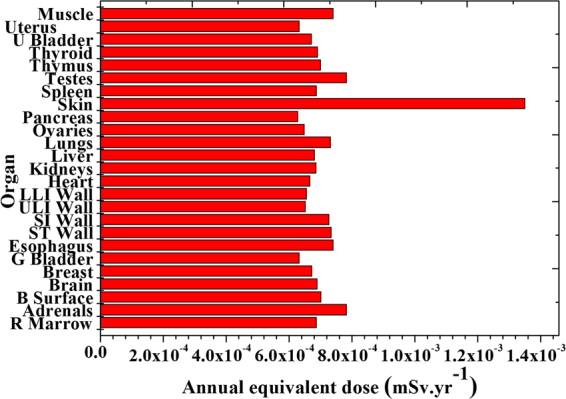
Table (4) shows total annual equivalent dose to different organs and effective dose due to exposure to the average value of the activity of all naturally occurring radionuclides (mSvyr−1) in black sand.
Table 4.
Annual equivalent dose and effective dose due to average activity (mSv.yr−1).
| Organ | 238U | 232Th | 40K | Summation |
|---|---|---|---|---|
| R Marrow | 3.33 × 10⁻⁸ | 5.81 × 10⁻⁷ | 6.87 × 10⁻⁴ | 6.87 × 10⁻⁴ |
| Adrenals | 2.31 × 10⁻⁸ | 5.07 × 10⁻⁷ | 7.82 × 10⁻⁴ | 7.83 × 10⁻⁴ |
| B Surface | 2.02 × 10⁻⁷ | 2.43 × 10⁻⁶ | 7.00 × 10⁻⁴ | 7.02 × 10⁻⁴ |
| Brain | 2.61 × 10⁻⁸ | 5.90 × 10⁻⁷ | 6.90 × 10⁻⁴ | 6.90 × 10⁻⁴ |
| Breast | 1.62 × 10⁻⁷ | 9.62 × 10⁻⁷ | 6.72 × 10⁻⁴ | 6.73 × 10⁻⁴ |
| G Bladder | 2.21 × 10⁻⁸ | 5.01 × 10⁻⁷ | 6.32 × 10⁻⁴ | 6.33 × 10⁻⁴ |
| Esophagus | 1.60 × 10⁻⁸ | 4.44 × 10⁻⁷ | 7.39 × 10⁻⁴ | 7.40 × 10⁻⁴ |
| ST Wall | 2.99 × 10⁻⁸ | 5.87 × 10⁻⁷ | 7.34 × 10⁻⁴ | 7.35 × 10⁻⁴ |
| SI Wall | 2.03 × 10⁻⁸ | 4.90 × 10⁻⁷ | 7.26 × 10⁻⁴ | 7.27 × 10⁻⁴ |
| ULI Wall | 2.29 × 10⁻⁸ | 5.21 × 10⁻⁷ | 6.52 × 10⁻⁴ | 6.52 × 10⁻⁴ |
| LLI Wall | 2.17 × 10⁻⁸ | 5.10 × 10⁻⁷ | 6.55 × 10⁻⁴ | 6.56 × 10⁻⁴ |
| Heart | 2.73 × 10⁻⁸ | 5.64 × 10⁻⁷ | 6.67 × 10⁻⁴ | 6.67 × 10⁻⁴ |
| Kidneys | 3.54 × 10⁻⁸ | 6.07 × 10⁻⁷ | 6.85 × 10⁻⁴ | 6.86 × 10⁻⁴ |
| Liver | 3.01 × 10⁻⁸ | 5.98 × 10⁻⁷ | 6.80 × 10⁻⁴ | 6.81 × 10⁻⁴ |
| Lungs | 3.57 × 10⁻⁸ | 6.73 × 10⁻⁷ | 7.31 × 10⁻⁴ | 7.32 × 10⁻⁴ |
| Ovaries | 1.99 × 10⁻⁸ | 4.72 × 10⁻⁷ | 6.49 × 10⁻⁴ | 6.49 × 10⁻⁴ |
| Pancreas | 1.86 × 10⁻⁸ | 4.78 × 10⁻⁷ | 6.27 × 10⁻⁴ | 6.28 × 10⁻⁴ |
| Skin | 5.42 × 10⁻⁷ | 1.59 × 10⁻⁶ | 1.35 × 10⁻³ | 1.35 × 10⁻³ |
| Spleen | 2.93 × 10⁻⁸ | 5.98 × 10⁻⁷ | 6.87 × 10⁻⁴ | 6.87 × 10⁻⁴ |
| Testes | 1.25 × 10⁻⁷ | 8.76 × 10⁻⁷ | 7.82 × 10⁻⁴ | 7.83 × 10⁻⁴ |
| Thymus | 3.62 × 10⁻⁸ | 6.41 × 10⁻⁷ | 7.00 × 10⁻⁴ | 7.00 × 10⁻⁴ |
| Thyroid | 4.45 × 10⁻⁸ | 6.44 × 10⁻⁷ | 6.90 × 10⁻⁴ | 6.91 × 10⁻⁴ |
| U Bladder | 2.90 × 10⁻⁸ | 5.67 × 10⁻⁷ | 6.72 × 10⁻⁴ | 6.72 × 10⁻⁴ |
| Uterus | 1.92 × 10⁻⁸ | 4.78 × 10⁻⁷ | 6.32 × 10⁻⁴ | 6.33 × 10⁻⁴ |
| Muscle | 8.65 × 10⁻⁸ | 7.39 × 10⁻⁷ | 7.39 × 10⁻⁴ | 7.40 × 10⁻⁴ |
| h_rem | 8.07 × 10⁻⁸ | 7.22 × 10⁻⁷ | 7.34 × 10⁻⁴ | 7.35 × 10⁻⁴ |
| E | 6.51 × 10⁻⁸ | 6.93 × 10⁻⁷ | 7.26 × 10⁻⁴ | 7.27 × 10⁻⁴ |
| Min | 1.60 × 10⁻⁸ (Esophagus) | 4.44 × 10⁻⁷(Esophagus) | 6.27 × 10⁻⁴(Pancreas) | 6.28 × 10⁻⁴(Pancreas) |
| Max | 5.42 × 10⁻⁷ (Skin) | 2.43 × 10⁻⁶(B-Surface) | 1.35 × 10⁻³(Skin) | 1.35 × 10⁻³ (Skin) |
Figure (13) investigate the annual equivalent dose to different organs due to the average value of activity concentrations of all-natural radionuclides it was ranged between 6.28E-4 (received by the pancreas) and 1.35E-3 mSv.yr−1 (received by skin).
Figure 13.
Total equivalent dose to different organs.
Discussion
Results show that some locations lead to over-exposure, for example, external hazard indices (Hex) in some samples more than unity then it exceeds the upper limit of exposure. Also, radium equivalent activities (Raeq) in the same locations were higher than the exemption limits (370 Bq.kg−1). While activity concentration indices (I) slightly exceed the permissible limits which met only 0.3 mSv.yr−1. Outdoor absorbed gamma dose rate (Dout)was ranged between 55.51 to 345.95 with an average of 186 nGy.h−1 which leads to effective outdoor gamma dose rate (Eout) ranged between 0.07 to 0.42 with an average of 0.23 mSvyr−1 which represented more than 3 times higher than the world’s average of 0.07 mSvyr−1. The outdoor absorbed gamma dose rate was within the range as reported by UNSCEAR-2010 to Nile Delta region which met 20–400 nGy.h−1.
In general, it can be concluded that exposure in these areas was still within the permissible limits due to the little time of exposure as these areas are beaches that intended for hiking. Outdoor Excessive Lifetime Cancer Risk (ELCRout) is found to be ranged between 0.24 × 10⁻³−1.49 × 10⁻³ with an average of 0.8 × 10⁻³ which is 2.8 times more than the upper limits 0.29 × 10⁻³. It can be noticed that ELCRout in all samples is greater than the upper recommended levels.
Annual equivalent dose due to average concentrations of all-natural radionuclides was ranged between 6.28E-4 (received by the pancreas) and 1.35 × 10⁻³ mSvyr−1 (received by skin). Average effective dose due to exposure to all radionuclides was 7.27 × 10⁻⁴ mSvyr−1. It can be concluded that radiological hazard due to external exposure to different organs or tissues were within the international permissible values.
Material and Methods
About 30 samples were collected from north of Nile Delta near Rosetta beach parallel to the Mediterranean coast. This region is an open area, flat and nearly horizontal15. Samples were dried at 105 °C for 12 hours to completely remove residual moisture. About 500 g of each sample was mixed thoroughly, weighed and filled in a polyethylene jar with a screw cover and perfectly sealed with adhesive tapes to make them airtight. These containers were stored for one month at room temperature to allow secular equilibrium between 226Ra and its progenies to be achieved before gamma spectroscopy. For Gamma spectrometry a P-type coaxial HPGe detector, Canberra model No., CPVD 30–3020, shielded by 10 cm Pb thickness, 1 mm Cd and 1 mm Cu, with a relative efficiency of 30% and a resolution full width at half maximum (FWHM) of 1.9 keV at 1.33 MeV (with associated electronics) connected to multi-channel analyzer (MCA) and coupled with software program Genie 2000, was used. This detector is of high efficiency and has high resolution, and very low background, that it is important to get an estimate of the detection limits and the minimum detectable activity.
Efficiency calibration
The efficiency calibration must perform in the same geometry as used in the actual measurements. Efficiency calibration curve was done by using standard calibration sources (powder) produced by IAEA of 238U (RGU-1), with 400 ppm concentration, 1.78 density and activity 4.9 Bq/gm and 232Th (RGTh-1), with 800 ppm, 1.71 density and activity 3.26 Bq/gm were poured to the similar plastic jar up to the same height as sample. Pure silica was also poured to similar jar up to the same height as a sample. The energy calibration in 63.9–2614 keV was performed using the same standard sources. Determination of NORM was measured using different daughters that emit clear Gamma peaks of high intensity to confirm the attainment of radioactive secular equilibrium within the samples between 226Ra and its daughters. This was carried out by measuring 226Ra directly through the 186.2 keV and indirectly by measuring the 214Bi (609.3, 1120.2 and 1764.5 keV) and 214Pb (351.9 keV) photopeaks. 232Th was determined through 228Ac (911.2 keV) 212Pb (238.6 keV after subtracting 241.2 value) and 208Tl (2614 keV) photopeaks, and estimation of 40K through the 1460.8 keV photopeak. Samples and background were measured for about 6 hours for each.
Variation in uranium isotopic ratio 235U/238U
Identification of 235U concentration is difficult as its natural abundance concentration is low (only 0.72%) of natural uranium. The energy of 185.7 keV is the most intense gamma-ray line associated with the presence of 235U (57%). This is very close to the energy of 186.2 keV associated with the decay of 226Ra to 222Rn in 238U chain. Overlapping may occur during measurement. Due to the relatively lower branching ratios of 143.76 keV (10.96%), 163.33 keV (5.08%) and 205.31 keV (5.01%) energy transitions comparing to that of the 185.7 keV energy transition, they are not commonly used to determine 235U in black sand samples. They counting rates due their expected counting rate would be below the detection limits ranges for the HPGe detector. So it is more practical to use the 185.7 keV energy transition to assess the 235U. Therefore, the concentration of 235U was calculated by subtracting the fraction of 226Ra using the following equation,:19,20
| 1 |
where CR187 is the count rate of the peak centered at 187 keV, εPeak is the detector efficiency at that energy, M is the mass of the sample (kg), Iγ (226Ra) is the gamma-ray emission fraction for 226Ra, Iγ (235U) is the gamma-ray emission fraction for 235U, AC (226Ra) is the activity concentration of 226Ra in the sample (Bq.kg−1) based on the average of the 214Bi and 214Pb analyses, and 235U is the concentration of 235U in the sample (Bq.kg−1)21.
External and internal hazards calculations
External Hazard Index (Hex)
It is obtained from Raeq expression which indicates that the maximum allowable value (equal to unity) corresponds to the upper limit of Raeq (370 Bq.kg−1). This value must be less than unity in order to minimize the radiation hazard, i.e., the radiation exposure must be limited to 1.0 mSv.yr−1, then the external hazard index (Hex) is given by the following equation:
| 2 |
Where C Ra, C Th and CK are the concentration in (Bq.kg−1) of 226Ra232, Th and 40K respectively22,23.
Radium Equivalent Activity (Req)
External hazard index (Hex) can be calculated by another method as expression called radium equivalent activity Raeq for comparing the specific activity of materials containing different amounts of 226Ra232, Th and 40K. It is based on the fact that 370 (Bqkg−1) of 226Ra, 259 (Bqkg−1) of 232Th and 4810 (Bqkg−1) of 40K, produce the same γ-ray dose equivalent. It is defined by the following expression17,24:
| 3 |
Activity Concentration Index (I)
The activity concentration index should be used for identifying materials which might be of concern. It is used to present investigation levels in the form of an activity concentration index, (I), or shortly, gamma index (I), and it is defined as follows25:
| 4 |
The maximum value for activity concentration index is 2 (I ≤ 2) to meet 0.3 mSvyr−1dose criterion and I ≤ 6 to meet 1 mSvyr−1 26,27.
Alpha Index (I α ):
The alpha index is used to assess the excess alpha radiation internal exposure caused by inhalation of naturally occurring radionuclides. When the activity concentration of 226Ra exceeds a value of 200 Bqkg−1, it is possible that the radon exhaled from this material met a concentration of 200 Bqm−3. Many countries of the world suggested the exemption level and upper level of 226Ra activity of 100Bqkg−1 and 200 Bqkg−1 respectively28.
Outdoor Absorbed Gamma Dose Rate (D out ):
The outdoor absorbed gamma dose rate (Dout) at 1 meter above the ground surface due to uniformly distributed natural radionuclides can be calculated as follows29,30:
| 5 |
Annual Outdoor Effective Dose (E out ):
Annual outdoor effective dose (Eout) can be calculated from the dose rate (Dout), about 20% of 8760 hours in a year can be considered as time of stay in the outdoor and for converting absorbed dose in air to effective dose a factor of 0.7 SvGy−1 was used, and can be calculated as follow31:
| 6 |
Excessive Lifetime Cancer Risk (ELCR):
Outdoor Excess Lifetime Cancer Risk (ELCRout) is calculated from outdoor annual effective dose according to the following equation18:
| 7 |
Where LE represents the life expectancy (70 years) and RF represents the fatal risk factor per Sievert (Sv−1). ICRP-6032 uses RF values of 0.05 for the public in case of stochastic effects.
External Equivalent and Effective Dose to Organs or Tissues:
Organ doses due to external exposure were determined by Eckerman and Ryman (DFEXT-code)33. The coefficients in this software represent the dose per unit integrated exposure or the dose rate per unit concentration (Sv m3/sec Bq). So, activity concentrations were transformed from Bqkg−1 into Bqm−3.
Where the summation extends over the organs/tissues with explicit Wt, Wrem is the weighting factors for the remainder (0.2), and hrem is the committed dose equivalent per unit integrated exposure for the remainder tissues. hrem is given as:hrem = 1/5 ∑ ht.
From these coefficients, equivalent dose (Ht) to any organ from any radionuclide can be calculated as follows:
| 8 |
While the effective dose (E) can be calculated as follows:
| 9 |
Where:
-ht is the equNivalent dose in tissue (t) per unit integrated exposure (Sv m3/sec Bq),
-e is the effective dose per unit integrated exposure = ∑Wtht, using Wt from ICRP-60,
-C is the activity concentration in black sand (Bq/m3),
-T is the exposure time (8766 × 0.2 h/year).
Author Contributions
Fawzia Mubarak, M. Fayez-Hassan, N. A. Mansour, Talaat Salah Ahmed and Abdallah Ali wrote the main manuscript text and Abdallah Ali prepared Fig. 1–13.
Competing Interests
The authors declare that they have no competing interests.
Footnotes
Publisher's note: Springer Nature remains neutral with regard to jurisdictional claims in published maps and institutional affiliations.
References
- 1.Vasconcelos DC, et al. Modeling Natural Radioactivity in Sand Beaches of Guarapari, Espirito State, Brazil. World. Journal of Nuclear Science and Technology. 2013;3:65–71. [Google Scholar]
- 2.Danilo C. Vasconcelos et al. Determination of Uranium and Thorium Activity Concentrations Using Activation Analysis Beach Sands from Extreme South Bahia, Brazil”, International Nuclear Atlantic Conference 27 September – 2 October, Rio De Janeiro, Brazil (2009).
- 3.Sarojini V. Baseline Assessment of Dose due to Natural Radionuclides in Soils of Coastal Regions of Kanyakumari District in Tami Nadu, India. IOSR J. of Environ. Sci. Toxicology and Food Tech. 8(9), III, 1–4(2014).
- 4.Nada A, et al. Correlation between Radionuclides Associated with Zircon and Monazite in Beach Sand of Rosetta, Egypt. J. Radiation. Nucl. Ch. 2012;291:601–610. doi: 10.1007/s10967-011-1430-2. [DOI] [Google Scholar]
- 5.Filippidis Anestis, et al. Mineral, Chemical and Radiological Investigation of A black Sand at Touzla Cape, Near Thessaloniki, Greece. Environmental Geochemistry and Health. 1997;19:83–88. doi: 10.1023/A:1018498404922. [DOI] [Google Scholar]
- 6.Shetty PK, Narayana Y, Rajashekara KM. Depth Profile Study of Natural Radionuclides in the Environment of Coastal Kerala. J. Radioanal. Nucl. Ch. 2011;290:159–163. doi: 10.1007/s10967-011-1173-0. [DOI] [Google Scholar]
- 7.Santos IR, Burnett WC, Godoy JM. Radionuclides as Tracers of Coastal Processes in Brazil: Review, Synthesis and Perspectives. Brazilian Journal of Oceanography. 2008;56(2):115–131. doi: 10.1590/S1679-87592008000200004. [DOI] [Google Scholar]
- 8.VassasC. PourcelotL, et al. Mechanisms of Enrichment of Natural Radioactivity Along the Beaches of the Camargue, France. J. Environ. Radioactiv. 2006;91:146–159. doi: 10.1016/j.jenvrad.2006.09.002. [DOI] [PubMed] [Google Scholar]
- 9.Argyrios Papadopoulos, Antonios Koroneos, Georgios Christofides & Stylianos Stoulos. Natural Radioactivity Distribution and Gamma Radiation exposure of Beach sands Close to Maronia and Samthraki Plutons, NE Greece. Geological Balcanica. 43, 1–3, Sofia,p. 99–107(2014).
- 10.Papadopoulos Argyrios, et al. Natural Radioactivity and Radiation Index of the Major Grantic Plutons in Greece. Journal of Environmental Radioactivity. 2013;124:227–238. doi: 10.1016/j.jenvrad.2013.06.002. [DOI] [PubMed] [Google Scholar]
- 11.Papadopoulos Argyrios, Christofides Georgios, Koroneos Antonios, Stoulos Stylianos. Natural Radioactivity Distribution and Gamma Radiation Exposure of Beach Sands from Sithonia Peninsula, Cent. Eur. J. Geosci. 2014;6(2):229–242. [Google Scholar]
- 12.Harb s. Natural Radioactivity and External Gamma Radiation Exposure at Coastal Red Sea in Egypt. Radiat. Prot. Dosim. 2008;130:376–384. doi: 10.1093/rpd/ncn064. [DOI] [PubMed] [Google Scholar]
- 13.Tsuey-Lin T, Chi-Chang L, Chun-Yu C, Hwa-Jon W, Lee-Chung M. The Effects of Physico-Chemical Properties on Natural Radioactivity Levels, Associated Dose Rate and Evaluation of Radiation Hazard in The Soil of Taiwan Using Statistical Analysis. Journal of Radioanal. And Nucl. Ch. 2011;288(3):927–936. doi: 10.1007/s10967-011-1032-z. [DOI] [Google Scholar]
- 14.Jabbar A, et al. Measurement of Soil Radioactivity Levels and Radiation Hazard Assessment in Mid Rechna Interfluvial Region, Pakistan. Journal of Radioanalytical and Nuclear Chemistry. 2010;283:371–378. doi: 10.1007/s10967-009-0357-3. [DOI] [PubMed] [Google Scholar]
- 15.Attiah A.M. Environmental Assessment of Rosetta Area, Mediterranean Sea Coast – Egypt, MS.D. Thesis. Fac. Sci., Zagazig University. Egypt (2011).
- 16.Mohanty AK, Sengupta D, Das SK, Vijayan V, Saha SK. Natural Radioactivity in the Newly Discovered High Background Radiation Area on the Eastern Coast of Orissa, India. Radiation Measurements. 2004;38:153–165. doi: 10.1016/j.radmeas.2003.08.003. [DOI] [Google Scholar]
- 17.UNSCEAR. Sources and Effects of Ionizing Radiation United Nations Scientific Committee on the Effects of Atomic Radiation. United Nations Publication, New York, USA (2010).
- 18.Shittu HO, et al. Determination of the Radiological Risk Associated with Naturally Occurring Radioactive Materials (NORM) at Selected Quarry Sites in Abuja, FCT. Nigeria: Using Gamma-Ray Spectroscopy. Physics Journal. 2015;1(2):71–78. [Google Scholar]
- 19.Wahl, W. Radionuclide Handbook for Laboratory Workers in Spectrometry, Radiation Protection and Medicine”, Germany: ISUS (2007).
- 20.NNDC. National Nuclear Data Center http://www.nndc.bnl.gov [Updated November 2016].
- 21.Powell BA, et al. Elevated concentrations of primordial radionuclides insediments from the Reedy River and surrounding creeks in Simpsonville, South Carolina. Journal of Environmental Radioactivity. 2007;94:121–128. doi: 10.1016/j.jenvrad.2006.12.013. [DOI] [PubMed] [Google Scholar]
- 22.Eissa MF, Mostafa RM, Shahin F, Hassan KF, Saleh ZA. Natural Radioactivity of Some Egyptian Building Materials. Int. J. Low Radiation. 2008;5(1):1–8. doi: 10.1504/IJLR.2008.018812. [DOI] [Google Scholar]
- 23.Attia, T. E., Shendi, E. H., & Shehata, M. A. Assessment of Natural and Artificial Radioactivity Levels and Radiation Hazards and their Relation to Heavy Metals in the Industrial Area of Port Said City, Egypt. J Earth Sci Clim Change. 1–11(2014). [DOI] [PubMed]
- 24.Xhixha, G., et al. First Characterization of Natural Radioactivity in Building Materials Manufactured in Albania. Radiation Protection Dosimetry. 1–7 (2013). [DOI] [PubMed]
- 25.Todorovic N, et al. Natural Radioactivity in Raw Materials Used in Building Industry in Serbia. Int. J. Environ. Sci. Technol. 2015;12:705–716. doi: 10.1007/s13762-013-0470-2. [DOI] [Google Scholar]
- 26.European Commission (EUC) Radiological Protection Principles Concerning the Natural Radioactivity of Building Materials, European Commission, Radiation Protection. 1999;112:4–16. [Google Scholar]
- 27.Nisha Sharma, Singh Jaspal, Esakki SChinna, Tripathi RM. A Study of The Natural Radioactivity and Radon Exhalation Rate in Some Cements Used in India and Its Radiological Significance. Journal of Radiation Research and Applied Sciences. 2016;9:47–5 6. doi: 10.1016/j.jrras.2015.09.001. [DOI] [Google Scholar]
- 28.Raghu Y, Harikrishnan N, Chandrasekaran A, Ravisankar R. Assessment of Natural Radioactivity and Associated Radiation Hazards in Some Building Materials Used in Kilpenathur, Tiruvannamalai Dist, Tamilnadu, India. African Journal of Basic & Applied Sciences. 2015;7(1):16–25. [Google Scholar]
- 29.Shams AM, Issa, Alaseri SM. Determination of Natural Radioactivity and Associated Radiological Risk in Building Materials Used in Tabuk Area, Saudi Arabia, Inter. J. of Advanced and Technology. 2015;82(5):45–62. [Google Scholar]
- 30.Abd El Wahab M, El Nahas HA. Radionuclides Measurements and Mineralogical Studies on Beach Sands, East Rosetta Estuary, Egypt. Chin.J. Geochem. 2013;32:146–156. doi: 10.1007/s11631-013-0617-3. [DOI] [Google Scholar]
- 31.Masila Xolani. Radioactive Nuclides in Phosphogypsum from the Lowveld Region of South Africa. S. Afr. J. Sci. 2016;112(1/2):1–5. [Google Scholar]
- 32.ICRP. International Commission on Radiological Protection, “The Recommendations of the Commission,” ICRP Publication 60, Annals of the ICRP, 21(1–3) (1991a) (Pergamon Press, New York). 3, 295–302 (1990). [PubMed]
- 33.Eckerman, K. F. & Ryman, J. C. External Exposure to Radionuclides in Air, Water, and Soil. Federal Guidance Report No. 12, EPA Report 402-R-93–081 (Washington, DC) (1993).


