

Abstract

Marine phlorotannins (PhT) from Laminaria digitata might protect feed proteins from ruminal digestion by formation of insoluble non-covalent tannin–protein complexes at rumen pH (6–7). Formation and disintegration of PhT–protein complexes was studied with β-casein (random coil) and bovine serum albumin (BSA, globular) at various pH. PhT had similar binding affinity for β-casein and BSA as pentagalloyl glucose, as studied by fluorescence quenching. The affinity of PhT for both proteins was independent of pH (3.0, 6.0, and 8.0). In the presence of PhT, the pH range for precipitation of tannin–protein complexes widened to 0.5–1.5 pH units around the isoelectric point (pI) of the protein. Complete protein resolubilization from insoluble PhT–protein complexes was achieved at pH 7 and 2 for β-casein and BSA, respectively. It was demonstrated that PhT modulate the solubility of proteins at neutral pH and that resolubilization of PhT–protein complexes at pH deviating from pI is mainly governed by the charge state of the protein.
Keywords: phlorotannins, complexation, pH, reversibility, solubility
Introduction
With the current increase in world population and need for alternative food and feed resources, seaweeds might provide opportunities. In coastal areas, seaweeds are already consumed by cattle, and the application of seaweeds into ruminant feed has potential.1 Brown seaweeds can provide high-value proteins, rich in essential amino acids lysine and methionine.1 When seaweed is used, as either a dried product or protein-enriched extract, phlorotannins (PhT) are part of the matrix.
PhT are marine tannins, built from phloroglucinol monomers (1 in Figure 1), interlinked via carbon–carbon or ether linkages (2 in Figure 1). The PhT in Laminaria digitata have been fully characterized up to a molar mass of over 3 kDa.2 There are, however, indications that PhT can be larger.3
Figure 1.
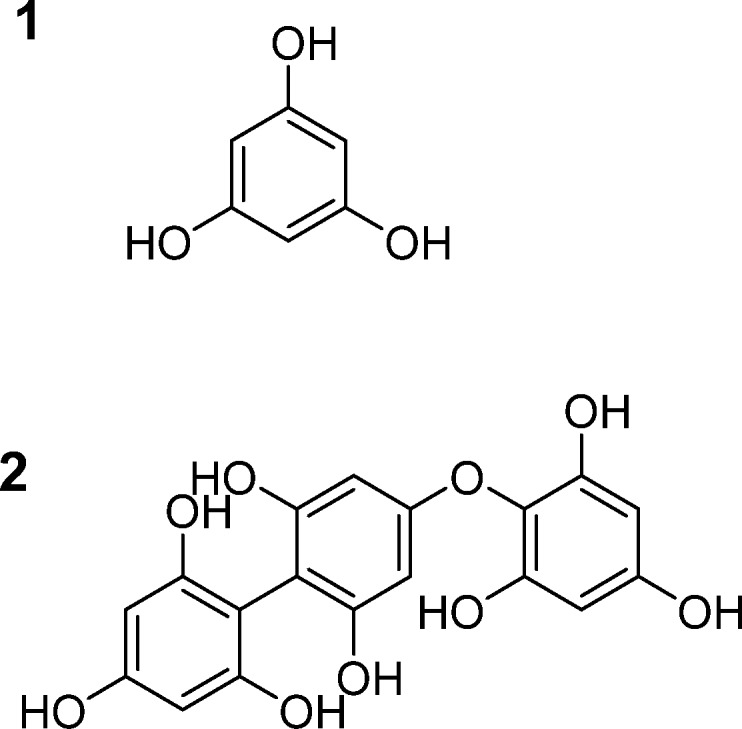
(1) Phloroglucinol, the building block of PhT, and (2) representative phloroglucinol trimer, in which the phloroglucinol subunits are connected via C–C and C–O–C bonds.
Interactions between (marine) tannins and proteins have been regularly studied by different techniques.4,5 Of both terrestrial and marine tannins, it is known that they can bind non-covalently to proteins,6,7 the interaction of which is hydrophobically driven.8 Tannins bind mainly to proline residues,9,10 via CH−π stacking.10 The connections are then reinforced by hydrogen bonds between carbonyl oxygens of the peptide bonds, flanking the proline residue, and the phenolic hydroxyl groups of the tannin.10 The resulting complexes can be either water-soluble or water-insoluble. Insoluble complex formation can occur at high tannin/protein ratios.10 Additionally, an increased molecular weight of the tannin (up to ∼3000 Da),9 a molecular flexibility of both the tannin and protein,5 and a pH close to the isoelectric point (pI) of the protein favor precipitation of complexes.11,12 It should be noted that, besides non-covalent interactions, there are also indications for covalent interactions between PhT and proteins.7
In the digestive system of ruminants, tannins can affect protein fermentation. At low doses, tannins are reported to have beneficial effects, limiting dietary protein fermentation and increasing the flow of dietary protein to the abomasum of ruminants.13 In low-protein diets and at high-tannin doses, toxicity and negative effects on overall protein utilization by the ruminant have been reported.14 Within the rumen, the pH is around 6.8. At this pH, tannins and proteins can form insoluble complexes, as a result of which the proteins are protected from microbial degradation. The insoluble complexes migrate to the abomasum, where the acidic environment (pH 2–3) is thought to weaken12,15 the tannin–protein interactions and allows further protein hydrolysis.16
Often, the effects of tannins on ruminal fermentation are tested in vitro. During these in vitro fermentations, protein-rich feeds and tannins are combined. As control experiments, feeds are incubated with tannins and polyethylene glycol (PEG). PEG was found to effectively bind tannins, as determined by turbidity measurements, and the application of PEG reverted the effect of tannins during in vitro ruminal fermentation.17 In earlier research,15 the reversibility of the tannin–protein binding was investigated at different pH values, to simulate the different pH regimes in the digestive tract of the ruminant. The researchers showed that protein resolubilized from insoluble tannin–protein complexes prepared at pH 6.5 upon a decrease in pH in the presence of PEG. It is, however, unclear whether the protein resolubilization is an effect of the presence of PEG or the change in pH.
The properties of proteins are influenced by pH. At their pI, proteins have zero net charge and a lack of electrostatic repulsion,18 often resulting in low solubility. Away from the pI, the net charge of the proteins increases, resulting in enhanced protein solubility as a result of electrostatic repulsion. In the absence of tannins, proteins precipitate in a range of ∼0.5 pH unit around their pI.19 In the presence of tannins, the pH range for precipitation of tannin–protein complexes widens to 1–1.5 pH units around the pI of the protein.11,20 The more distant the pH is from the pI, the more charged the proteins become, as a result of which the tannin–protein complex might become water-soluble. In the presence of PEG, it is expected that tannins preferentially bind to PEG instead of protein, and the pH range for protein precipitation is similar to that without tannin, i.e., pI ± ∼0.5. The wider pH range for protein precipitation by tannins is assumed to explain the protective effect against proteolysis during ruminal fermentation. Important proteins in ruminant feed originate from grass and soy, which have wide pI ranges from 4.5 to 7.21,22 The pH conditions, where no protein resolubilization from the insoluble tannin–protein complex was observed previously,15 correlated to pI values of the feed proteins. Little is known about the behavior of PhT in relation to protein binding and its reversibility as affected by pH.
The aim of this study was to (i) determine the pH dependency of PhT to protein binding and (ii) to map the resolubilization of protein from PhT–protein complexes as a function of pH in the absence and presence of PEG. On the basis of the knowledge on terrestrial tannin–protein binding mechanisms and protein charge effects in relation to pH, it is hypothesized that PhT will bind to proteins in a manner similar to terrestrial tannins and that their binding affinities are independent of pH. The solubility of PhT–protein complexes in relation to pH is hypothesized to be related to the charge state of the protein. Despite the presence of PhT, protein solubility increases when pH ≪ pI or pH ≫ pI and tannin–protein complexes can resolubilize. This would imply that PhT might be used to protect feed proteins from rumen degradation without hampering protein resolubilization and digestion further down the digestive tract.
The experiments were conducted using β-casein, a random coil protein, because this has been shown to be a good phenolic-binding protein.23 In addition, bovine serum albumin (BSA), a model for globular proteins, was chosen because of its known binding of phenolics and its physiological function as a transport protein.24 Both proteins have a similar pI value, i.e., 5.123 and 4.9,25 for β-casein and BSA, respectively.
Materials and Methods
Materials
Bovine β-casein (98%, w/w), BSA (96%, w/w), and pentagalloyl glucose (PGG, 96%, w/w) were obtained from Sigma-Aldrich (St. Louis, MO, U.S.A.). Kelp powder (L. digitata) was obtained from Bristol Botanicals (Bristol, U.K.). Organic solvents used were of ultra-high performance liquid chromatography–mass spectrometry (UHPLC–MS)-grade and obtained from Biosolve BV (Valkenswaard, Netherlands). Water was obtained from a Milli-Q system (Millipore, Billerica, MA, U.S.A.). All other chemicals were obtained from Sigma-Aldrich or Merck (Darmstadt, Germany).
PhT Extraction
L. digitata powder was extracted as described previously.2 The final extracted material was denoted as PhT extract solution.
Normal-Phase (NP) Flash Chromatography
The PhT extract obtained was 60% (w/w) pure, as determined using several quantification assays.2,26 To remove impurities, the extract was subjected to fractionation by NP flash chromatography as described previously.2 PhT fractions eluting between 11 and 20 min were free from pigments [annotated by reversed-phase ultra-high performance liquid chromatography–ultraviolet–mass spectrometry (RP-UHPLC–UV–MS)] and high-molecular-weight sugars [annotated by matrix-assisted laser desorption/ionization–time-of-flight–mass spectrometry (MALDI–TOF–MS)]. These fractions were pooled and used for further experimentation. These fractions contained approximately 90% (w/w) PhT.
Fluorescence Quenching Assay
Non-covalent tannin–protein binding was studied by fluorescence quenching, using the intrinsic fluorescence of tryptophan residues. The tryptophan emission around 350 nm27 is quenched by binding of ligands. Sodium phosphate buffers (10 mM) of pH 3.0, 6.0, and 8.0 were prepared by mixing 10 mM Na2HPO4 and 10 mM NaH2PO4 solutions to obtain the set pH values. Protein stock solutions of either 20 μM β-casein or BSA were prepared at pH 8.0. For measurements at pH 6.0 and 3.0, pH of the protein solution was adjusted by the addition of 0.5 M HCl. After the pH adjustments, protein concentrations were further diluted to 10 μM using the buffers at the respective pH values. Exact protein concentration was determined using molar absorption at 280 nm, and molar extinction coefficients of 11.4 mM–1 cm–1 23 and 43.8 mM–1 cm–1 28 for β-casein and BSA, respectively, were used. Tannin solutions were prepared by dissolving a PhT flash fraction (1 g/L) in 10 mM sodium phosphate buffer at pH 8.0, 6.0, and 3.0 containing 10% (v/v) methanol. These were further diluted in the same buffers to obtain concentration ranges from 0 to 0.1 g/L. PGG solutions (1 mM) were prepared in the three buffers, mentioned above, and subsequently diluted to obtain concentration ranges from 0 to 100 μM. Higher tannin concentrations were also tested in fluorescence quenching experiments. These higher concentrations, however, resulted in the formation of insoluble complexes and could not be used in the quenching experiments because it would result in light scattering.
Quenching experiments were performed in Sterilin black microtiter plates (Thermo Scientific, San Jose, CA, U.S.A.). For determination of the binding curves, 100 μL of protein solution was mixed with 100 μL of tannin solution, in triplicate. These mixtures were incubated for 10 min in the dark at 25 °C under continuous shaking at 300 rpm, using a thermomixer (Eppendorf, Hamburg, Germany). Intrinsic protein fluorescence was measured in a SpectraMax M2e microplate reader (Molecular Devices, Sunnyvale, CA, U.S.A.) at 25 °C, with λex = 280 nm and λem = 300–600 nm with 10 nm bandwidth.
The fluorescence signal measured was not affected by fluorescence resonance energy transfer (FRET). FRET occurs when there is spectral overlap between the emission spectrum of the donor (tryptophan in protein) and the absorbance spectrum of the acceptor (tannins).29 There is hardly overlap between the emission spectrum of proteinaceous tryptophan and PhT (Figure S1 of the Supporting Information). It is, therefore, assumed that FRET plays a minor role. The absorbance spectrum of PGG showed overlap with the emission spectrum of proteinaceous tryptophan (Figure S1 of the Supporting Information). An additional parameter for FRET occurrence is the Förster radius (R0). FRET often becomes important when this radius is <10 nm.30R0 for protein and PGG was estimated as described previously,4,27 using a molar extinction coefficient of 10.6 mM–1 cm–1.31R0 was estimated to be 21.09 nm. With this R0, FRET was expected not to affect the outcome of the quenching experiments.
When fluorescence quenching was performed, inner filter effects related to absorbance of the ligand in both the excitation and emission wavelengths were corrected when necessary.29 Corrections were performed using eq 1(4,32)
| 1 |
in which Fcorr is the corrected fluorescence intensity, Fobs is the observed fluorescence intensity at emission wavelength, Aex and Aem are the absorbances measured at excitation and emission wavelengths, respectively, and dex and dem refer to the relative path lengths in excitation and emission directions, respectively. The actual path length is a physical parameter related to the equipment and determined according to the manual of the supplier,33 using the pH 8.0 buffer. The path length was determined to be 0.05 cm and assumed to be equal for both dem and dex.
After correction, data were analyzed using least squares regression analysis with a 1:1 binding model assuming the formation of a non-fluorescent protein–tannin complex using eq 2(4,29)
| 2 |
in which [PT] is the molar concentration of the tannin–protein complex, [P] is the molar protein concentration, [T] is the molar tannin concentration, and Kd is the dissociation constant. The association constant Ka equals 1/Kd and is presented in the Results and Discussion to facilitate the comparison between our data and literature data. The derivation of the model has been described previously.4
Because the exact molar weight of the PhT mixture was not known, an apparent Ka (Ka-app) was determined under the assumption of an average PhT molecular weight (MW) of 2000 Da. The MW was estimated on the basis of our previous UHPLC–MS and MALDI–TOF–MS analysis of the relative abundancies of the different sizes. The maximum MW determined was 3348 Da (DP27).2
Protein Precipitation Assay
Sodium phosphate buffers (10 mM) of pH 3.0, 4.0, 5.0, 6.0, 6.5, 7.0, and 8.0 were prepared as described above, and the procedure was based on a method developed previously.20 The PhT flash fraction (10 g/L in methanol) was diluted up to 1 g/L in the different buffers. β-Casein and BSA were each dissolved in water at 2 g/L. To induce complexation, 1 mL of buffer, 1 mL of protein solution, and 1 mL of PhT solution were mixed in a glass tube and incubated at room temperature for 15 min. Final pH was measured after complexation and, to avoid dilution, not adjusted when changes occurred. In those cases, the actual pH values are provided in the Results and Discussion. The tubes were centrifuged (4000g for 10 min at 20 °C). The PhT content in the supernatants was assayed using a colorimetric 2,4-dimethoxybenzaldehyde (DMBA) assay,2,26 using a PhT concentration of 0–0.8 g/L for the calibration curve.
Reversibility of PhT–Protein Binding
The release of protein from the PhT–protein complex was determined on the basis of a previously described protocol,15 with adaptations. Briefly, 2 g/L BSA or 1 g/L β-casein solution in 10 mM sodium phosphate buffer (pH 6.0) were prepared. Of these solutions, 1 mL was mixed with 0.1 mL (for BSA) or 0.05 mL (for β-casein) PhT extract (10 g/L in methanol). Controls of only protein were used as well. The mixtures were incubated for 24 h at 39 °C and then centrifuged (10000g for 5 min at 20 °C). The supernatant was carefully removed with a pipet. For the first series, PEG (10 mg) was added as a powder to the pellet and mixed with 1 mL of 10 mM sodium phosphate buffer of various pH values (pH 2.0–8.5). For the second series, only buffers were used. The mixtures were incubated for 2 h at 39 °C and 500 rpm using a thermomixer (Eppendorf) and centrifuged (10000g for 5 min at 20 °C). The protein content in the supernatant was determined using the Dumas method with a Flash EA 111 NC analyzer (Thermo Fisher Scientific, Waltham, MA, U.S.A.) according to the protocol of the manufacturer. Nitrogen conversion factors were 6.37 and 6.08 for β-casein and BSA, respectively. The factors were calculated on the basis of the amino acid sequences. Because only 75% of the initial protein present precipitated, the resolubilization of BSA from the precipitate was corrected for protein loss in the supernatant. For β-casein, all of the proteins precipitated and no corrections were required. The percentage of protein resolubilized into solution was calculated using eq 3
| 3 |
in which Pr, Ps, and Pp represent the amounts of protein (mg) resolubilized, present in solution after resolubilization, and present in the initial pellet, respectively. The PhT content in the supernatants was determined colorimetrically, as described above.
Interactions between proteins and PEG were determined using fluorescence quenching, as described above. Determination was performed at pH 7.0 for PEG/protein weight ratios of 0.5, 1, 2, 4, 8, 16, and 32.
Results and Discussion
Binding of PhT and PGG
The binding behavior of PhT (polydisperse mixture with estimated average MW of 2000 Da) to β-casein and BSA was compared to that of PGG of 940 Da. PGG was chosen as hydrolyzable tannin, which is often used in tannin–protein binding studies.34 Binding was studied using fluorescence quenching at pH 8.0. The intensity of the tryptophan fluorescence emission spectra of both β-casein (Figure 2A) and BSA (Figure 2B) decreased upon the addition of tannins. For some tannins, shifts in maximum emission wavelength can occur upon binding to proteins,4 but this was not observed for the tannins tested. For comparison (panels C and D of Figure 2), modified Stern–Volmer plots are shown. Similar relationships have been obtained in other model systems using proteins combined with catechins,4 terrestrial condensed tannins,35 and hydrolyzable tannins.5 The binding parameters of the ligands (Ka for PGG and Ka-app for PhT) for both proteins at pH 8.0 are summarized in Table 1. For both proteins, binding affinities for PGG and PhT were in a similar order of magnitude and were in the range of binding affinities previously determined for both proteins using epigallocatechin gallate4 and PGG.9,34 BSA is a protein carrying hydrophobic sites with high binding affinity for hydrophobic and phenolic molecules, such as PGG.36 It has been determined previously that the flexibility of both protein and tannin is a determinant for binding strength.9 In the case of β-casein binding, both the protein and tannins, containing ester and ether bonds, which can rotate, find optimal orientation for binding.4
Figure 2.

Fluorescence emission spectra (λex = 280 nm) of (A) β-casein and (B) BSA quenched by an increasing tannin concentration. Stern–Volmer plots (λem = 350 nm) for binding of PhT (0–25 μM assuming an average MW = 2000 Da) (●) and PGG (0–50 μM) (□) to (C) β-casein and (D) BSA at pH 8.0.
Table 1. Summary of the Interactions (Ka) of PGG and PhT to β-Casein and BSA at Various pH Conditions, Determined Using Fluorescence Quenching.
|
Kaa (×104, M–1) |
|||
|---|---|---|---|
| ligand | pH | β-casein | BSA |
| PGG | 8.0 | 6.3 (±0.3) | 10.0 (±0.7) |
| PhTb | 8.0 | 8.8 (±0.2) | 10.1 (±0.3) |
| PhT | 6.0 | 7.9 (±1.8) | 17.0 (±2.6) |
| PhT | 4.0 | 5.5 (±0.4) | 9.3 (±0.2) |
Ka represents the tannin–protein association constant.
For PhT, Ka-app was determined assuming an average MW = 2000 Da.
Effect of pH on PhT–Protein Binding
With a decreasing pH, the emission maxima of BSA (Figure 3A) shifted from 345 nm at pH 6.0 and 8.0 to 355 nm at pH 3.0, in accordance with earlier observations.27,37 The Ka-app values (Table 1) showed no pH effect for binding of PhT to either β-casein (Figure 3B) or BSA (Figure 3C). For the occurrence of PhT–protein binding, it did not matter whether the protein had a net negative (pH > pI) or positive (pH < pI) charge, because binding affinities were in similar orders of magnitude and showed no trend. The results indicated that pH as such was not a significant contributor to affinity of PhT for proteins, in analogy to terrestrial tannins.38
Figure 3.

(A) Fluorescence spectra of BSA (λex = 280 nm) at pH 8 (−), pH 6.0 (- - -), and pH 3.0 (···). Stern–Volmer plots (λem = 350 nm) of (B) 5 μM β-casein and (C) 5 μM BSA quenched by an increasing PhT concentration (0–25 μM, assuming an average MW = 2000 Da) at pH 8 (●), pH 6 (□), and pH 3 (×).
Protein Precipitation by PhT
Because PhT–protein binding occurred at every pH, the effect of pH on the type of aggregate formed (soluble or insoluble) was studied. The formation of insoluble aggregates was studied by performing a precipitation assay.20 PhT were able to precipitate both β-casein and BSA completely, at pH conditions around the pI values of the proteins. Upon PhT addition, the initially transparent solutions turned turbid immediately, indicating rapid complexation.
β-Casein
β-Casein alone precipitated around its pI, whereas in the presence of PhT, the pH range at which this protein precipitated was broadened, as expected (Figure 4A). After complexation, 60–90% of initial PhT was still detected in the supernatant from pH 3.0 to 6.4 (Figure 4B), consistent with the range of protein precipitation. In all cases, supernatants were turbid. The turbidity of the supernatant indicated the presence of smaller complexes, which did not precipitate upon centrifugation.10
Figure 4.

Proportions (%) of (A and C) precipitated protein and (B and D) precipitated PhT (×) after precipitation of protein (□) or mixtures of PhT/protein (○) for (A and B) β-casein and (C and D) BSA as a function of pH. (- - -) pI of the proteins.
BSA
Without tannins, BSA was soluble over the entire pH range (Figure 4C), which has been observed previously.39 In the presence of PhT, complete protein precipitation occurred around pI. At pI, PhT co-precipitated with the protein for 78% (Figure 4D).
Protein Resolubilization
PhT and proteins were incubated at pH 6.0 and 39 °C for 24 h according to the method reported previously15 and to simulate the residence time of feed in the rumen. After 24 h, the suspensions were centrifuged. Subsequently, the insoluble PhT–protein complexes (pellets) were exposed to various lower pH conditions, in the absence and presence of PEG, to study resolubilization of these insoluble PhT–protein complexes. Because it was impossible to determine whether solubilized protein and PhT were still bound to each other, we prefer to speak of protein resolubilization rather than protein release.
Resolubilization in the Absence of PEG
When only protein was present in the solution, β-casein formed precipitates at pH 6.0, the majority of which remained insoluble upon a decrease in pH (Figure 5A). At pH 7, there was complete resolubilization. Unexpectedly, even at pH 2, only 4% of β-casein resolubilized. When only BSA was present in solution, no precipitates were formed during the initial incubation (data not shown). The resolubilization of β-casein was not significantly affected by the presence of PhT. At pH 7, there was complete resolubilization and all protein remained insoluble around pH 4–5, the pI of the proteins (Figure 5A). For the BSA/PhT combination (Figure 5B), there was no resolubilization at pH 4 and 5, around the pI of BSA. No protein remained insoluble at pH 2, whereas 57% BSA remained insoluble at pH 7.
Figure 5.

Protein (%) remaining in precipitation after resolubilization from precipitated β-casein (□) from PhT/protein combinations (○) and PhT/protein/PEG combinations (◇) for (A) β-casein and (B) BSA as a function of pH. In absence of tannins, BSA did not precipitate.
For both proteins, complete protein resolubilization was associated with minor PhT resolubilization, 24% for the PhT/β-casein combination and 12% for PhT/BSA. The tannins remained insoluble in fully aqueous solutions, as opposed to the 10% (v/v) methanolic buffers used to prepare the complexes.
Resolubilization in the Presence of PEG
To determine whether the protein resolubilization behavior was affected by PhT, the same experiments were performed but PEG was added to the protein/PhT combinations. The first control experiment was the determination of protein–PEG interactions by fluorescence quenching. The addition of PEG to protein did not result in quenching of the protein fluorescence signal (data not shown), indicating that the two do not interact. In the second control experiment, it was observed that the addition of PEG did not result in the formation of insoluble PEG–PhT complexes, because no pellet was formed upon centrifugation of the mixtures. It should be noted that the PhT concentration could no longer be quantified in the presence of PEG because reactivity toward the DMBA reagent decreased.
In the presence of PEG and tannins, the proteins resolubilized as a result of the high affinity of tannins for PEG. The extent of protein resolubilization depended upon the pH. For β-casein, there was a slightly higher resolubilization of β-casein from the PhT−β-casein complexes than in its absence (Figure 5A), 20 and 14% for pH 2 and 3, respectively. For BSA, PEG increased the protein resolubilization from PhT–BSA complexes with 28–67% from pH 3 to 7 (Figure 5B) without affecting the overall shape of the BSA solubility curve. Even around the pI of BSA, 30% protein resolubilized.
pH Affecting Protein Charge and Subsequent Resolubilization
The experiments showed that protein resolubilization and the effect of PhT are protein-dependent. The pH affects protein charge and therewith solubility. At pH 2, β-casein has a net positive charge of +22, while at pH 7, the protein has a net charge of −7.7.40 The high positive charge at low pH should in theory be sufficient for resolubilization because, at pH 7, the negative charge results in resolubilization (Figure 5A). It seems likely that the poor solubility of β-casein at low pH (Figure 4A) affected protein resolubilization, irrespective of the presence of PhT and/or PEG. At pH 3, BSA (mature protein) has a charge of +164, while at pH 7, the charge is only −29.40 The higher positive charge at pH 3 compared to the negative charge at pH 7 might result in higher protein solubility. The resolubilization of BSA is affected by PhT and/or PEG. Around the pI, PEG increases the proportion of resolubilized protein.
The results of the PEG treatment agree with a previous study.15 Despite PEG addition, not all proteins resolubilized and there were indications that covalent tannin–protein complexes were formed.7 When no complete protein resolubilization was achieved, it might be speculated that the strength of electrostatic repulsions within the protein were insufficient to bring large aggregates into solution.
Overall, our results show that the proteins resolubilize together with minor amounts of PhT, but our experiments are inconclusive about their actual release. In the presence of PEG, our results show that proteins indeed resolubilize more extensively. The addition of PEG is not required to assess protein resolubilization behavior, but its addition confirms that PhT is able to inhibit the resolubilization of proteins, until more extreme pH conditions are reached.
Extrapolation to Protein Protection and Digestion in Ruminants
With regard to the application of tannins in ruminal feed to act as protein-protecting agents, the various pH regimes along the digestive tract need to be taken into account. As a result of the widening of the pH range for protein precipitation by PhT, insoluble PhT–protein complexes are created at rumen pH. When the pH decreases to far below the pI for globular proteins (as in the abomasum), the increased charge of proteins resolubilizes protein again. Because there is minor tannin release, minor recomplexation of tannins and proteins can be expected. The resolubilization is determined by the charge of the proteins rather than their release from tannins as reported previously.15 The resolubilization of proteins is expected to facilitate efficient digestion of feed proteins after ruminal fermentation.
Supporting Information Available
The Supporting Information is available free of charge on the ACS Publications website at DOI: 10.1021/acs.jafc.7b03779.
Absorbance spectra of PGG (dotted line) and phloroglucinol (gray line) and fluorescence emission spectrum of tryptophan (black line) (Figure S1) (PDF)
This research was fully funded by the strategic research program IPOP TripleP@Sea Initiative and internal funds of Wageningen University and Research.
The authors declare no competing financial interest.
Supplementary Material
References
- Makkar H. P. S.; Tran G.; Heuzé V.; Giger-Reverdin S.; Lessire M.; Lebas F.; Ankers P. Seaweeds for livestock diets: A review. Anim. Feed Sci. Technol. 2016, 212, 1–17. 10.1016/j.anifeedsci.2015.09.018. [DOI] [Google Scholar]
- Vissers A. M.; Caligiani A.; Sforza S.; Vincken J.-P.; Gruppen H. Phlorotannins of Laminaria digitata. Phytochem. Anal. 2017, 28, 487–495. 10.1002/pca.2697. [DOI] [PubMed] [Google Scholar]
- Montero L.; Herrero M.; Ibáñez E.; Cifuentes A. Separation and characterization of phlorotannins from brown algae Cystoseira abies-marina by comprehensive two-dimensional liquid chromatography. Electrophoresis 2014, 35, 1644–1651. 10.1002/elps.201400133. [DOI] [PubMed] [Google Scholar]
- Bohin M. C.; Vincken J.-P.; Westphal A. H.; Tripp A. M.; Dekker P.; Van Der Hijden H. T. W. M.; Gruppen H. Interaction of flavan-3-ol derivatives and different caseins is determined by more than proline content and number of proline repeats. Food Chem. 2014, 158, 408–416. 10.1016/j.foodchem.2014.02.145. [DOI] [PubMed] [Google Scholar]
- Karonen M.; Oraviita M.; Mueller-Harvey I.; Salminen J.-P.; Green R. J. Binding of an oligomeric ellagitannin series to bovine serum albumin (BSA): Analysis by isothermal titration calorimetry (ITC). J. Agric. Food Chem. 2015, 63, 10647–10654. 10.1021/acs.jafc.5b04843. [DOI] [PubMed] [Google Scholar]
- Le Bourvellec C.; Renard C. M. Interactions between polyphenols and macromolecules: Quantification methods and mechanisms. Crit. Rev. Food Sci. Nutr. 2012, 52, 213–48. 10.1080/10408398.2010.499808. [DOI] [PubMed] [Google Scholar]
- Stern J. L.; Hagerman A. E.; Steinberg P. D.; Mason P. K. Phlorotannin–protein interactions. J. Chem. Ecol. 1996, 22, 1877–1899. 10.1007/BF02028510. [DOI] [PubMed] [Google Scholar]
- Kilmister R. L.; Faulkner P.; Downey M. O.; Darby S. J.; Falconer R. J. The complexity of condensed tannin binding to bovine serum albumin—An isothermal titration calorimetry study. Food Chem. 2016, 190, 173–178. 10.1016/j.foodchem.2015.04.144. [DOI] [PubMed] [Google Scholar]
- Deaville E. R.; Green R. J.; Mueller-Harvey I.; Willoughby I.; Frazier R. A. Hydrolyzable tannin structures influence relative globular and random coil protein binding strengths. J. Agric. Food Chem. 2007, 55, 4554–61. 10.1021/jf063770o. [DOI] [PubMed] [Google Scholar]
- Haslam E. Natural polyphenols (vegetable tannins) as drugs: Possible modes of action. J. Nat. Prod. 1996, 59, 205–215. 10.1021/np960040+. [DOI] [PubMed] [Google Scholar]
- Naczk M.; Oickle D.; Pink D.; Shahidi F. Protein precipitating capacity of crude canola tannins: Effect of pH, tannin, and protein concentrations. J. Agric. Food Chem. 1996, 44, 2144–2148. 10.1021/jf960165k. [DOI] [Google Scholar]
- Perez-Maldonado R. A.; Norton B. W.; Kerven G. L. Factors affecting in vitro formation of tannin–protein complexes. J. Sci. Food Agric. 1995, 69, 291–298. 10.1002/jsfa.2740690305. [DOI] [Google Scholar]
- Mueller-Harvey I. Unravelling the conundrum of tannins in animal nutrition and health. J. Sci. Food Agric. 2006, 86, 2010–2037. 10.1002/jsfa.2577. [DOI] [Google Scholar]
- Hervás G.; Frutos P.; Javier Giráldez F.; Mantecón Á. R.; Álvarez Del Pino M. A. C. Effect of different doses of quebracho tannins extract on rumen fermentation in ewes. Anim. Feed Sci. Technol. 2003, 109, 65–78. 10.1016/S0377-8401(03)00208-6. [DOI] [Google Scholar]
- Jones W. T.; Mangan J. L. Complexes of the condensed tannins of sainfoin (Onobrychis viciifolia scop.) with fraction 1 leaf protein and with submaxillary mucoprotein, and their reversal by polyethylene glycol and pH. J. Sci. Food Agric. 1977, 28, 126–136. 10.1002/jsfa.2740280204. [DOI] [Google Scholar]
- Tedeschi L. O.; Ramírez-Restrepo C. A.; Muir J. P. Developing a conceptual model of possible benefits of condensed tannins for ruminant production. Animal 2014, 8, 1095–1105. 10.1017/S1751731114000974. [DOI] [PubMed] [Google Scholar]
- Makkar H. P.; Blummel M.; Becker K. Formation of complexes between polyvinyl pyrrolidones or polyethylene glycols and tannins, and their implication in gas production and true digestibility in in vitro techniques. Br. J. Nutr. 1995, 73, 897–913. 10.1079/BJN19950095. [DOI] [PubMed] [Google Scholar]
- Singh K.; Shandilya M.; Kundu S.; Kayastha A. M. Heat, acid and chemically induced unfolding pathways, conformational stability and structure–function relationship in wheat α-amylase. PLoS One 2015, 10, e0132764. 10.1371/journal.pone.0132764. [DOI] [PMC free article] [PubMed] [Google Scholar]
- Damodaran S.Amino acids, peptides and proteins. In Fennema’s Food Chemistry; Damodaran S., Parkin K. L., Fennema O. R., Eds.; CRC Press: Boca Raton, FL, 2008. [Google Scholar]
- Hagerman A. E.; Butler L. G. Protein precipitation method for the quantitative determination of tannins. J. Agric. Food Chem. 1978, 26, 809–812. 10.1021/jf60218a027. [DOI] [Google Scholar]
- Pearsall W. H.; Ewing J. The isoelectric points of some plant proteins. Biochem. J. 1924, 18, 329–339. 10.1042/bj0180329. [DOI] [PMC free article] [PubMed] [Google Scholar]
- Petersen A.; Suck R.; Hagen S.; Cromwell O.; Fiebig H.; Becker W. M. Group 13 grass allergens: Structural variability between different grass species and analysis of proteolytic stability. J. Allergy Clin. Immunol. 2001, 107, 856–62. 10.1067/mai.2001.114114. [DOI] [PubMed] [Google Scholar]
- Bohin M. C.; Vincken J.-P.; Van Der Hijden H. T. W. M.; Gruppen H. Efficacy of food proteins as carriers for flavonoids. J. Agric. Food Chem. 2012, 60, 4136–4143. 10.1021/jf205292r. [DOI] [PubMed] [Google Scholar]
- Kragh-Hansen U. Structure and ligand binding properties of human serum albumin. Dan. Med. Bull. 1990, 37, 57–84. [PubMed] [Google Scholar]
- Vlasova I. M.; Zhuravleva V. V.; Saletsky A. M. Denaturation of bovine serum albumin initiated by sodium dodecyl sulfate as monitored via the intrinsic fluorescence of the protein. Russ. J. Phys. Chem. B 2014, 8, 385–390. 10.1134/S1990793114030154. [DOI] [Google Scholar]
- Stern J. L.; Hagerman A. E.; Steinberg P. D.; Winter F. C.; Estes J. A. A new assay for quantifying brown algal phlorotannins and comparisons to previous methods. J. Chem. Ecol. 1996, 22, 1273–93. 10.1007/BF02266965. [DOI] [PubMed] [Google Scholar]
- Lakowicz J. R.Protein fluorescence. In Principles of Fluorescence Spectroscopy, 3rd ed.; Springer: New York, 2006; Chapter 16, pp 529–575. [Google Scholar]
- Gill S. C.; von Hippel P. H. Calculation of protein extinction coefficients from amino acid sequence data. Anal. Biochem. 1989, 182, 319–326. 10.1016/0003-2697(89)90602-7. [DOI] [PubMed] [Google Scholar]
- Van de Weert M.; Stella L. Fluorescence quenching and ligand binding: A critical discussion of a popular methodology. J. Mol. Struct. 2011, 998, 144–150. 10.1016/j.molstruc.2011.05.023. [DOI] [Google Scholar]
- Hussain S. A. An introduction to fluorescence resonance energy transfer (FRET). Sci. J. Phys. 2012, 2012, sjp-268. 10.7237/sjp/268. [DOI] [Google Scholar]
- Hofmann T.; Glabasnia A.; Schwarz B.; Wisman K. N.; Gangwer K. A.; Hagerman A. E. Protein binding and astringent taste of a polymeric procyanidin, 1,2,3,4,6-penta-O-galloyl-β-d-glucopyranose, castalagin and grandinin. J. Agric. Food Chem. 2006, 54, 9503–9509. 10.1021/jf062272c. [DOI] [PMC free article] [PubMed] [Google Scholar]
- Kubista M.; Sjöback R.; Eriksson S.; Albinsson B. Experimental correction for the inner-filter effect in fluorescence spectra. Analyst 1994, 119, 417–419. 10.1039/AN9941900417. [DOI] [Google Scholar]
- Molecular Devices. SpectraMax M2e—Multimode Plate Readers User Guide; Molecular Devices: Sunnyvale, CA, 2006. [Google Scholar]
- Dobreva M. A.; Frazier R. A.; Mueller-Harvey I.; Clifton L. A.; Gea A.; Green R. J. Binding of pentagalloyl glucose to two globular proteins occurs via multiple surface sites. Biomacromolecules 2011, 12, 710–715. 10.1021/bm101341s. [DOI] [PubMed] [Google Scholar]
- Bose A. Interaction of tea polyphenols with serum albumins: A fluorescence spectroscopic analysis. J. Lumin. 2016, 169, 220–226. 10.1016/j.jlumin.2015.09.018. [DOI] [Google Scholar]
- Dufour C.; Dangles O. Flavonoid–serum albumin complexation: Determination of binding constants and binding sites by fluorescence spectroscopy. Biochim. Biophys. Acta, Gen. Subj. 2005, 1721, 164–173. 10.1016/j.bbagen.2004.10.013. [DOI] [PubMed] [Google Scholar]
- Bhattacharya M.; Jain N.; Bhasne K.; Kumari V.; Mukhopadhyay S. pH-induced conformational isomerization of bovine serum albumin studied by extrinsic and intrinsic protein fluorescence. J. Fluoresc. 2011, 21, 1083–1090. 10.1007/s10895-010-0781-3. [DOI] [PubMed] [Google Scholar]
- Soares S.; Mateus N.; De Freitas V. Interaction of different polyphenols with bovine serum albumin (BSA) and human salivary α-amylase (HSA) by fluorescence quenching. J. Agric. Food Chem. 2007, 55, 6726–6735. 10.1021/jf070905x. [DOI] [PubMed] [Google Scholar]
- Prigent S. V. E.; Gruppen H.; Visser A. J. W. G.; van Koningsveld G. A.; de Jong G. A. H.; Voragen A. G. J. Effects of non-covalent interactions with 5-O-caffeoylquinic acid (chlorogenic acid) on the heat denaturation and solubility of globular proteins. J. Agric. Food Chem. 2003, 51, 5088–5095. 10.1021/jf021229w. [DOI] [PubMed] [Google Scholar]
- Olsson M. H. M.; Søndergaard C. R.. Propka: A Protein pKa Predictor—Online Software, 3.0; University of Copenhagen: Copenhagen, Denmark, 2010.
Associated Data
This section collects any data citations, data availability statements, or supplementary materials included in this article.