Abstract
Background:
We sought the prevalence of food insecurity and whether cardiovascular risk markers and metabolic syndrome components are significantly different in categories of food insecurity in patients with type 2 diabetes.
Materials and Methods:
In this cross-sectional study, 520 patients with type 2 diabetes from the Kerman coronary artery disease risk study aged between 23 and 87 years (60.8 ± 11.4) who selected by one-stage cluster sampling were assigned into four groups of “food secure” and “mild,” “moderate,” and “severe” food insecure. Household food insecurity was assessed by a 9-item household food insecurity access scale questionnaire.
Results:
The prevalence of food security and mild, moderate, and severe food insecurity in patients with diabetes was 24.4%, 33.1%, 28.9%, and 13.6%, respectively. There was a significant difference among the food-secure/insecure sex groups (P = 0.001). The prevalence of food insecurity and risk factors such as total cholesterol, high low-density lipoprotein cholesterol, and visceral obesity in mild food-insecure females was significantly higher than males (P < 0.001, 0.001, and 0.001, respectively). The fasting blood sugar significantly increased (P = 0.020) in diabetic females with food security than the other female groups. Diastolic blood pressure significantly increased (P = 0.028) in diabetic females with severe food insecurity than the other female groups. The glycosylated hemoglobin significantly increased (P = 0.013) in diabetic males with severe food insecurity than the other male groups. Food insecurity odds ratio in females was 1.74 (95% confidence interval [CI]: 1.10–2.70), 2.39 (95% CI: 1.48–3.88), and 2.73 (95% CI: 1.49–5.01) times higher than in males for mild, moderate, and severe food insecurity, respectively.
Conclusion:
Food insecurity may deteriorate some cardiometabolic biomarkers in type 2 diabetes. Improving food security in patients with diabetes may help reduce cardiovascular disease.
Keywords: Cardiovascular risk markers, food insecurity, Kerman coronary artery disease risk study, metabolic syndrome components, type 2 diabetes
INTRODUCTION
One potentially modifiable risk factor for adverse diabetes outcomes among socially underprivileged populations is food insecurity, which is defined as “limited or uncertain availability of nutritionally adequate and safe foods or limited or uncertain ability to acquire acceptable foods in socially acceptable ways.”[1] Food insecurity is a risk for developing chronic health conditions such as diabetes, hypertension, hyperlipidemia, and cardiovascular disease.[2] Among patients with diabetes, food insecurity has been associated with poor control of glycemia and low-density lipoprotein cholesterol (LDL-C).[3,4] The issue of food insecurity was further compounded by socioeconomic status. Individuals of low socioeconomic status with food insecurity also reported low diabetes self-efficacy.[4] Based on one study, patients with diabetes who live in low-income families could not achieve and maintain a healthy diet as part of their self-management. Therefore, low-income patients with diabetes had experienced food insecurity, and they reported that accessibility and affordability issues had a strong influence on their dietary patterns.[5]
The risk of clinical diabetes was 50% higher among adults living in food-insecure households compared with adults living in food-secure households. Food insecurity was associated with self-reported hypertension and hyperlipidemia but not diabetes. However, food insecurity was associated with the laboratory or examination evidence of hypertension and diabetes. These data showed that food insecurity was associated with cardiovascular risk factors.[6]
A cross-sectional analysis of the National Health and Nutrition Examination Survey data revealed that the prevalence of metabolic syndrome (MetS) was higher among members of households with marginal and very low food security than among fully food secure contributors.[7] In another similar study, participants experiencing food insecurity had higher glycosylated hemoglobin (HbA1c), poorer self-efficiency, and low consumption of fruit and vegetables.[8] In contrast, another study has not found differences in diastolic blood pressure (BP), hyperlipidemia, and concentrations of total cholesterol (TC), blood glucose, and HbA1c by food security status.[9] Another study found that the 10-year predicted risk for cardiovascular disease was increased among food insecure participants aged 30–59 years, particularly those with very low food security.[10]
Subsequently, those considerations suggest that food insecurity could be associated with increased cardiovascular disease risk. Therefore, our understanding of the extent and nature of food insecurity remains limited due to the lack of population-level data. Then, based on previous conflicting studies in concern with the relationship between food insecurity and some of these indicators, this paper investigated the prevalence of food insecurity and whether cardiovascular risk markers and MetS components were significantly different in various categories of food insecurity in patients with type 2 diabetes as part of a population-based study from the Kerman coronary artery disease risk study (KERCADRS).
MATERIALS AND METHODS
Participants
The current study is a cross-sectional study conducted on patients with type 2 diabetes from the KERCADR cohort study. KERCADRS is a cohort study on 5900 (3238 females) individuals aged 15–75 years who were recruited in the household survey on Kerman province residences (during 2009–11). The sampling method was a one-stage cluster sampling. In the first stage, 250 postal codes (called seeds) were selected randomly among an updated roster of residential addresses in the provincial post office. The data collection team first mapped the seeds and then contact them one by one. After briefing the household member, all the eligible members (15–75 years old) have been listed on the Kish household coversheet and recruited to the study. In case of any household being absent for twice, the other neighborhood households from the right direction of the seed were approached systematically, and with the same method, eligible people were asked to participate in the study. The recruitment was continued to reach 24 individuals in each cluster.[11] All recruited people were given an appointment card having the date, time, and place of attending collaborating clinic for blood sampling and face-to-face interview. They were asked to be fasted for 12–14 h before the appointment time in the morning and bring their medicines with themselves. Based on the sampling methods (nonproportionate to size), the younger age groups were undersampled and the older groups have been oversampled. Although this will bring more precision to age-stratum-specific estimates, the total combined estimates have to be always standardized based on the real-age distribution of the target population.[11]
Kerman province is one of the 31 provinces of Iran. Kerman is in the southeast of Iran with its administrative center in the city of Kerman. It is the largest province of Iran that encompasses nearly 11% of the land area of Iran. The population of the province is about 3 million (9th in the country). The baseline protocol has been previously described in detail.[11] The written informed consent was signed by all of the participants after ensuring their good understanding of the participation in the survey. It should be noted that the study protocol and procedures were reviewed and approved by the Research Review Board of the Kerman University of Medical Sciences (Ethic code 88-110KA).
Inclusion criteria for individuals in the current study were (1) willingness to contribute in the study and sign the informed consent, (2) presence of type 2 diabetes at least for 1 year (according to the American Diabetes Association criteria) and those patients with diabetes with fasting blood sugar (FBS) 126 or higher than 126 mg/dl and/or under treatment for their diagnosed disease,(3) noninsulin therapy, (4) patients receive either diet therapy or diet therapy with combination of oral antidiabetic medications, (5) no history of myocardial infarction (MI), stroke, cardiovascular disease, active cancer, liver, kidney, and thyroid dysfunction, and infectious diseases. The exclusion criteria were the opposite of inclusion criteria.[12] Patients were selected by census and the total number of patients with diabetes was 851 in the KERCADR study, of whom 325 patients were not accessible. Therefore, from 526 patients, six patients did not have complete data. As a result, the exact number of patients was 520.
Food security assessment
Household food insecurity was assessed by a 9-item household food insecurity access scale (HFIAS) questionnaire, which the validity and reliability have been measured in one of the studies.[13] The HFIAS had good internal consistency (Cronbach's α =0.95). The questionnaires were completed by telephone interview.
Patients were divided into four groups of “food secure” with the result “0–1,” “mild food insecure,” “moderate food insecure,” and “severe food insecure” with the results “2–7,” “8–14,” and “15–27,” respectively. Answers were scored as “has never happened or no” with “0,” “has happened once or twice or rarely” with “1,” “has happened 3–10 times or sometimes” with “2,” and “has happened more than 10 times or quite often” with “3.”
Clinical and biochemical examinations
MetS components include FBS, high-density lipoprotein cholesterol (HDL-C), triglyceride (TG), systolic and diastolic BP, and waist circumference (WC). Cardiovascular risk markers include weight, body mass index (BMI), TC, LDL-C, and HbA1c.
As previously in the other studies described,[11,12] all measurements were performed according to the standard protocol. The patients fasted for 12–14 h before admission. FBS (KIMIA Kit, Code 890410, Iran) was measured using the glucose oxidase-peroxidase method. HDL-C (PARS Kit, Code 89022, Iran) and TG (KIMIA Kit, Code 890201, Iran) were measured by standard enzymatic procedures. BP was recorded using an automated oscillometric BP monitor (standard mercury manometer–Model RISHTER, Germany) after at least 10 min of rest in a chair and arm supported at heart level. WC was measured at the umbilical level using a nonstretchable measuring tape, without any pressure to the body surface.
Weight and BMI (weight in kilograms divided by height in meters squared) were measured and recorded in questionnaires. TC (KIMIA Kit, Code 890303, Iran) and LDL-C were calculated based on Friedewald formula (LDL-C = TC − [HDL-C + TG/5]). HbA1C (NycoCard Kit, Code 1042184, Austria) was determined based on Bio-Rad Variant high-performance liquid chromatography assay.
Statistical analysis
Statistical analysis was performed using SPSS software (IBM Corp. Released 2013. IBM SPSS Statistics for Windows, ersion 22.0. Armonk, NY BM Corp). Significance was assumed at P < 0.05. Normal distribution of biomarkers was investigated by Kolmogorov–Smirnov test. All the cardiometabolic biomarkers had normal distribution. We compared the MetS components and cardiovascular risk markers values between four groups of household food security/insecurity with the use of analysis of variance, in which all pairwise comparisons among the four groups were performed with the use of Tukey's honestly significant difference procedure. The Chi-square test was used to determine the relationship between different categories of food security and the categorical variables. Multinomial logistic regression analysis was used to predict the probability of cardiometabolic biomarkers on household food security/insecurity groups. Therefore, multinomial logistic regression is a predictive analysis to explain the relationship between one dependent variable such as four food security/insecurity groups and independent variables such as cardiometabolic biomarkers, controlling for the gender variable. The outcome variable is a categorical variable that included four groups of household food-secure/insecure status. Food-secure group is a reference group in the predicted model. The odds ratios (ORs) with 95% confidence interval (CI) all of the cardiometabolic biomarkers were computed.
RESULTS
Patients characteristics
The rate of response among all respondents was 99% (520 participants from 526 patients with diabetes). Six were excluded due to incomplete data. The mean (±standard deviation [SD]) age of participants was 60.82 ± 11.42 years (56% females and 44% males). Baseline characteristics of food-secure/insecure of patients with diabetes are shown in Table 1. Absolute and relative frequency distributions of patients with diabetes in food-secure/insecure groups are also shown in Table 1. There were significant difference among the food-secure/insecure sex groups (P = 0.001) [Table 1]. The prevalence of food security and mild, moderate, and severe food insecurity in patients with diabetes was 24.4%, 33.1%, 28.9%, and 13.6%, respectively. Food-secure male patients (32.0%) were higher than female patients in this category (18.3%).
Table 1.
Absolute and relative frequency distribution of patients with diabetes in food-secure/insecure groups based on sex and age groups
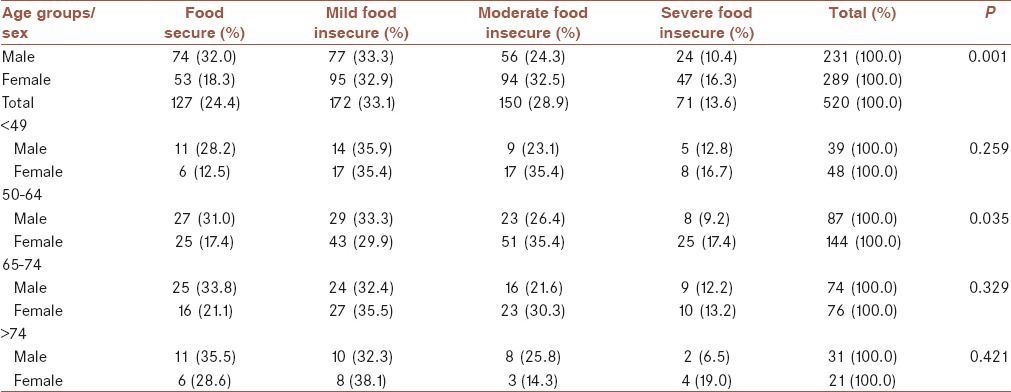
Patients divided into four age groups as <49, 50–64, 65–74, and >75 years. About 44% patients were in 50–64 years age group that 62% were female in this age group (P = 0.035) [Table 1]. In comparison with males, the prevalence of food insecurity was higher in females. Table 1 shows that in 50–64 years age group, one-third and two-third of patients with food insecurity were males and females, respectively.
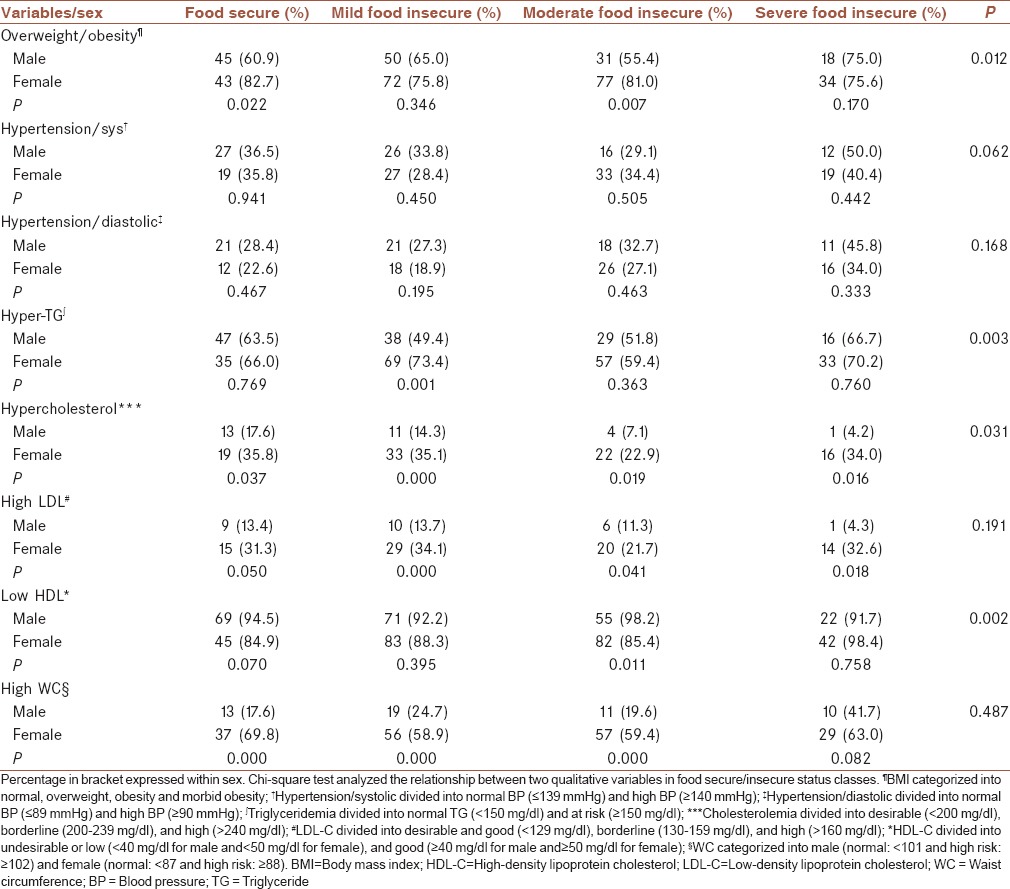
The Chi-square test revealed that more percentage of female patients in household food insecurity groups were overweight or obese with a significant difference in the moderate food-insecure group. However, this percentage difference in WC between males and females in food-secure/insecure groups was more significant, except in severe food insecure. In general, more percentage of female patients compared with male patients with a significant difference had hyperlipidemia [Table 2].
Table 2.
Absolute and relative frequency distribution of patients with diabetes in food-secure/insecure groups based on sex and selected risk markers
Cardiovascular risk markers
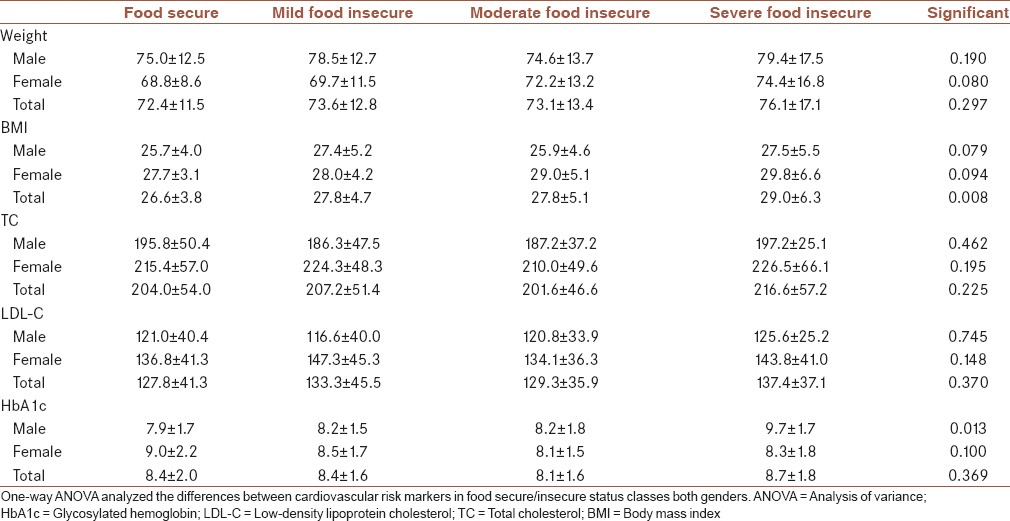
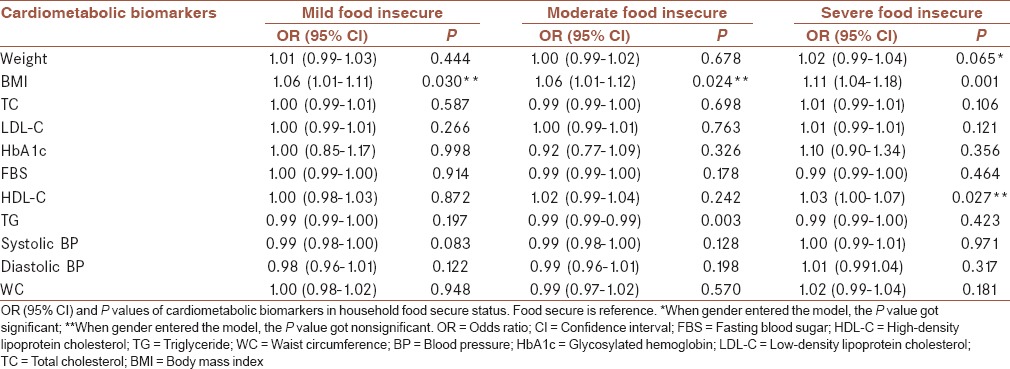
Table 3 indicates the mean (±SD) for selected cardiovascular risk markers of patients with diabetes in studied food-secure/insecure groups. There was no significant difference between both sex groups in cardiovascular risk markers such as weight, BMI, TC, and LDL-C among food-secure/insecure categories. In general, BMI and the levels of TC and LDL-C in food-secure/insecure categories for females were higher than males. The HbA1c significantly increased (P = 0.013) in diabetic males with severe food insecurity than the other male groups. However, the trends of HbA1C level in males and females among food-secure/insecure categories were conversely. Food insecurity OR in diabetic women was 1.74, 2.39, and 2.73 times higher than in men for mild, moderate, and severe food insecurity, respectively (OR = 1.74, 95% CI: 1.10–2.70; OR = 2.39, 95% CI: 1.48–3.88; OR = 2.73, 95% CI: 1.49–5.01). Mild, moderate, and severe food insecurity significantly associated with BMI (OR = 1.06, 95% CI: 1.01–1.11, P = 0.030; OR = 1.06, 95% CI: 1.01–1.12, P = 0.024; OR = 1.11, 95% CI: 1.04–1.18, P = 0.001 respectively). Interestingly, when data split by gender (results not showed), mild and severe food insecurity remained significantly associated with BMI for males and females, respectively.
Table 3.
Mean±standard deviation of selected cardiovascular risk markers of patients with diabetes in studied food-secure/insecure groups
Metabolic syndrome components
Table 4 indicates the mean (±SD) for MetS components of patients with diabetes in studied food-secure/insecure groups. A variation in TG levels among male and female patients with diabetes was very high. There were no significant differences in HDL-C, TG, systolic BP, and WC among food-secure/insecure categories for both gender groups. The FBS significantly increased (P = 0.020) in diabetic females with food security than the other female groups. Diastolic BP significantly increased (P = 0.028) in diabetic females with severe food insecurity than the other female groups. Trends of variations for all of the components among different food insecure categories were not regular along with the intensity of insecurity. Table 5 indicates the results of the multinomial logistic regression analysis all of the cardiometabolic biomarkers in various categories household food security. Moderate food insecurity was also associated with TG concentration (OR = 0.99, 95% CI: 0.99–0.99, P = 0.003), and severe food security was associated with HDL-C (OR = 1.03, 95% CI: 1.00–1.07, P = 0.027). No significant associations between food insecurity status and the other cardiovascular risk markers and MetS components were observed. Females in moderate food insecurity had lower risk based on HbA1c in compared with males in this group (OR = 0.75, 95% CI: 0.60–0.95, P = 0.016), and males in severe food insecurity had higher risk based on HbA1c compared with females in this group (OR = 1.81, 95% CI: 1.23–2.66, P = 0.003). Therefore, the risk of the diabetic males with severe food insecurity was high. A similar trend was observed for FBS in males and females.
Table 4.
Mean±standard deviation of selected metabolic syndrome components of patients with diabetes in studied food-secure/insecure groups
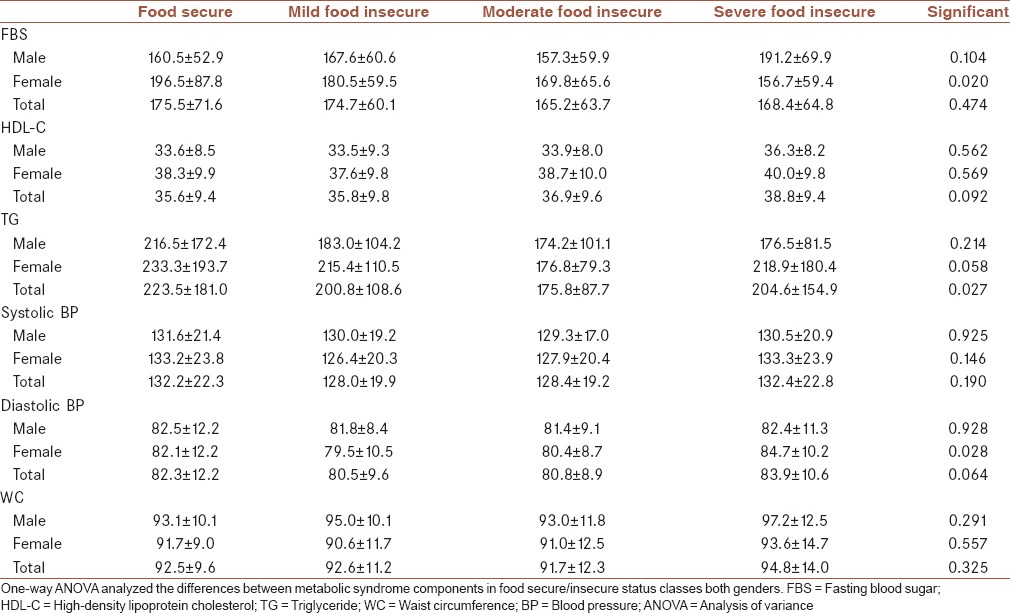
Table 5.
Results of multinomial logistic regression of cardiometabolic variables which affect the probability household food secure status
DISCUSSION
We sought the relationship between food insecurity with cardiovascular risk markers and MetS components in patients with type 2 diabetes in a population-based study from KERCADRS. Therefore, in addition to determining the prevalence of household food insecurity based on sex and age groups, we determined significant differences in cardiovascular risk markers and MetS components between various categories of food insecurity in patients with type 2 diabetes.
The prevalence of food insecurity in females with diabetes was higher than males with diabetes [Table 1]. This result was paralleled with the other studies.[14,15] In our study, a higher proportion of patients with diabetes particularly females were food insecure. In fact, diabetes was more prevalent in food-insecure households. This conclusion explained by Gucciardi et al.[16] Of course, diabetes incidence may occur in every household. One of the most important reasons could be inadequate accessibility to high-quality and/or high-quantity foodstuff due to an inappropriate socioeconomic situation. Galesloot et al. demonstrated that severe food insecurity, indicating reduced food intake and disrupted eating patterns, may influence population's ability to follow a healthy eating pattern necessary for effective diabetes management.[17] In another study, food-insecure participants reported lower overall dietary quality and lower intake of fruit and vegetables.[18] A suggestive mechanism might be that foods that are inexpensive and easily accessible tend to be energy dense and nutrient poor.[7] Therefore, micronutrient deficiency due to lack of micronutrient dense foods in a dietary pattern is more prevalent in food-insecure patients with type 2 diabetes. Consequently, food insecurity might be associated with deterioration of glycemic control in patients with type 2 diabetes.[3,18,19,20] In another word, due to low socioeconomic status in food-insecure households, food insecurity was associated with less obedience to recommended self-care activities and worse glycemic control.[19]
On the other hand, more percentage of females in compared with males in food-insecure groups with the significant difference had risk factors such as hyperlipidemia and general and visceral obesity [Table 2]. Nevertheless, these significant differences were showed between male and female patients in food secure group. The results of an 11-year study confirmed that relative risks of conventional cardiovascular risk factors for the occurrence of MI in postmenopausal women were higher than in men in all age groups.[21] Therefore, gender could act as a discrepancy factor between biomarkers. With regard to overweight and obesity were prevalent in patients with diabetes, but this matter was more prevalent in food insecure groups. In another study, higher BMI was associated with severe food insecurity in patients with diabetes; moderate and severe food-insecure patients with diabetes similarly were associated with poor glycemic control.[3] The study of Holben and Pheley revealed that when the results stratified by gender, only BMI and HbA1c were significantly greater among women from food-insecure households than among those from food-secure households. For men, only HbA1c was significantly greater among those from food-secure households than among those from food-insecure households.[22] In our study, BMI was also greater among female participants from food-insecure households than among those from food-secure households. The regular incremental trend in BMI was revealed among females by insecurity severity. This trend among male was not regular. Unlike the study of Holben and Pheley, HbA1c was significantly greater among males from food-insecure households than among those from food-secure households. The regular incremental trend in HbA1c was revealed among males by insecurity severity. The reason for this disparity in HbA1c between males and females was unknown. From the other viewpoint, HbA1c variation corresponded with FBS variation among males and females from food-secure/insecure households. This correspondence is predictable for HbA1c and FBS. About one-third of patients were hypertensive. However, we could find exclusively a BP increment in hypertensive participants with severe food-insecure patients. The number of patients with low HDL-C was 3.5 times more than patients with high LDL-C. The reason for this disparity is the deteriorating effect of general and visceral obesity and hypertension of patients on their HDL-cholesterol [Table 2]. Lipid and lipoprotein profiles such as TG, TC, and LDL-C levels were greater among females from food-secure/insecure households than among males from food-secure/insecure households. As we mentioned previously, this disparity is due to more prevalence of overweight/obesity and hypertension among females than males.
Overall, food insecurity was associated with a decreased likelihood of good cardiovascular health (CVH). Participants who were food insecure were significantly less likely to have good CVH compared to participants who were food secure.[23] Then, we computed OR of cardiometabolic biomarkers in food insecurity status. However, no significant associations between food insecurity status and cardiometabolic biomarkers, except for BMI and TG concentration, were observed. These results were similar to the results of Ford.[10] Nevertheless, Ford indicated that adults aged 30–59 years with very low food security showed evidence of increased predicted 10-year cardiovascular disease risk.[10] In contrast, Parker et al. revealed that adults in households with marginal and very low food security had a 1.80-fold (95% CI: 1.30–2.49) and 1.65-fold (95% CI: 1.12–2.42) increased odds of MetS, respectively.[7] Generally, women are greater than men at risk of food insecurity. Food insecurity OR in nondiabetic and diabetic women was 3.2 (95% CI: 1.3–7.7) and 2.4 (95% CI: 1.02–5.5) times higher than in men. Food security scores were significantly different between males and females.[14] In our study, household food insecurity OR in diabetic women was also 1.74, 2.39, and 2.73 times higher than in men for mild, moderate, and severe food insecurity, respectively.
One of the limitations of our study was drop out a number of patients with diabetes who did not participate in our investigation. One of the limitations of this research was to be cross-sectional; however, the second phase of this cohort study has already begun. Therefore, the patients with type 2 diabetes will be evaluated in terms of food insecurity.
CONCLUSIONS
Food insecurity may deteriorate some cardiometabolic biomarkers in type 2 diabetes. Finally, these results emphasize the need for interventions focus on prevention of household food insecurity and the decreasing prevalence of type 2 diabetes. Hence, further interventional research is needed in this population to determine associations between improvement of food security and decreasing of cardiovascular risk markers and MetS components. Therefore, food security can play a significant role in the prevention and management of diabetes, and improving food security in patients with diabetes may help reduce cardiovascular disease. Food dietary assessment and screening with a validated measure may facilitate identification of patients at risk of food insecurity.
Financial support and sponsorship
The main project has been funded by Kerman University of Medical Sciences with the grant number 88/110.
Conflicts of interest
There are no conflicts of interest.
REFERENCES
- 1.Anderson SA. Core indicators of nutritional state for difficult-to-sample populations. J Nutr. 1990;120(Suppl 11):1559–600. doi: 10.1093/jn/120.suppl_11.1555. [DOI] [PubMed] [Google Scholar]
- 2.Seligman HK, Bindman AB, Vittinghoff E, Kanaya AM, Kushel MB. Food insecurity is associated with diabetes mellitus: Results from the National Health Examination and Nutrition Examination Survey (NHANES) 1999-2002. J Gen Intern Med. 2007;22:1018–23. doi: 10.1007/s11606-007-0192-6. [DOI] [PMC free article] [PubMed] [Google Scholar]
- 3.Bawadi HA, Ammari F, Abu-Jamous D, Khader YS, Bataineh S, Tayyem RF, et al. Food insecurity is related to glycemic control deterioration in patients with type 2 diabetes. Clin Nutr. 2012;31:250–4. doi: 10.1016/j.clnu.2011.09.014. [DOI] [PubMed] [Google Scholar]
- 4.Seligman HK, Jacobs EA, López A, Tschann J, Fernandez A. Food insecurity and glycemic control among low-income patients with type 2 diabetes. Diabetes Care. 2012;35:233–8. doi: 10.2337/dc11-1627. [DOI] [PMC free article] [PubMed] [Google Scholar]
- 5.Cuesta Briand B, Saggers S, McManus As. ‘You get the quickest and the cheapest stuff you can’: Food security issues among low-income earners living with diabetes. Australas Med J. 2011;4:683–91. doi: 10.4066/AMJ.20111104. [DOI] [PMC free article] [PubMed] [Google Scholar]
- 6.Seligman HK, Laraia BA, Kushel MB. Food insecurity is associated with chronic disease among low-income NHANES participants. J Nutr. 2010;140:304–10. doi: 10.3945/jn.109.112573. [DOI] [PMC free article] [PubMed] [Google Scholar]
- 7.Parker ED, Widome R, Nettleton JA, Pereira MA. Food security and metabolic syndrome in U.S. adults and adolescents: Findings from the National Health and Nutrition Examination Survey, 1999-2006. Ann Epidemiol. 2010;20:364–70. doi: 10.1016/j.annepidem.2010.02.009. [DOI] [PMC free article] [PubMed] [Google Scholar]
- 8.Lyles CR, Wolf MS, Schillinger D, Davis TC, Dewalt D, Dahlke AR, et al. Food insecurity in relation to changes in hemoglobin A1c, self-efficacy, and fruit/vegetable intake during a diabetes educational intervention. Diabetes Care. 2013;36:1448–53. doi: 10.2337/dc12-1961. [DOI] [PMC free article] [PubMed] [Google Scholar]
- 9.Shariff ZM, Sulaiman N, Jalil RA, Yen WC, Yaw YH, Taib MN, et al. Food insecurity and the metabolic syndrome among women from low income communities in Malaysia. Asia Pac J Clin Nutr. 2014;23:138–47. doi: 10.6133/apjcn.2014.23.1.05. [DOI] [PubMed] [Google Scholar]
- 10.Ford ES. Food security and cardiovascular disease risk among adults in the United States: Findings from the National Health and Nutrition Examination Survey, 2003-2008. Prev Chronic Dis. 2013;10:E202. doi: 10.5888/pcd10.130244. [DOI] [PMC free article] [PubMed] [Google Scholar]
- 11.Najafipour H, Mirzazadeh A, Haghdoost A, Shadkam M, Afshari M, Moazenzadeh M, et al. Coronary artery disease risk factors in an urban and peri-urban setting, Kerman, Southeastern Iran (KERCADR study): Methodology and preliminary report. Iran J Public Health. 2012;41:86–92. [PMC free article] [PubMed] [Google Scholar]
- 12.Yousefzadeh G, Shokoohi M, Najafipour H. Inadequate control of diabetes and metabolic indices among diabetic patients: A population based study from the Kerman Coronary Artery Disease Risk Study (KERCADRS) Int J Health Policy Manag. 2014;4:271–7. doi: 10.15171/ijhpm.2015.06. [DOI] [PMC free article] [PubMed] [Google Scholar]
- 13.Salarkia N, Abdollahi M, Amini M, Neyestani TR. An adapted Household Food Insecurity Access Scale is a valid tool as a proxy measure of food access for use in urban Iran. Food Sec. 2014;6:275–82. [Google Scholar]
- 14.Hasan-Ghomi M, Ejtahed HS, Mirmiran P, Hosseini-Esfahani F, Sarbazi N, Azizi F, et al. Relationship of food security with type 2 diabetes and its risk factors in Tehranian adults. Int J Prev Med. 2015;6:98. doi: 10.4103/2008-7802.167086. [DOI] [PMC free article] [PubMed] [Google Scholar]
- 15.Liu J, Park YM, Berkowitz SA, Hu Q, Han K, Ortaglia A, et al. Gender differences in the association between food insecurity and insulin resistance among U.S. adults: National Health and Nutrition Examination Survey, 2005-2010. Ann Epidemiol. 2015;25:643–8. doi: 10.1016/j.annepidem.2015.06.003. [DOI] [PubMed] [Google Scholar]
- 16.Gucciardi E, Vahabi M, Norris N, Del Monte JP, Farnum C. The intersection between food insecurity and diabetes: A review. Curr Nutr Rep. 2014;3:324–32. doi: 10.1007/s13668-014-0104-4. [DOI] [PMC free article] [PubMed] [Google Scholar]
- 17.Galesloot S, McIntyre L, Fenton T, Tyminski S. Food insecurity in Canadian adults receiving diabetes care. Can J Diet Pract Res. 2012;73:e261–6. doi: 10.3148/73.3.2012.e261. [DOI] [PubMed] [Google Scholar]
- 18.Berkowitz SA, Gao X, Tucker KL. Food-insecure dietary patterns are associated with poor longitudinal glycemic control in diabetes: Results from the Boston Puerto Rican Health Study. Diabetes Care. 2014;37:2587–92. doi: 10.2337/dc14-0753. [DOI] [PMC free article] [PubMed] [Google Scholar]
- 19.Heerman WJ, Wallston KA, Osborn CY, Bian A, Schlundt DG, Barto SD, et al. Food insecurity is associated with diabetes self-care behaviours and glycaemic control. Diabet Med. 2016;33:844–50. doi: 10.1111/dme.12896. [DOI] [PMC free article] [PubMed] [Google Scholar]
- 20.Berkowitz SA, Baggett TP, Wexler DJ, Huskey KW, Wee CC. Food insecurity and metabolic control among U.S. adults with diabetes. Diabetes Care. 2013;36:3093–9. doi: 10.2337/dc13-0570. [DOI] [PMC free article] [PubMed] [Google Scholar]
- 21.Mahmoodi MR, Abadi AR, Kimiagar SM. Sex differences in myocardial infarction events between patients with and without conventional risk factors: The modares heart study. Am Heart Hosp J. 2007;5:228–35. doi: 10.1111/j.1541-9215.2007.07301.x. [DOI] [PubMed] [Google Scholar]
- 22.Holben DH, Pheley AM. Diabetes risk and obesity in food-insecure households in rural appalachian ohio. Prev Chronic Dis. 2006;3:A82. [PMC free article] [PubMed] [Google Scholar]
- 23.Saiz AM, Jr, Aul AM, Malecki KM, Bersch AJ, Bergmans RS, LeCaire TJ, et al. Food insecurity and cardiovascular health: Findings from a statewide population health survey in Wisconsin. Prev Med. 2016;93:1–6. doi: 10.1016/j.ypmed.2016.09.002. [DOI] [PMC free article] [PubMed] [Google Scholar]


