Abstract
Diffuse correlation spectroscopy (DCS) is a technique which enables powerful and robust non-invasive optical studies of tissue micro-circulation and vascular blood flow. The technique amounts to autocorrelation analysis of coherent photons after their migration through moving scatterers and subsequent collection by single-mode optical fibers. A primary cost driver of DCS instruments are the commercial hardware-based correlators, limiting the proliferation of multi-channel instruments for validation of perfusion analysis as a clinical diagnostic metric. We present the development of a low-cost scalable correlator enabled by microchip-based time-tagging, and a software-based multi-tau data analysis method. We will discuss the capabilities of the instrument as well as the implementation and validation of 2- and 8-channel systems built for live animal and pre-clinical settings.
Keywords: Diffuse Correlation Spectroscopy, blood perfusion, Hemodynamic monitor
1. INTRODUCTION
Existing measurement tools for measuring blood velocity and blood perfusion in tissue provide incomplete information is terms of absolute blood velocity, ability to simultaneously probe multiple locations and the ability to adequately probe deep into tissue2. Diffuse correlation Spectroscopy DCS offers the promise of overcoming these deficiencies. In DCS, as illustrated in Figure 1, near-infrared photons from a coherent laser source are injected into tissue and then collected with a single mode fiber. The photons arriving in the collection fiber are detected by a single photon detector. The arrival times of photons are used to compute an autocorrelation, where the shape of the autocorrelation versus lag time is dependent on multiple parameters including blood perfusion, red blood cell velocity, and sampling depth6. Existing hardware based correlators, such as correlator.com and software based systems can be cost prohibitive for multiplexing many channels and can be large and bulky in a portable system for clinical use. The system described in this work attempts to make use of a low cost system on a chip (SOC) consisting of a microprocessor and a field programmable gate array (FPGA). Autocorrelation functions are calculated in the control software, further reducing hardware cost. The complete instrument can detect decreases in blood perfusion associated with a collection of health issues such as the onset of hemorrhagic shock and vascularization in tissue recently transplanted.
Figure 1.

Schematic of the DCS instrument and measurement procedure.
1.1 DCS Theory
The temporal intensity autocorrelation is defined as
| (1) |
and is related to the normalized scattered electric field autocorrelation,
| (2) |
by the Siegert relationship,
| (3) |
where q2 is the square of the scattering wavevector, k0 is the magnitude of the incident wavevector, <r2(τ)> is the photon’s mean square displacement, and β is a constant depending on the optics and setup5. The autocorrelation based on photon arrival times can be fit to an exponential decay function where the time constant is proportional to blood flow1. The goal in RMD’s development of a portable monitor is to detect changes in flow in real time by calculating this decay constant and alerting clinicians to a significant deviation from baseline. The intensity autocorrelation signal g2(τ) can be calculated directly from the intensity of the scattered light. The autocorrelation is a relatively simple, but time consuming calculation based on the photon arrival times.
1.2 DCS Instrument
The DCS instrumentation consists of a coherent laser source, emission and collection fibers, a photon counter, and an auto correlator. A LD785-SH300 785 nm laser diode (Thorlabs, Newton, NJ) is focused into a 200 um multimode fiber optic which is positioned normal to the skin and held in an epoxy chuck surrounded by flexible PDMS base. The laser is run in constant current and controlled by a WLD 3343 Laser driver (Wavelength Electronics, Bozeman, MT). Photons diffuse through the tissue and are reflected into the collection fiber. Time dependent constructive and destructive interference based on the scattering and absorption of moving objects in the photon path (red blood cells) will change the intensity over time of the arriving photon stream at the collection fiber. A single mode collection fiber (780HP Thorlabs) is held in the epoxy at a fixed distance of 1mm, 2mm, 5mm, or 1 cm, depending on the experiment. The collection fiber is coupled to a single photon counting module such as Excelitas SPCM-AQRH or equivalent. The pulses generated by the SPCM are converted to an autocorrelation function in a custom microprocessor based correlator described in the section 1.4.
The purpose of this work is to compare our measurements with the PSOC based time tagging instrument to existing commercial devices such as the hardware correlator of correlator.com and to instruments such as the recently published raspberry pi module based correlator4.
1.3 Instrument construction
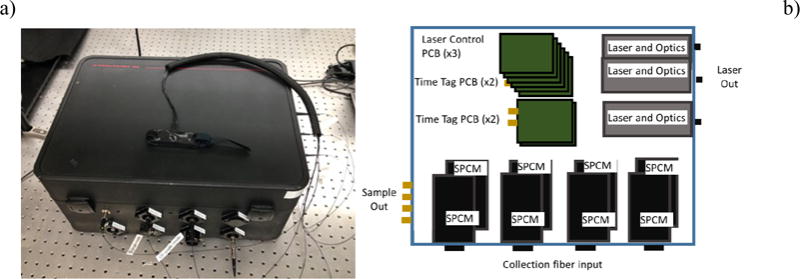
Our original prototype instrument is an eight-channel DCS system seen in Figure 2. Three different input lasers on the right hand side of the box provide light into an optical system that focuses the light to a SMA fiber bulkhead on the right side of the box. Each laser has a separate laser driver PCB attached to a signal bus in the stack in the center back of the box. The signal bus brings power and ground and control signals for the laser drivers. The laser drivers are controlled by logic and DAC signals on the PSOC via the software interface. One photomultiplier (PMT) and seven SPCM modules and are used to detect the light pulses from the collection fiber in the external probes. The PMT quantum efficiency is significantly lower than the SPCMs, allowing it to be used for the closer collection fiber spacing where the scattered photons are substantially more numerous without causing saturation of the photodetector. In-line SMA attenuators can be used at the photodetector inputs, but attenuation over both small and large ranges simultaneously can inhibit the instrument and add long set up times. Newer instruments, such as the two-channel version shown below contain a filter wheel to attenuate the input. Beneath the laser drivers and in front of them are four PSOC boards that can process up to eight channels worth of incoming signals. Data is transferred from the PSOC memory via USB, which has a limit of near 500 kB/s on the PSOC, due to the transfer method used. Using a single PC to read out multiple channels means the total count rate in all detectors is decreased for each channel that is added. If real-time data is needed for all channels, it can be necessary to use multiple computers to increase the total allowable count rate.
Figure 2.

a.) Photograph of eight-channel blood perfusion monitoring system instrument, and b.) schematic diagram of the eight- channel instrument.
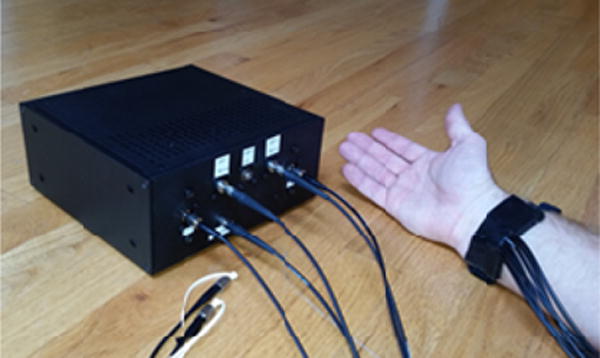
The two-channel instrument is shown in Figure 3. The laser and spectrometer control are not shown. The SPCMs are positioned vertically on either side of the miniature instrument box. The final dimensions of the box are 20 cm × 20 cm × 6 cm. Only one PSOC controller board (two channels) and two laser controllers are included. Lasers and optics are mounted front and center, and no external access to the detector signals is provided. The power supply is also external. The two channel box also includes an Avantes Minispec spectrometer and a white LED source for performing diffuse reflectance spectrometry measurements (DRS).
Figure 3.

Compact two-channel blood perfusion monitoring system. A fiber optic probe is shown attached to the write of a volunteer for scale.
1.4 Acquisition of the signal
The SPCM, or photon detector signals are fed into an auto correlator. The auto correlator consists of an analog conditioning circuit, a Cypress PSOC 5 based time tagging circuit, and a software correlator. The PSOC 5 is a combination FPGA and microprocessor that contains many standardized communication and calculation blocks making rapid prototyping possible. The general purpose interface pins (GPIO) on the PSOC require a pulse width slightly longer than two clock cycles of the system clock. The analog section consists of a pulse detector, or comparator, and a pulse stretching circuit that stretched the initial 25 ns SPCM signal to 250 ns. A block diagram of the PSOC operating code is shown in Figure 4.
Figure 4.

Block diagram of PSOC operation. The laser and spectrometer control are not shown. The elements after the photon detector and before the host PC are all contained in the fabric of the FPGA, and are combinations of pre-programmed blocks and interfaced with the microprocessor with proprietary C code.
Each time a photon event triggers the SPCM, the PSOC stores the value of a counter incremented by a 12 MHz clock. The clock speed determines the shortest lag time to be 83 ns, but the delayed reset for the timer circuit prevents the first two time bins from being used. The counter is reset and increments until the next pulse arrives. An event counter also records the number of events since the last transfer of data to the PC. Direct memory access (DMA) blocks in the PSOC perform the transfer of these time stamps to memory so the processor is available to respond to user input from the PC and to mediate the transfer of data over the USB. Each PSOC is configured to handle two channels simultaneously, and can store data in a circular buffer of 10,240 events for each channel, divided into 10 arrays. When the PC queries the PSOC via USB, the PSOC reads the event counter. If the event counter indicates that one or more of the 10 arrays are full (1024 events,) then the PSOC will transfer up to nine arrays (9216 two byte time stamps) to the PC, and reset the event counter.
Since typical count rates in the single photon counter can range from several hundred hertz to several hundred kilohertz, the throughput of data can become very large. To reduce the throughput, the time stamps are stored as two byte values, which provides a range from 0 to 65534. At a 12 MHz clock frequency, events that are separated in time greater than approximately 5 ms could be given incorrect time stamps when the counter reaches its maximum value and resets to zero. Fortunately, the dark count rate of the detectors is generally high enough to ensure that the counter will almost never reach the maximum value.
1.5 Software autocorrelation
The DCSMon software uses the two byte time stamps received from the PSOC to create a real-time autocorrelation function, a record of the historical count rate, and a decay constant from a single exponential fit to the autocorrelation function. The software can also control the laser power, and record extended experiments with variable integration time.
When an experiment is running, the software will query the PSOC program to determine if there are events available and then receive the events into a buffer. Background processes in the software are used to complete the simultaneous writing of time stamps to file for later reanalysis and calculation of the real time correlation function. Each channel’s saving and correlation calculation routine can operate on a somewhat independent thread, allowing for scaling of the correlator to multiple channels.
The autocorrelation function is calculated by the use of a multi-tau algorithm, also known as bin and multiply [2], originally published by Magatti5. The multi-tau method calculates the autocorrelation for a reduced number of time lags. For the shortest time span (n=0), up to p events the autocorrelation is directly calculated at the highest time resolution. The auto correlation at a lag time j, of a collection of events fi can be written as3
| (1) |
Where the subscript j indicates single point on the spectrum of possible the time differences between discrete events that is of interest, commonly called the lag time. Calculating the full correlation at full resolution from 100 ns to a few tens of seconds would require excessive calculation and storage time given current memory and processor technology. Instead, the correlation function is calculated only for bins of lag times, the width of which increase in logarithmic steps with the magnitude of the lag time. This is possible because the absolute value of the resolution requirements decrease as the lag time increases. The first p events are stored and the k=0 correlation function updated for each time step. Each m bins in the first correlator are averaged to make the k=2 correlator. The correlation function is calculated using (1) at each lag time within the tier, with reduced time resolution due to averaging. For the RMD correlator, and other existing hardware correlators p=16, and m=2.3 The completeness of the real-time correlation function depends on the on the speed of the processor and the integration time of the experiment. An adjustable width scaling parameter that directly reduces the time resolution is available in the software and can be increased until the correlation always completes.
2. EXPERIMENTAL
2.1 Pump controlled flow experiments
A peristaltic pump was used to push a solution of water and Intralipid through plastic tubing. Vacuum spaces were integrated into the tubing system to mitigate the pulsatile flow. The probe was placed in direct contact with a tube of inner diameter 8 mm, outer diameter 10 mm. The 2 mm spacing was selected for the collection fiber. The output signal was connected to a commercial auto correlator (Correlator.com) and to the RMD auto correlator simultaneously. The pump speed was varied to produce a change in the relative flow value. Figure 5 provides a diagram of the pump and container configuration that was used to provide relatively smooth flow at the probe sample point.
Figure 5.

Pump controlled flow experimental diagram. The probe is placed directly on the surface of the tube, with the emission fiber as normal to the surface as possible. Air gaps from several flasks are introduced to suppress the pulsatile flow components from the pump from appearing in the autocorrelation data.
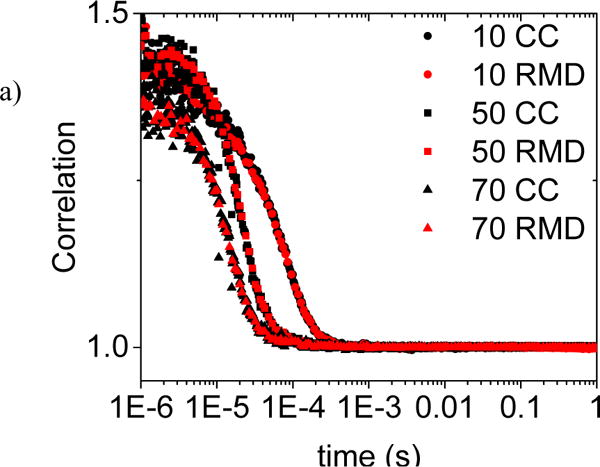
In Figure 6), autocorrelation plots are shown for both the correlator.com correlator and for the RMD correlator. An 8% scaling factor has been applied to produce the match seen in the figure. It is thought that this discrepancy is due to the lower time resolution of the RMD correlator compared to the correlator.com and time jitter in the inaccuracy of the digital clock used on the PSOC. A single exponential decay curve with an offset fixed at 1 was fit to the correlation curves for each pump speed. The constants are nearly indistinguishable, the average variance is less than 3% even for the unadjusted autocorrelation data. The pump flow rate was calibrated and used to estimate the speed of the intralipid particles. For a pump setting of P, a rough estimate of the particle speed is 0.2*P mm/s. At a setting of 30, the particle velocity estimate is slightly greater than 5 mm per second. These velocities are all much larger than expected capillary blood flow. The vastly different scattering and absorption properties of the intralipid and the environment conditions make a direct comparison to blood velocities not meaningful.
Figure 6.

a) Comparison of RMD and correlator.com autocorrelation measurements for RMD probe on clear plastic tubing with Intralipid dilution and variable pump controlled flow rates. A correction factor of 8% has been applied to the RMD data as explained in the text.
2.2 Finger Strangulation
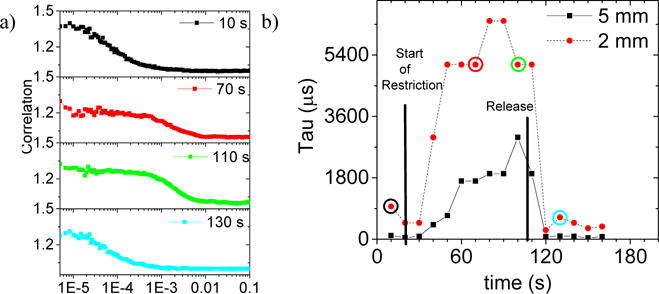
A tourniquet wrapped around the left index finger of a healthy male volunteer was used to demonstrate the perfusion sensitivity of the RMD system to real microvascular flow. The probe was placed on the palm side, near the top of the finger. Data were collected at 2 mm and 5 mm spacings for the collection fiber to examine shallow and deeper probing. The RMD DCSmon software performs a single exponential decay fit to a boxcar average over 13 successive points in the autocorrelation data and reports the decay constant in real time. Figure 7a) shows samples of four of the autocorrelation curves before, during and after the experiment for the 2 mm spacing. Figure 7b) shows the online reported fit results over the length of the three minute experiment with 10 second integration times for both the 2mm and 5mm spacing. The method is robust, and hand motion has a negligible effect.
Figure 7.

a) Sample autocorrelation curves from the flow restriction experiment, before, during and after strangulation of a left-hand index finger as sampled at a 2 mm collection fiber spacing. b) Automatically generated decay constants from DCSmon correlation software, continuously sampled at ten second intervals during the strangulation experiment for both 2 mm and 5 mm collection spacings, recorded simultaneously. The start and release of the tourniquet restriction are shown on the plot at 20 s and 110 s, respectively.
The distance between the emission and collection fibers is proportional to the depth sampled. In tissue this can be important in sampling different types of tissue: i.e. capillary bed versus deep arteries. The semi-infinite slab model described above predicts different time constants for the autocorrelation data at different depths. For greater emitter and collector spacing, the decay in the autocorrelation signal should be faster in time. Figure 7b) shows the simultaneous results from 2 mm and 5 mm fiber depths. The 5 mm depth corresponds to a shorter decay constant (faster in time) and thus faster flow as expected. Overall the increase from just 60 s of blood flow restriction is over a factor of 20 in both cases.
3. DISCUSSION
The RMD blood perfusion monitor has demonstrated the ability to provide measurements of relative blood flow. Both the pump controlled intralipid flow and the strangulation experiments demonstrate that the single exponential decay constant is proportional t the rate of blood flow or the total blood perfusion. Since the derived autocorrelation theory depends on the scattering and absorption parameters of the media, absolution calibration of blood flow will most likely require a separate measurement. Experiments using diffuse reflectance spectroscopy (DRS) from a white light source for calibration are underway. The two channel monitor described above includes a white light source and a spectrometer for this purpose. Using a commercially available autocorrelator as a standard for the time dependence of the autocorrelation function required a modification to the calculation by approximately 8%, although the determination of the single exponential decay constant varies by only 3% for the RMD correlator at present.
4. CONCLUSION
Relative blood flow measurements using DCS techniques have been previously demonstrated. The need for multiple channels of monitoring and real-time feedback in a system with a reasonable cost for deployment in a clinical setting is thus far unmet. The RMD blood perfusion instrument offers the potential of a low cost method for monitoring perfusion of blood. The shape of the correlation curves can be matched when the appropriate scaling factor is applied. Relative blood flow and depth measurements indicate that the RMD perfusion monitor can rapidly detect blood perfusion changes in real time. The use of a PSOC system on a chip allowed rapid prototyping of the blood perfusion instrument and added additional automated controls. The use of a software based autocorrelation algorithm in addition to the PSOC time- tagger allows for real-time measurement of blood perfusion across multiple channels in a cost effective system.
References
- 1.Boas DA, et al. Scattering and Imaging with Diffuse Temporal Field Correlations. PRL. 1995;75 doi: 10.1103/PhysRevLett.75.1855. [DOI] [PubMed] [Google Scholar]
- 2.Uranishi R, Nakase H, Sakaki T, Kempski OS. Evaluation of Absolute Cerebral Blood Flow by LaserDoppler Scanning Comparison with Hydrogrn Clearance. J Vasc Res. 1999;36:100–05. doi: 10.1159/000025631. [DOI] [PubMed] [Google Scholar]
- 3.Ramírez Jorge, Sukumaran Sathish K, Vorselaars Bart, Likhtman Alexei E. Efficient on the Fly Calculation of Time Correlation Functions in Computer Simulations. J Chem Phys. 2010;133 doi: 10.1063/1.3491098. [DOI] [PubMed] [Google Scholar]
- 4.Tivnan Matthew, Gurjar Rajan, Wolf David E, Vishwanath Karthik. Sensors. 2015;15:19709–22. doi: 10.3390/s150819709. [DOI] [PMC free article] [PubMed] [Google Scholar]
- 5.Yu G, Durduran T, Zhou C, Cheng R, Yodh AG. Near-Infrared Diffuse Correlation Spectroscopy for Assessment of Tissue Blood Flow. In: Pitris C, Ramanujam N, Boas DA, editors. Handbook of Biomedical Optics. CRC Press; 2011. pp. 195–216. [Google Scholar]
- 6.Yu Guoqiang, Floyd Thomas F, Durduran Turgut, Zhou Chao, Wang Jiongjiong, Detre John A, Yodh Arjun G. Validation of Diffuse Correlation Spectroscopy for Muscle Blood Flow with Concurrent Arterial Spin Labeled Perfusion Mri. Optics Express. 2007;15 doi: 10.1364/oe.15.001064. [DOI] [PubMed] [Google Scholar]


