Abstract
The MRL mice are resistant to a 12-week high fat diet (HFD) feeding protocol, with the proximal cause being an increased basal pAMPKT172 expression in the skeletal muscle. Here, we test if this lack of pathology extends to the liver at both the tissue and cellular levels and its correlation to pAMPKT172 levels. MRL and B6 mice were subjected to 12 weeks of diet intervention and tissues were either fixed for histology or snap-frozen for further processing (n= 3–6, per group). The HFD MRL mice remain insulin and glucose sensitive after 12 weeks of HFD. This phenomenon is correlated to increased liver pAMPKT172. The HFD-fed B6 control strain demonstrates the opposite trend with decreased pAMPKT172 expression after the HFD period. We have found further evidence of differential MRL metabolic adaptations. These differences include reduced glycogen content, reduced ectopic fat storage, and increased expression of Complex II (CII) and Complex V of the Electron Transport Chain (ETC). Whereas, B6 HFD control show unchanged glycogen content, increased ectopic fat and increased expression of Complex I and Complex V of the ETC. Taken together, the MRL adaptations point to an inefficient energy-producing phenotype that leads to glycogen depletion and attenuation of ectopic fat as secondary consequences with AMPK as the signaling mediator of these HFD- hepatic adaptations.
Keywords: MRL mice, AMPK, liver, high fat diet, steatosis, oxidative phosphorylation, glycogen
Introduction
Chronic exposure to nutrient excess has presented us with an amalgam of diseases. Among those, the incidence of obesity and type two diabetes (T2DM) have raised in parallel. In the U.S. alone, the diabetes incidence has dramatically increased in the last decade, accruing well over billions of dollars in diabetes-related costs and straining the health care system. [1]. Research studies focus primarily in the treatment of the pathology while studies in pathology-resistant models are usually focused on transgenic models. Recent studies have uncovered the MRL mice strain as a naturally occurring animal model with a robust adaptation system that resists development of T2DM after high fat diet (HFD) [2]. In light of the pandemic nature of this disease, understanding the disease in both sensitive and resistant animals and discerning possible mechanisms as a way to develop prevention therapies is of utmost importance.
Mice fed for prolonged periods of time with HFD mimic human T2DM pathology [3–5]. Further studies in animals have stressed the link between AMPK complex activation and pathological reduction. When subjected to HFD, mice usually lose sensitivity of the insulin receptors. This causes an abnormal accumulation of glucose and insulin in the bloodstream that is, itself, pathogenic.
AMP-dependent protein kinase (AMPK) is a heterotrimeric protein that plays an important role in energy homeostasis. It has increased activity during exercise and starvation conditions, where it acts to impede energy-consuming processes [6]. Given its properties as an energy sensor, AMPK has been linked to other cellular processes such as cell survival, metabolism, and autophagy (reviewed in [7]). Specifically, AMPK has been linked to glucose metabolism, highlighting its importance in insulin resistance and type 2 diabetes. The ability of AMPK to be the energy control center has prompted its interest as a drug target for T2DM. In particular, thiazolidinedione and metformin, drugs used for the treatment of T2DM, have been shown to increase AMPK phosphorylation [8, 9].
AMPK activators are still vastly understudied. There are two known major activating pathways: AMP-dependent pathway and the Ca++- dependent pathway. Both signaling cascades involve an activating phosphorylation at Thr172 but differ in the kinase involved. The former involves positive allosteric regulation of AMP that allows LKB1 kinase action and accounts for most of the activity of AMPK in the liver and skeletal muscle [6, 10–12]. Hepatic loss of LKB1 leads to near loss of AMPK activity and hyperglycemic states in mice [12]. The Ca++- dependent pathway involves CaMKβ but its effects are primarily in the brain. A third AMPKK has also been found in transforming growth factory-β-activated kinase (TAK1), although the regulating conditions of this pathway are still unclear [13–15]. It is likely that AMPK can be activated through other kinases that have yet to be discovered. Moreover, recent studies have shown that AMPK can be activated through DNA damage, hormones and other physiological stimuli, regardless of the energy state of the cell [6, 16, 17]. Furthermore, the multiple subunits of AMPK leads to a combinatorial regulation that allows for differential tissue expression.
Increased ATP:AMP ratios can lead to dephosphorylation and concomitant deactivation of AMPK. Similarly to the AMP-dependent pathway, decreases in intracellular Ca++, or chronic increased intracellular Ca++, can lead to dephosphorylation of AMPK [18, 19]. AMPK is also vulnerable to negative allosteric regulation when subjected to increasing phosphocreatine levels [20, 21]. Moreover, high glucose is able to negatively affect AMPK activity with no changes in creatine phosphates [22]. Glycogen content can also regulate AMPK activity. Although specific inhibitory and activating conditions are unclear, glycogen content has been inversely correlated to AMPK activity [23]. In muscle, it has also been shown that high glycogen content negatively regulates AMPK activity, through interactions of the glycogen binding domain (GBD) present in the β regulatory subunit [24]. Apart from these mechanisms, negative regulation of AMPK activity was demonstrated through a kinase dead Akt1/Akt2 mouse model [25].
The Murphy Roth Large mouse strain has been shown to have a naturally enhanced basal AMPK activation [26]. This mouse strain heals ear holes made for identification [27]. In the intervening years the mice have been subjected to many other acute injury models which often heal, but sometimes do not, in an apparent pattern-less tissue distribution (reviewed in [28]). Recently it has been identified that the mice are also resistant to the fibrotic aspects of gamma-sarcoglycan mediated muscular dystrophy [29]. In the process of identifying the mechanisms of this superior healing ability we uncovered increases in skeletal muscle pAMPKT172 levels. This led to the hypothesis that the MRL mice may be resistant to HFD-mediated T2DM pathologies. We have recently demonstrated that the MRL mice are resistant to a 12-week HFD feeding protocol [2].
Although MRL mice do gain proportionately equal weight to the C57Bl/6 (B6) control animal strain when both are fed the HFD, they do not develop the characteristic insulin resistance that usually follows prolonged HFD feeding and were also protected from hyperglycemia. These mice have a significantly increased basal activation of pAMPK when compared to strains like B6 and DBA2 (D2), under normal chow-dieting conditions and even higher activation and expression in skeletal muscle when fed a HFD [2]. Of special clinical relevance, the antidiabetic drugs Metformin and TZD target, elevate and activate pAMPK complexes [30, 31]. Given that the liver is an important participant in glucose metabolism, we wanted to explore whether this lack of pathology also extends to the liver at both the tissue and cellular level. We also initiated experiments to identify if the adaptive liver is the effector in systemic resistance to the HFD.
We selected the B6 mouse strain as control because of known differences between this strain and the MRL mouse strain. The B6 mice are highly sensitive to HFD [2, 5, 32]. The B6 mice, which have a Th1 leaning immune response, were more susceptible to adiposity, liver inflammation and liver fibrosis [32]. In addition the C57Bl/6J strain is more susceptible to HFD-induced phenotypes than the closely associated strain C57Bl/6N [33].
For the purpose of this study, 3-week old B6 and MRL mice were randomly assigned a control diet or HFD feeding for 12 weeks. Weekly tests of 6-hour fasted blood glucose were done to monitor systemic metabolic parameters [2]. Unless otherwise noted, mice were fasted for 6 hours prior harvest. Liver biopsies were taken for histological measurements or snap frozen for further analyses. MRL mice show a hepatic increase of basal pAMPKT172, AMPK expression, coupled with a decrease of glycogen content and sporadic ectopic fat deposition, increased expression of Complex II of the Electron Transport Chain, and inhibition of ACC1/2 key regulators for fatty acid synthesis and oxidation in the liver. Consistent with multiple pieces of data, the increased pAMPKT172 in the liver presented as a beneficial adaptation to HFD in the MRL mouse strain.
Materials and Methods
Ethics
Animals were cared for in accordance with the National Institutes of Health Guide for the Care and Use of Laboratory Animals, and by the University of Illinois at Chicago IACUC, protocol number 10–203.
Animal Care
Male C57B/6 (B6, 000664) and MRL/MpJ (MRL, 000486) mice were purchased from Jackson Laboratories. Mice were housed 5 to a cage and kept under standard lightning conditions. At 3 weeks of age, mice were randomly assigned either a regular chow diet (Harlan 7912) or a 60% (by energy) high fat diet (Research Diets D12492) to be fed ad libitum for 12 weeks. At 15 weeks old, mice were short-fasted (~6 hours) and then euthanized for tissue collection for further analysis.
Western Blot
Tissues designated for western blot were harvested and snap frozen in liquid nitrogen. Tissues were lysed and homogenized as described [26]. Modifications to the protocol include a substitution to a 2X RIPA lysis buffer and the addition of two extra centrifugation steps at 10,000g for 5 minutes to reduce the congealed lipid levels found in the liver lysates. Protein concentrations were then quantified with Coomassie Bradford Assay. 20–50 μg of samples were electrophoresed at 4° C and transferred overnight (16 hours, 20V at 4°C). Primary antibodies used are pAMPKT172 (1:2000; Cell Signaling Technology), AMPK (1:2000; Cell Signaling Technology), Glut4 (1:750; Santa Cruz Biotechnology), Glut2 (1:2000, Millipore), HKII (1: 10,000; Millipore), phospho-Glycogen SynthaseS641/S645 (pGS) (1:10,000; Invitrogen), pACC1/2 (1:8,000; Cell Signaling Technology), ACC1/2 (1:8,000; Cell Signaling Technology), OxPhos cocktail (1:2000; AbCam), VDAC (1:7,000; AbCam), pAKT1S473 (1:2000;Cell Signaling Technology), AKT1 (1:2000;Cell Signaling Technology). Bands at predicted sizes were acquired on a ChemiDoc ™ XRS Systems. Optical densities were quantified using Image Lab software and normalized against total protein content acquired through Ponceau S staining or β-actin (1:3000, Sigma Life Science).
qPCR
To quantify differences in mitochondrial/nuclear genome ratios mitochondrial genome Subunit II of Cytochrome C Oxidase was amplified with forward primer 5′-CTACAAGACGCCACAT and reverse primer 5′-GAGAGGGGAGAGCAAT, and the nuclear singly encoded Succinate Dehydrogenase Subunit A was amplified with forward primer 5′-TACTACAGCCCCAAGTCT and reverse primer 5′-TGGACCCATCTTCTATGC. The PCR conditions were: 95°C 10 minutes, then 40 cycles of 95°C for 15 sec and 60°C for 1 minute in a Rotor-Gene Q (Qiagen). Single products for each primer pair were verified with melt curves. The ratio of mitochondrial DNA to nuclear DNA was determined using ΔCt comparisons for each animal [2, 34].
Electron Microscopy
Freshly isolated livers from one animal of each group were delivered to the Electron Microscopy Facility of the UIC Research Resources Core (RRC). Micrographs were captured in a blinded manner at 10,000 and 30,000 magnifications.
Glycogen Analysis
Glycogen content was determined using the acid-hydrolysis method [35]. 5–10mg of snap frozen tissue was boiled (1 hour) in either 2M HCL or 2M NaOH for quantification of glycogen-glucose, measured as glycosyl units, or free glucose, respectively. Sample volumes were then reconstituted and neutralized. Glucose assay reagent was used in a 1:100 volume ratio, and optical density was read at 340nm. Sample glycosyl units concentration was determined with the use of a glucose standard and normalized against both the free glucose sample controls and sample weight.
Histology
For the Hematoxilin and Eosin stain, right lateral and caudate lobes of the liver were put in tissue biopsy cassettes and immersed in 10% neutral buffered formalin for 3–4 days, then transferred to 70% ethanol. For Oil Red Oil staining, a fraction of the caudate lobe was covered in Tissue-Plus® Optimal Cutting Temperature Compound (Fisher HealthCare) and immersed in liquid nitrogen- cooled 2-methyl butane to freeze. Embedded tissue was then sectioned to 10 μm. Samples were sent to UIC RRC - Research Histology and Tissue Imaging Core for histological processing.
Statistics
All data was analyzed with one-way ordinary ANOVA using GraphPad Prism Software Version 6 with a Bonferroni-Sidak post-test for multiple comparison assessment unless otherwise indicated. Reported values are averages with standard error of the mean (AVE ± SEM).
Results
Hepatic AMPK levels directly correlate with insulin sensitivity
We recently demonstrated that the HFD-fed MRL mice remained systemically sensitive to insulin and glucose [2]. We also reported that this mouse model also presents increased AMPK and pAMPKT172 levels in skeletal muscle [26]. Given the well-established effects of AMPK activation therapies in diabetes patients and the role of the liver in glucose metabolism, we hypothesized that pAMPKT172 protein levels in the liver correlated to insulin sensitivity and/or the pathophysiologic resistance to type 2 diabetes mellitus (T2DM) in the MRL mouse.
To investigate the hepatic metabolic effects of high fat diet (HFD) on insulin sensitivity, MRL and C57Bl/6 (B6) mice were put on a 60% HFD for 12 weeks. As control we used a mouse strain that is known to develop insulin resistance after the allotted time period. As AMPK is known as a major energy homeostasis regulator, liver pAMPKT172 protein levels were assessed at the end of the diet intervention. pAMP-KT172 expression was significantly enhanced (p = 0.0112) in livers of HFD-fed MRL, compared to CD MRL mouse livers (Figure 1A). This increase was also significantly higher than that of HFD B6 livers (p=0.0096). The HFD B6 livers trended to increased pAMPKT172 compared to their CD littermates. Of curious note, mice strains that are resistant to diet-induced-obesity ((a) stearoyl-CoA desaturase KO, and overexpression models of (b) uncoupling protein-1 in white adipocytes and (c) uncoupling protein-3 in skeletal muscle) all exhibit increased basal AMPK activity and/or increased pAMPKT172 levels [36–39]. In our study, MRL mice had increased pAMPKT172 expression in control fed mice, when compared to the CD B6 cohort (Figure 1B) and was significantly increased after the dieting protocol.
Figure 1.
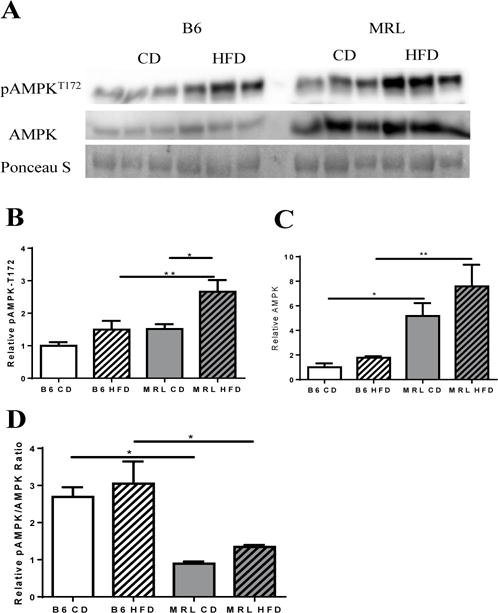
Hepatic expression of AMPK and pAMPKT172. (A) Western blot image of AMPK and pAMPKT172 in liver tissue lysates of each mouse group (normalized to total protein content derived from Ponceau S stain). (B) Densitometry analysis reveals significantly increased pAMPKT172 expression in MRL HFD with no significant changes on their B6 age-pair controls. (C) Densitometry analysis of AMPK reveals significantly increased AMPK in MRL vs B6, with the HFD-fed MRL group expressing a ~5-fold difference when compared with diet-matched B6. (D) Overall changes in the pAMPKT172/AMPK ratio, with both strains showing a marked difference against their diet-matched cohorts. n=5–6; * p <0.05, ** p<0.01. AMP dependent protein kinase (AMPK), phosphorylated AMPK (pAMPKT172).
Although rarely reported, we also assessed the transcriptional changes of hepatic AMPK in the four mouse cohorts (Figure 1C). Between the CD groups the MRL livers demonstrated a trend to increasing AMPK protein levels. Between the HFD groups the MRL livers demonstrated a significant increase in AMPK protein levels. In addition, HFD caused an increasing trend in AMPK in both mouse strains (Figure 1C). Overall energy state represented as a ratio of pAMPKT172: AMPK revealed that, while B6 control presented energy unbalance (ratio >1) MRL mice maintained energy homeostasis (ratio ~1) (Figure 1D). Thus, this reveals that not only pAMPKT172 levels in liver directly correlate to insulin sensitivity but that a degree of balance is maintained in the process.
Downstream effects on lipid metabolism
Our laboratory has previously demonstrated a correlation between increased pAMPKT172 in skeletal muscle and the achievement of systemic normoglycemia in HFD fed MRL mice [2]. To assess the potential role of increased liver pAMPKT172 in insulin sensitivity and achievement of normoglycemia during HFD, we characterized downstream AMPK targets in both control and HFD fed mice.
Acetyl CoA carboxylases (ACC1 and 2) occupy rate-limiting steps in de novo lipogenesis and β-oxidation of lipids. When inhibited by AMPK phosphorylation, malonyl-CoA production is inhibited; lipid synthesis is blocked and a concomitant increase in lipid β-oxidation occurs [40, 41]. Comparing the CD mouse groups demonstrates a significant increase in pACC1/2 in the MRL livers (Figure 2A–B). This indicates an increase of β-oxidation of lipids in the CD MRL livers. In both of the mouse strains HFD decreased the amount of pACC, thereby decreasing the β-oxidation of lipids (Figure 2B). Additionally, a similar pattern was revealed for total ACC content of the livers (Figure 2C). HFD decreased the expression of ACC in both mouse strains and the CD MRL liver cells demonstrated a trend to increased ACC levels over CD B6 liver samples. Thus, basal β-oxidation is likely to be higher in CD MRL mice compared to CD B6 liver cells. Similarly, when pACC1/2 is compared to total ACC1/2 there was a trend to increased β-oxidation in the HFD MRL cells compared to HFD B6 cells (Figure 2D). Consistent with a decreased trend towards β-oxidation, a marked increase in congealed fat was noted in the HFD B6 liver tissue lysate preparations compared to the preparations from the three other groups (data not shown). Tissue mass differences could be ruled out because equal masses were used for the preparations.
Figure 2.
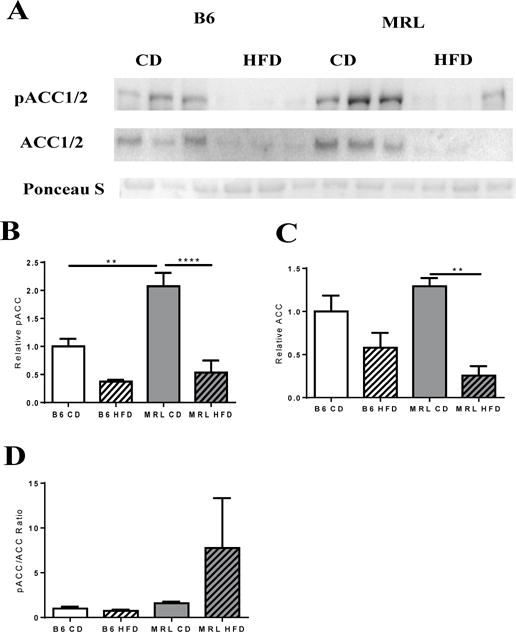
(A) Western blot analysis of ACC and pACC, key metabolic enzymes in lipid metabolism, were assessed. (B) Densitometry analysis of pACC (normalized against total protein content- Ponceau S). Bar graph of relative pACC expression in the different groups shows increased basal oxidation in MRL when compared with B6 mice, with a significant decrease in expression after a HFD in MRL mice. (C) Bar graph of normalized ACC expression shows a significant decrease in ACC expression after the diet intervention period. (D) pACC/ACC ratios relative to each group. n= 3 B6; n=5, MRL; ** p<0.01, **** p<0.0001. Acetyl-CoA carboxylase (ACC), phosphorylated ACC (pACC).
Electron microscopy imaging, and Oil Red O and Hematoxilin and Eosin (H&E) staining (Figure 3A–H; Figure 4A, 4B, respectively) were undertaken to identify ectopic fat. Electron microscopy imaging further shows and validates the increase in ectopic lipid accumulation in HFD B6 livers compared to the other three groups (Figure 3A–D). The HFD MRL livers contained some liver droplets but far fewer, smaller and sporadically distributed, than the HFD B6 livers (Figure 3D and Figure 3B, respectively). Control fed B6 and MRL tissues (Figure 3A and 3C) show little to no lipid deposition. Oil red O staining of livers showed a sporadic distribution of neutral lipid droplets in the HFD MRL, with a more uniform distribution presented in the livers of HFD B6 (Figure 4A). H&E staining revealed lipid-like structures in HFD B6 livers and none in the three other liver images; large images are 10× and insets are 40× original magnification (Figure 4B).
Figure 3.
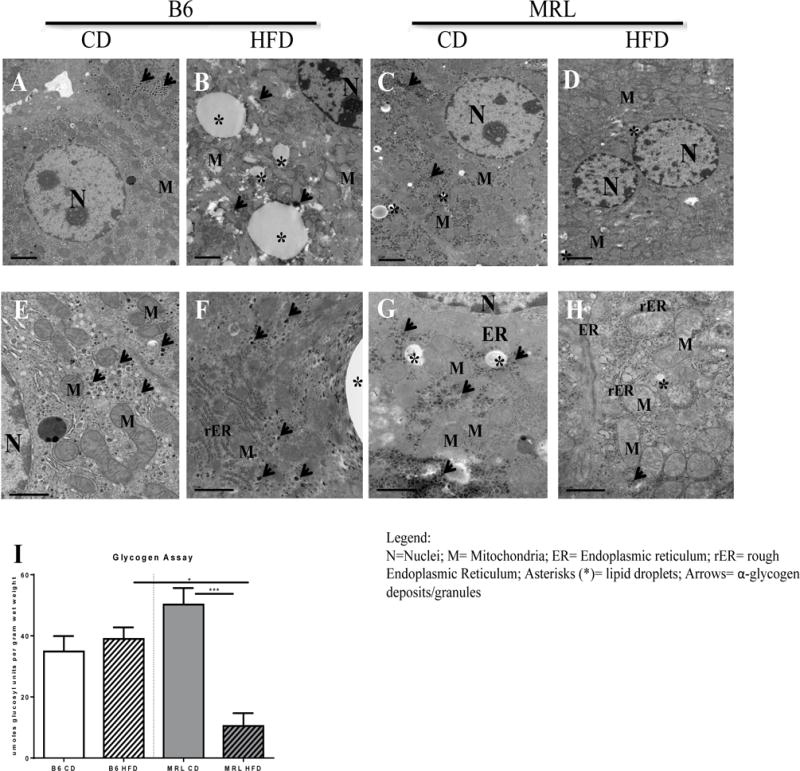
MRL mice are resistant to hepatic fat accumulation and exhibit diminished α-glycogen deposits when subjected to a HFD. (A–H) Transmission electron microscopy images of mice liver biopsies. (A-D) Upper panel shows representative images of lipid deposition in each group at ×10,000 magnification. In contrast to (A) B6 CD controls, the appearance of large lipid droplets, marked with black asterisks, are noted in (B) B6 HFD animals. Some small lipid droplets are seen in the (C) MRL CD but not in the (D) HFD-fed MRL. (E-H) Lower panel shows representative images of α-glycogen deposits, marked with black arrows, at × 30,000 magnification. Abundant α-glycogen deposits are observed throughout the cell in (E) B6 CD control, (F) B6 HFD and (G) MRL CD. In contrast, presence of α-glycogen deposits in (H) MRL HFD mice was rare. (I)Hepatocyte glycogen deposits were quantified and glycogen stores were significantly lower in the MRL HFD-mice. * p <0.001 ***, 0.05 > p >0.0001.
Figure 4.
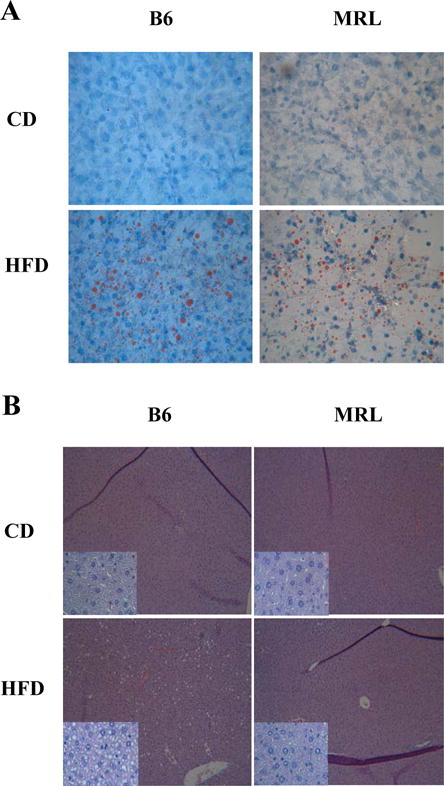
Representative images of ectopic fat in the liver in each mouse group. While B6 show the characteristic ectopic lipid accumulation in the liver after a prolonged high-fat diet protocol period, MRL HFD-fed mice show decreased lipid accumulated in the liver when compared to B6 HFD control. (A) Oil Red O histology staining of each mouse group. Neutral lipid droplets are seen in red. Upper panels show representative image of control-fed B6 and MRL mice. Lower panels show representative image of HFD B6 and MRL mice. 40× magnification (B) Hematoxylin and eosin staining of liver slides shows lipid-like structures distributed across the B6 HFD mice liver cells but not in either CD-fed mouse strains nor in the MRL HFD-fed mice. 10× magnification, insets: 40× magnification.
These observations corroborate that the MRL livers metabolize the excess fat and do not pathologically store fat. However, the HFD MRL mice demonstrate some similarities to the HFD sensitive B6 mice. MRL mice gained proportionally equal fat-weight to the HFD B6 mice [2]. Similarly, when liver sections were stained with Oil Red O both livers from HFD fed mice indicated neutral lipid deposits (Figure 4A) although frequency of neutral lipid droplets was higher in HFD B6 than in HFD MRL. No attempt at histologic quantification was done.
Downstream effects on glucose metabolism
Based on the observations that HFD MRL mice were resistant to hyperglycemia, we sought to observe the effects of HFD on glucose metabolism. Expression levels of hexokinase II (HKII), a rate-limiting kinase in the glycolysis pathway, were unchanged in the two MRL groups, and trended to an increase in the HFD B6 compared to the CD B6 mice (Figure 5A, 5B). We also assessed the levels of the cellular membrane glucose transporters Glut2 and Glut4. There was a significant decrease of Glut2 in the HFD B6 livers compared to the CD B6 livers, while the MRL groups did not reveal any changes (Figure 5A, 5C). Glut4 protein levels were slightly lower, but non-significant (p=0.0534) in HFD B6 animals when compared to control B6 (Figure 5A, 5D). Basal Glut4 of CD MRL livers was significantly lower than that CD B6 (p=0.0087), and this pattern was sustained after the feeding protocol.
Figure 5.
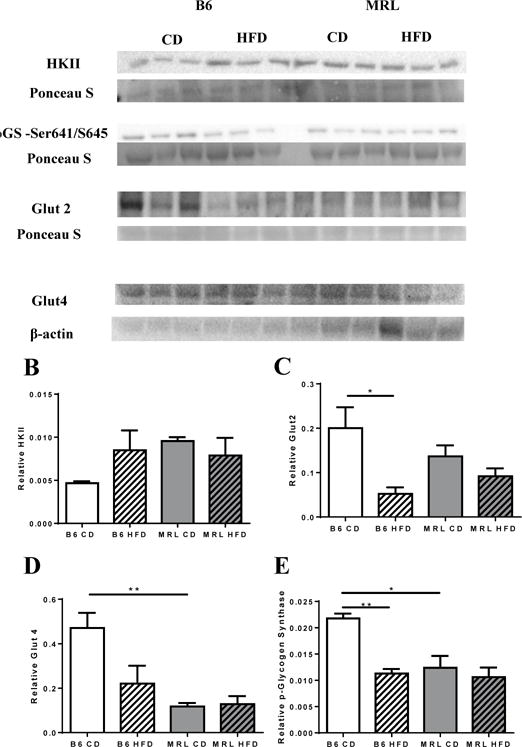
MRL HFD mice do not have altered glucose oxidation, Glut2, Glut4 and pGlycogen SynthaseSer641/645 protein expression. (A) Western blot of liver lysates from B6 and MRL mice in CD and HFD conditions showing levels of Hexokinase II, Glut2, Glut4, and pGlycogen SynthaseSer641/645 with respective loading controls used for quantification. (B) Hexokinase II levels were unchanged in MRL, with a trend to increase in B6 HFD mice. (C) Glut2 is significantly lower in B6 HFD but it is not altered in MRL HFD. (D) Quantification shows a significantly lower basal Glut4 expression in the lysates of MRL CD, and expression level remains unaltered after a HFD. (E) pGlycogen SynthaseSer641/645 was decreased in B6 HFD mice, with no change observed in MRL mice. n=3 each; * p <0.05, ** p<0.01.
Glycogen stores can play a role in the maintenance of normoglycemic conditions [42, 43]. To examine whether the normoglycemic conditions, found in the HFD MRL mice, reflected changes in glycogen storages, liver glycogen content was quantified after the 12 week diet protocol. After a 6 hour fast, it was discovered that glycogen stores of HFD-fed MRL mice were drastically reduced (Figure 3I, p=0.0009). Moreover, electron microscopy images (Figure 3 E–H) validated this observation. α-glycogen granule deposits were seen in both control fed B6 and MRL (Figure 4E, 4G, respectively) and HFD-fed B6 mice (Figure 4F). In stark contrast, α-glycogen deposits were rarely found in HFD-fed MRL mice (Figure 4H). Furthermore, phosphorylated glycogen synthase (pGSSer461/645) levels were also assessed in the four mouse groups (Figure 5A). In these comparisons, HFD B6 livers were trending to decreased pGS compared to the other three mouse groups. Indicating decreased GS activity in the CD B6 livers. In contrast, in the MRL groups, pGSSer461/645 levels remain unchanged after the diet intervention period (Figure 5E). Overall, MRL HFD mice showed unchanged glucose-associated metabolic changes at the protein levels that may play a role in substrate metabolism that enables the MRL-HFD to manipulate the lower dietary glucose and the glycogen-derived glucose into normoglycemic conditions.
Liver mitochondrial content and electron transport chain composition
We also assessed the amount of various mitochondrial markers in the livers from the four mouse groups. We assessed the protein levels of the voltage-dependent anion channel (VDAC1) by western blotting and demonstrated a significant increase in HFD MRL livers compared to HFD B6 (Figure 6A). CD MRL livers trended to a higher basal VDAC expression than the CD B6.
Figure 6.
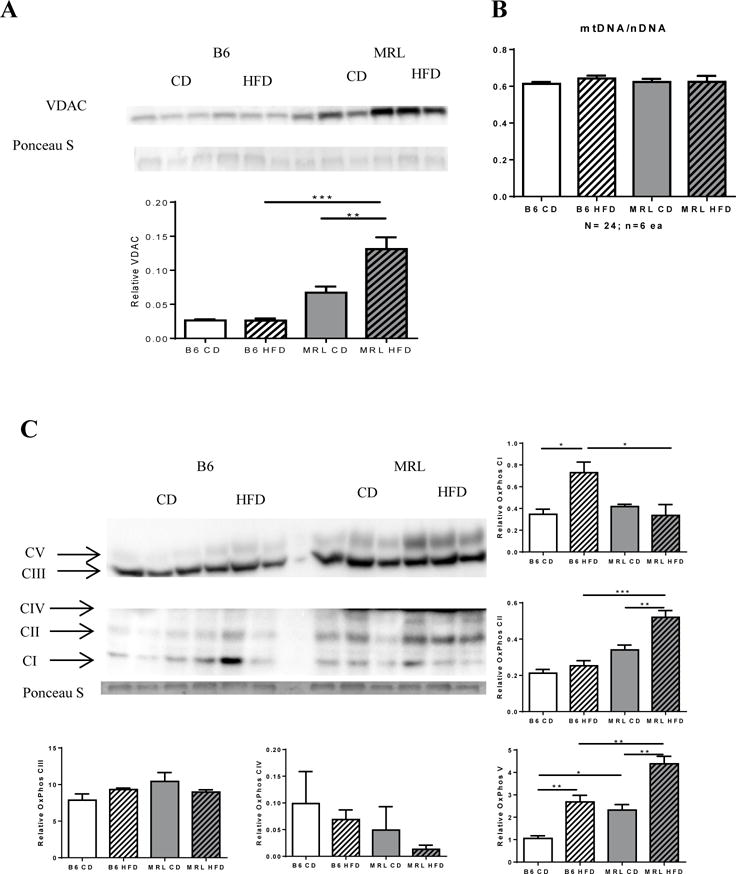
MRL hepatocytes have increased mitochondrial proteins but not increased mitochondrial DNA. Liver lysates were western blotted and assessed for the mitochondrial protein Voltage-dependent anion channel (VDAC). (A) MRL mice have increased VDAC expression after HFD. (B) Quantification of mitochondrial DNA content over nuclear DNA through real time qPCR yielded no difference in mitochondrial content. (C) Further analysis on expression levels on oxidative phosphorylation chain proteins showed differential expression of proximal complexes I and II subunits between the two strains. Distal complexes III and IV subunits do not change in either strain, while nuclear encoded complex V subunit increases in both strains, with the MRL mice maintaining a higher basal expression. n=6−3; * p <0.05, ** p<,0.01 0.001 *** > p >0.0001.
To determine whether this was due to increased mitochondrial volume, we assessed if there was an increase in mitochondrial DNA through Real Time qPCR. The mitochondrial encoded Cytochrome C compared to the nuclear encoded succinate dehydrogenase subunit A DNA ratios were unchanged (Figure 6B). This indicates that the increase in VDAC protein expression was not due to an increase in mitochondrial content but to an increase in mitochondrial surface area. This is consistent with unusual MRL mitochondrial morphology reported in literature [44]).
The observation that MRL liver cells have an increased ratio of mitochondrial proteins compared to B6 mice but no differences between the two strains were identified for mitochondrial genome ratios prompted us to investigate mitochondrial electron chain transport proteins. The effects of diet intervention on the electron chain transport proteins were assessed with an OxPhos cocktail antibody (Figure 6 C). HFD differentially influenced OxPhos protein content in the two mice strains. Most notably, HFD B6 mice had significantly increased Complex I subunit expression while HFD MRL mice had a notable Complex II subunit expression increase compared to their CD counterparts (Figure 6C, p=0.0275; 9F, p=0.0098 respectively). In both cases, HFD-response was significant when comparing the insulin resistant B6 and the insulin sensitive MRL. Furthermore, a significant difference in ATPase synthase (Complex V) basal expression was observed in control-fed mice. CD MRL had a ~2-fold higher basal expression of ATP synthase when compared with CD B6 livers. After the diet intervention period, both strains showed significant increases in the Complex V protein, with the MRL HFD mice maintaining ~1.4 fold higher expression No significant changes were observed in Complex III or Complex IV subunits of the electron chain transport (Figure 5C).
Upstream effectors of AMPK
Given the HFD MRL mouse’s insulin hypersensitiveness our lab previously reported [2] and the role of insulin in AMPK inhibition, we wanted to assess one of the upstream effectors of AMPK. The canonical insulin receptor pathway induces Akt activation in insulin sensitive individuals, with concomitant decrease in activated pAMPKT172 and deactivation of AMPK complexes [20]. There is evidence that Akt is able to regulate intracellular ATP levels to act as a negative regulator of the AMPK to bypass mTOR inhibition in vivo [25]. Therefore, the four mouse groups were assessed for pAKT-Ser473 expression (Figure 7A–D) with western blotting. When comparing the high fat diet groups, it was shown that MRL mice showed a higher expression level of pAKTSer473, with opposite, albeit non-significant, trends observed from intrastrain changes in the CD cohorts (Figure 7B). Akt-1 levels, however, were significantly reduced in both strains after 12 weeks of HFD (Figure 7C). Overall, pAKT-1Ser473: Akt-1 ratios show a significant increase in MRL HFD vs CD animals, with no significant change observed between the B6 cohorts. This observed increase in the potential inhibitory AMPKK did not, however, correlate to decreased pAMPKT172 levels (Figure1). In fact, high pAMPKT172 expression was maintained in the HFD MRL livers despite the increased pAKTSer473 levels.
Figure 7.
Akt was upregulated after a high-fat feeding protocol. Liver lysates were western blotted and assessed for protein kinase B (Akt) and pAktS473 levels. (A) Density of bands was taken and normalized against Ponceau S stained bands. (B) When compared to diet-matched control (B6 HFD), MRL mice show an increase in Akt-1 phosphorylation. (C) However, both strains show a significant decrease in basal Akt-1 after 12 weeks of diet intervention. (D) Overall, MRL mice subjected to HFD presented a greater ratio of phosphorylated: dephosphorylated Akt-1. n=3; each; * p <0.05, ** p<0.01
Discussion
We have identified a beneficial hepatic adaptation in MRL mice during a HFD feeding protocol. HFD inflicts nutritional stresses on the organism and makes it prone to developing metabolic-related diseases. Hallmarks of these diseases include obesity, insulin resistance, hyperglycemia, ectopic fat, inflammation and cardiac remodeling. Insulin resistance has been inversely correlated with pAMPK levels. Increased pAMPK results in alterations in metabolic signaling pathways in liver and skeletal muscle tissues. This appears to contribute to systemic improvement of glucose handling and insulin sensitivity. Though, the underlying cause behind the enhanced basal AMPK expression in the MRL mice is not well-understood. This seems to be the proximal cause for the MRL’s ability to resist metabolic-associated pathologies at both the organ and systemic levels.
Response to a HFD in the MRL mice resulted in increased pAMPKT172 expression, with distinct members of its downstream signaling pathway being affected. Specifically, players of the glucose metabolism pathway like HKII, pGS and glucose transporters Glut2 and Glut4 levels are maintained in the HFD MRL mice. In contrast, HFD negatively affected changes on these proteins in the control mouse strain B6; possibly due to the lack of increased pAMPKT172. It was surprising when glycogen content in the healthy HFD MRL mice was diminished, as this has been associated with states of hypoglycemia and impaired glucose cycling. The HFD MRL mice remained normoglycemic when weekly blood glucose was monitored. In addition to this, HFD MRL mice show a clear attenuation of ectopic fat in the liver after a 12-week diet. Coupled with currently identified sporadic lipid droplet distribution observed by EM in the liver, MRL liver cells have previously shown to have decreased fatty acid oxidation [34]. Now, we demonstrate that MRL liver cells after HFD show an opposite trend; they have decreased de novo lipogenesis and increased beta oxidation with decreased lipid droplets accumulation. Given the reported glycolytic nature of MRL mitochondria [34], a high fat diet where the dietary sugars are reduced from ~60% kcal in a CD to ~20% kcal in a HFD could essentially be starving the MRL cells of energy, as opposed to oversupplying it. The observed sustained expression of glucose pathway proteins in an environment where it has reduced dietary glucose available in a predominantly glycolytic organism implies subtle levels of dynamism of the glucose metabolism that we are unable to observe in a static environment. The resistance to steatosis in the liver of MRL HFD could thus be the MRL oxidizing the otherwise ectopic fat to compensate for the carbohydrate-derived energy deficit.
While mtDNA content is not affected in either strain, MRL show an increase in mitochondrial membrane markers and basal electron chain transport members. Reported activity of the electron transport chain (ETC) members of MRL liver mitochondria show reduced activity in distal members Complex III and Complex IV- but not Complex I or Complex II -compared to B6 complex activities under normal conditions [34]. It is unknown if this effect persists under HFD conditions. Further analysis into expression of the electron transport chain reveals increases in the Complex II member and a member of the ATPase synthase expression in HFD MRL mice compared to HFD B6 and CD MRL cohorts. HFD B6 mice, in contrast, show increased expression of the Complex I member and the ATPase synthase member compared to their CD B6 controls. The fact that MRL had unchanged Complex I subunit expression is of special interest. Metformin, an anti-diabetic drug, targets and inhibits Complex I, which results in an increase of the AMP/ATP ratio with the concomitant AMPK activation [30]. The MRL pAMPK activation mechanism identifies a different AMPK activation mechanism than that of Metformin occurring in vivo. Moreover, Complex II subunit has a parallel function to that of Complex I, but has an overall decrease energy production as it does not relocate protons to the intermembrane space of the mitochondria. Therefore, this suggests insufficient energy production in the mitochondria as the means to the protective AMPK increase and beneficial hepatic adaptations.
Curiously, increases in the inhibitory AMPKK Akt in the HFD MRL livers did not correlate to lower levels of pAMPKT172, suggesting that AMPK is overriding inhibitory- and possibly hormonal- regulation. Due to the ability of AMPK to bind glycogen [24] and its function as an energy sensor, this low glycogen could be, potentially, decreasing the dephosphorylation probability of pAMPKT172, essentially locking AMPK in an activated state through allosteric interactions. However, as each cell would have different levels of ‘less dense’ glycogen associated with AMPK, we postulate that there would not be equal AMPK binding across the tissue. This lack of homogeneity in AMPK binding could account for the patchy distribution of neutral lipid deposition seen in MRL HFD Oil red O staining (Figure 4B) and the ensuring metabolic mosaicism. Further studies would need to be done to address the connection between normoglycemic state, glycogen contents and AMPK level changes during nutritional intervention in the MRL mice.
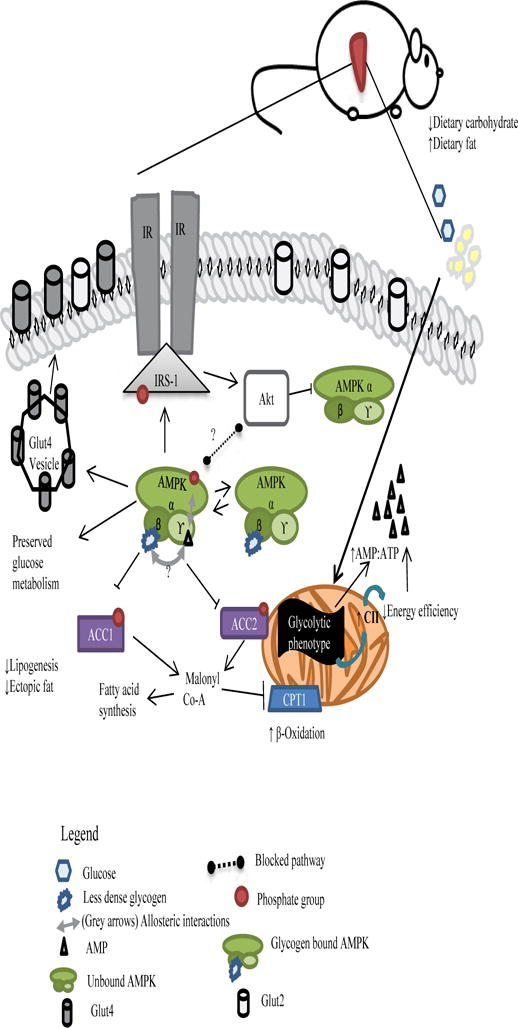
A schematic of our thoughts on mitochondrial-AMPK interplay and mechanistic actions of pAMPK in HFD MRL liver cells is shown in Figure 8. Due to its glycolytic phenotype, MRL mitochondria preferentially utilize all available glucose. As a consequence of the decrease in dietary carbohydrates, glycogen stores are depleted unusually fast to compensate for the dietary deficit. This leads to an initial increase in intracellular AMP. Positive allosteric regulation of AMPK via AMP leads to its phosphorylation and concomitant activation. As a result, phosphorylation of downstream effectors enables the shutdown of lipogenesis and the increase of fatty acid oxidation. These last two actions are prohibiting to ectopic fat inside hepatocytes. Meanwhile, a slight increase in Akt-1S473 phosphorylation is observed that is significant against the HFD B6. While usually of parallel pathways, recent evidence in rodent hearts and in vitro studies have shown evidence of inactivating phosphorylation of AMPK via Akt [45, 46]. We postulate that this is so in this pathway, but that the diminished glycogen stores serve as a ‘starving’ signal that overrides the Akt inhibition process. Taking into consideration the observed patchy lipid droplets and that not all cells will hold a 1:1 ratio of the glycogen: pAMPK pool, only unbound pAMPK will be subjected to inactivating dephosphorylation. At this stage, and perhaps due to their normoglycemic status, we can observe an unaltered glucose metabolism of a seemingly homeostatic system.
Figure 8.
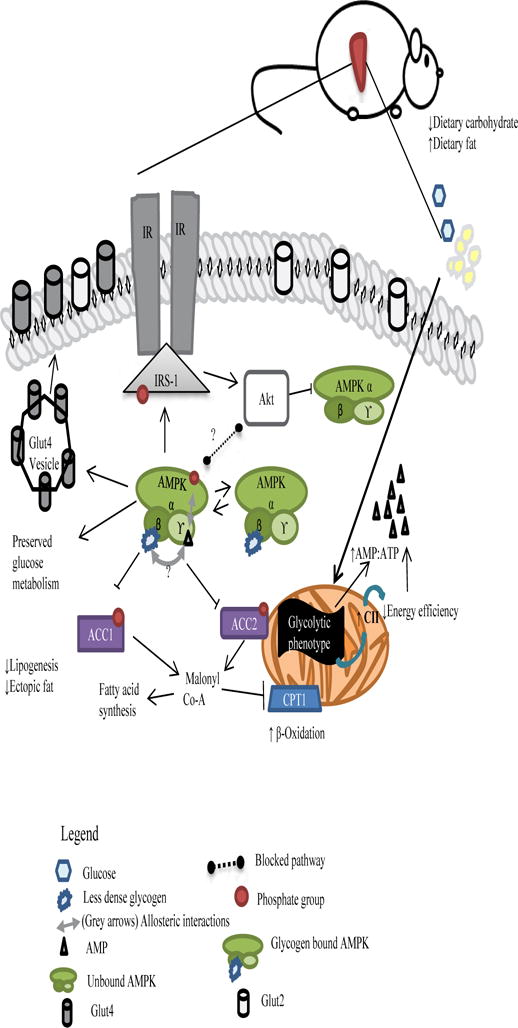
Proposed pathway for MRL hepatic adaptations after a 12-week ~60% HFD occurring in the post-absorptive stage induced by a short fast. pAMPK expression is induced through initial AMP:ATP molecule and is perpetuated by existing dietary energy source deficit and depleted glycogen signals.
Conclusions
The Murphy Roth Large mouse is a unique mammalian model of regeneration and, recently, insulin sensitivity. Metabolic adaptation to a high fat diet occurs in both skeletal muscle and hepatic cells. These tissues in the MRL mice show metabolic flexibility that could enable its unique ability to regenerate. Specifically, these metabolic adaptations that are now reported could also positively affect the ear wound healing and lack of muscular dystrophy mediated fibrosis when one considers the role of AMPK as an anti-fibrosis molecule. Furthermore, activation of AMPK complexes is a common result of anti-diabetic drugs which further cements the use of this mouse model as highly resistant to diet-induced insulin resistance and pathology. Changes in mitochondrial electron chain transport complex members suggest that the increases in basal AMPK, and pAMPK levels, derive as a result of an energy deficit in an oversupplied environment. As preferred glycolytic cells, lowering dietary carbohydrates essentially starves the cell of its preferred energy substrate, leading to decreased energy supply regardless of the dietary lipids present. As compensation, the MRL liver cells utilize hepatic deposits of fat while inhibiting de novo fat from forming. This resistance to acquiring or forming lipid droplets suggests that this mouse is also resistant to non-alcoholic fatty liver pathology. The MRL liver cells also break down their glycogen faster, although if this is utilized by the liver or other tissues remain to be seen.
Acknowledgments
This work in supported by an NIH grant; RHL102322.
Abbreviations
- AMPK
AMP-activated protein kinase
- ACC
acetyl-CoA carboxylase
- AUC
area under the curve
- B6
C57BL/6 J mouse strain
- CD
chow diet
- GTT
glucose tolerance test
- HFD
high fat diet
- ITT
insulin tolerance test
- MRL
MRL/MpJ mouse strain
- T2DM
type 2 diabetes mellitus
- VDAC
voltage-dependent anion channel
Footnotes
Conflicts
The authors have no conflicts, financial or otherwise to declare.
References
- 1.Fujii N, et al. AMP-activated protein kinase alpha2 activity is not essential for contraction- and hyperosmolarity-induced glucose transport in skeletal muscle. J Biol Chem. 2005;280(47):39033–41. doi: 10.1074/jbc.M504208200. [DOI] [PubMed] [Google Scholar]
- 2.Mull AJ, et al. The Murphy Roths Large (MRL) mouse strain is naturally resistant to high fat diet-induced hyperglycemia. Metabolism, Clinical and Experimental. 2014 doi: 10.1016/j.metabol.2014.09.007. [DOI] [PMC free article] [PubMed] [Google Scholar]
- 3.Calligaris SD, et al. Mice long-term high-fat diet feeding recapitulates human cardiovascular alterations: an animal model to study the early phases of diabetic cardiomyopathy. PLoS One. 2013;8(4):e60931. doi: 10.1371/journal.pone.0060931. [DOI] [PMC free article] [PubMed] [Google Scholar]
- 4.Guo S. Insulin signaling, resistance, and the metabolic syndrome: insights from mouse models into disease mechanisms. J Endocrinol. 2014;220(2):T1–T23. doi: 10.1530/JOE-13-0327. [DOI] [PMC free article] [PubMed] [Google Scholar]
- 5.Heydemann A. An Overview of Murine High Fat Diet as a Model for Type 2 Diabetes Mellitus. J Diabetes Res. 2016:2902351. doi: 10.1155/2016/2902351. [DOI] [PMC free article] [PubMed] [Google Scholar]
- 6.Hardie DG. AMPK: positive and negative regulation, and its role in whole-body energy homeostasis. Curr Opin Cell Biol. 2014;33C:1–7. doi: 10.1016/j.ceb.2014.09.004. [DOI] [PubMed] [Google Scholar]
- 7.Beauloye C, et al. AMPK activation, a preventive therapeutic target in the transition from cardiac injury to heart failure. Cardiovasc Res. 2011;90(2):224–33. doi: 10.1093/cvr/cvr034. [DOI] [PubMed] [Google Scholar]
- 8.Konrad D, et al. Troglitazone causes acute mitochondrial membrane depolarisation and an AMPK-mediated increase in glucose phosphorylation in muscle cells. Diabetologia. 2005;48(5):954–66. doi: 10.1007/s00125-005-1713-7. [DOI] [PubMed] [Google Scholar]
- 9.Viollet B, et al. Cellular and molecular mechanisms of metformin: an overview. Clin Sci (Lond) 2012;122(6):253–70. doi: 10.1042/CS20110386. [DOI] [PMC free article] [PubMed] [Google Scholar]
- 10.Kahn BB, et al. AMP-activated protein kinase: ancient energy gauge provides clues to modern understanding of metabolism. Cell Metab. 2005;1(1):15–25. doi: 10.1016/j.cmet.2004.12.003. [DOI] [PubMed] [Google Scholar]
- 11.Sakamoto K, et al. Deficiency of LKB1 in skeletal muscle prevents AMPK activation and glucose uptake during contraction. EMBO J. 2005;24(10):1810–20. doi: 10.1038/sj.emboj.7600667. [DOI] [PMC free article] [PubMed] [Google Scholar]
- 12.Shaw RJ, et al. The kinase LKB1 mediates glucose homeostasis in liver and therapeutic effects of metformin. Science. 2005;310(5754):1642–1646. doi: 10.1126/science.1120781. [DOI] [PMC free article] [PubMed] [Google Scholar]
- 13.Momcilovic M, Hong SP, Carlson M. Mammalian TAK1 activates Snf1 protein kinase in yeast and phosphorylates AMP-activated protein kinase in vitro. The Journal of biological chemistry. 2006;281(35):25336–25343. doi: 10.1074/jbc.M604399200. [DOI] [PubMed] [Google Scholar]
- 14.Inokuchi-Shimizu S, et al. TAK1-mediated autophagy and fatty acid oxidation prevent hepatosteatosis and tumorigenesis. The Journal of clinical investigation. 2014;124(8):3566–3578. doi: 10.1172/JCI74068. [DOI] [PMC free article] [PubMed] [Google Scholar]
- 15.Fu X, et al. Etoposide induces ATM-dependent mitochondrial biogenesis through AMPK activation. PLoS One. 2008;3(4):e2009. doi: 10.1371/journal.pone.0002009. [DOI] [PMC free article] [PubMed] [Google Scholar]
- 16.Wu CL, et al. Role of AMPK in UVB-induced DNA damage repair and growth control. Oncogene. 2013;32(21):2682–2689. doi: 10.1038/onc.2012.279. [DOI] [PMC free article] [PubMed] [Google Scholar]
- 17.Yamauchi T, et al. Adiponectin stimulates glucose utilization and fatty-acid oxidation by activating AMP-activated protein kinase. Nat Med. 2002;8(11):1288–1295. doi: 10.1038/nm788. [DOI] [PubMed] [Google Scholar]
- 18.Hawley SA, et al. 5′-AMP activates the AMP-activated protein kinase cascade, and Ca2+/calmodulin activates the calmodulin-dependent protein kinase I cascade, via three independent mechanisms. The Journal of biological chemistry. 1995;270(45):27186–27191. doi: 10.1074/jbc.270.45.27186. [DOI] [PubMed] [Google Scholar]
- 19.Park S, Scheffler TL, Gerrard DE. Chronic high cytosolic calcium decreases AICAR-induced AMPK activity via calcium/calmodulin activated protein kinase II signaling cascade. Cell Calcium. 2011;50(1):73–83. doi: 10.1016/j.ceca.2011.05.009. [DOI] [PubMed] [Google Scholar]
- 20.Viollet B, et al. AMPK inhibition in health and disease. Critical reviews in biochemistry and molecular biology. 2010;45(4):276–295. doi: 10.3109/10409238.2010.488215. [DOI] [PMC free article] [PubMed] [Google Scholar]
- 21.Ponticos M, et al. Dual regulation of the AMP-activated protein kinase provides a novel mechanism for the control of creatine kinase in skeletal muscle. The EMBO journal. 1998;17(6):1688–1699. doi: 10.1093/emboj/17.6.1688. [DOI] [PMC free article] [PubMed] [Google Scholar]
- 22.Itani SI, et al. Glucose autoregulates its uptake in skeletal muscle: involvement of AMP-activated protein kinase. Diabetes. 2003;52(7):1635–1640. doi: 10.2337/diabetes.52.7.1635. [DOI] [PubMed] [Google Scholar]
- 23.Steinberg GR, et al. Reduced glycogen availability is associated with increased AMPKalpha2 activity, nuclear AMP-Kalpha2 protein abundance, and GLUT4 mRNA expression in contracting human skeletal muscle. Applied physiology, nutrition, and metabolism = Physiologie appliquee, nutrition et metabolisme. 2006;31(3):302–312. doi: 10.1139/h06-003. [DOI] [PubMed] [Google Scholar]
- 24.McBride A, et al. The glycogen-binding domain on the AMPK beta subunit allows the kinase to act as a glycogen sensor. Cell metabolism. 2009;9(1):23–34. doi: 10.1016/j.cmet.2008.11.008. [DOI] [PMC free article] [PubMed] [Google Scholar]
- 25.Hahn-Windgassen A, et al. Akt activates the mammalian target of rapamycin by regulating cellular ATP level and AMPK activity. The Journal of biological chemistry. 2005;280(37):32081–32089. doi: 10.1074/jbc.M502876200. [DOI] [PubMed] [Google Scholar]
- 26.Berhanu TK, et al. Increased AMP-activated protein kinase in skeletal muscles of Murphy Roth Large mice and its potential role in altered metabolism. Physiological Reports. 2014;2(3) doi: 10.1002/phy2.252. [DOI] [PMC free article] [PubMed] [Google Scholar]
- 27.Clark LD, Clark RK, Heber-Katz E. A new murine model for mammalian wound repair and regeneration. Clin Immunol Immunopathol. 1998;88(1):35–45. doi: 10.1006/clin.1998.4519. [DOI] [PubMed] [Google Scholar]
- 28.Heydemann A. The super super-healing MRL mouse strain. Front Biol (Beijing) 2012;7(6):522–538. doi: 10.1007/s11515-012-1192-4. [DOI] [PMC free article] [PubMed] [Google Scholar]
- 29.Heydemann A, et al. The superhealing MRL background improves muscular dystrophy. Skelet Muscle. 2012;2(1):26. doi: 10.1186/2044-5040-2-26. [DOI] [PMC free article] [PubMed] [Google Scholar]
- 30.Gong L, et al. Metformin pathways: pharmacokinetics and pharmacodynamics. Pharmacogenetics and genomics. 2012;22(11):820–827. doi: 10.1097/FPC.0b013e3283559b22. [DOI] [PMC free article] [PubMed] [Google Scholar]
- 31.Stephenne X, et al. Metformin activates AMP-activated protein kinase in primary human hepatocytes by decreasing cellular energy status. Diabetologia. 2011;54(12):3101–3110. doi: 10.1007/s00125-011-2311-5. [DOI] [PMC free article] [PubMed] [Google Scholar]
- 32.Jovicic N, et al. Differential Immunometabolic Phenotype in Th1 and Th2 Dominant Mouse Strains in Response to High-Fat Feeding. PLoS One. 2015;10(7):e0134089. doi: 10.1371/journal.pone.0134089. [DOI] [PMC free article] [PubMed] [Google Scholar]
- 33.Fontaine DA, Davis DB. Attention to Background Strain Is Essential for Metabolic Research: C57BL/6 and the International Knockout Mouse Consortium. Diabetes. 2016;65(1):25–33. doi: 10.2337/db15-0982. [DOI] [PMC free article] [PubMed] [Google Scholar]
- 34.Naviaux RK, et al. Retained features of embryonic metabolism in the adult MRL mouse. Mol Genet Metab. 2009;96(3):133–44. doi: 10.1016/j.ymgme.2008.11.164. [DOI] [PMC free article] [PubMed] [Google Scholar]
- 35.Zhang P. Analysis of Mouse Liver Glycogen Content. Bio-protocol. 2012;2:e186. [Google Scholar]
- 36.Hardie DG. AMPK a key regulator of energy balance in the single cell and the whole organism. International journal of obesity. 2008;32(4):7–12. doi: 10.1038/ijo.2008.116. [DOI] [PubMed] [Google Scholar]
- 37.Dobrzyn P, et al. Stearoyl-CoA desaturase 1 deficiency increases fatty acid oxidation by activating AMP-activated protein kinase in liver. Proceedings of the National Academy of Sciences of the United States of America. 2004;101(17):6409–6414. doi: 10.1073/pnas.0401627101. [DOI] [PMC free article] [PubMed] [Google Scholar]
- 38.Matejkova O, et al. Possible involvement of AMP-activated protein kinase in obesity resistance induced by respiratory uncoupling in white fat. FEBS letters. 2004;569(1–3):245–248. doi: 10.1016/j.febslet.2004.06.002. [DOI] [PubMed] [Google Scholar]
- 39.Schrauwen P, et al. Improved glucose homeostasis in mice overexpressing human UCP3: a role for AMP-kinase? International journal of obesity and related metabolic disorders: journal of the International Association for the Study of Obesity. 2004;28(6):824–828. doi: 10.1038/sj.ijo.0802629. [DOI] [PubMed] [Google Scholar]
- 40.Hardie DG, Pan DA. Regulation of fatty acid synthesis and oxidation by the AMP-activated protein kinase. Biochemical Society transactions. 2002;30(6):1064–1070. doi: 10.1042/bst0301064. [DOI] [PubMed] [Google Scholar]
- 41.Wakil SJ, Abu-Elheiga LA. Fatty acid metabolism: target for metabolic syndrome. Journal of lipid research. 2009;50:138–143. doi: 10.1194/jlr.R800079-JLR200. [DOI] [PMC free article] [PubMed] [Google Scholar]
- 42.Rizza RA. Pathogenesis of fasting and postprandial hyperglycemia in type 2 diabetes: implications for therapy. Diabetes. 2010;59(11):2697–707. doi: 10.2337/db10-1032. [DOI] [PMC free article] [PubMed] [Google Scholar]
- 43.Shah P, et al. Lack of suppression of glucagon contributes to postprandial hyperglycemia in subjects with type 2 diabetes mellitus. The Journal of clinical endocrinology and metabolism. 2000;85(11):4053–4059. doi: 10.1210/jcem.85.11.6993. [DOI] [PubMed] [Google Scholar]
- 44.Naviaux RK, et al. Retained features of embryonic metabolism in the adult MRL mouse. Molecular genetics and metabolism. 2009;96(3):133–144. doi: 10.1016/j.ymgme.2008.11.164. [DOI] [PMC free article] [PubMed] [Google Scholar]
- 45.Hawley SA, et al. Phosphorylation by Akt within the ST loop of AMPK-alpha1 down-regulates its activation in tumour cells. The Biochemical journal. 2014;459(2):275–287. doi: 10.1042/BJ20131344. [DOI] [PMC free article] [PubMed] [Google Scholar]
- 46.Kovacic S, et al. Akt activity negatively regulates phosphorylation of AMP-activated protein kinase in the heart. J Biol Chem. 2003;278(41):39422–39427. doi: 10.1074/jbc.M305371200. [DOI] [PubMed] [Google Scholar]


