Abstract
Purpose
To compare the effect of elevated intraocular pressure (IOP) on retinal capillary filling in elderly vs adult rats using optical coherence tomography angiography (OCTA).
Methods
The IOP of elderly (24-month-old, N = 12) and adult (6–8 month-old, N = 10) Brown Norway rats was elevated in 10 mmHg increments from 10 to 100 mmHg. At each IOP level, 3D OCT data were captured using an optical microangiography (OMAG) scanning protocol and then post-processed to obtain both structural and vascular images. Mean arterial blood pressure (MAP), respiratory rate, pulse and blood oxygen saturation were monitored non-invasively throughout each experiment. Ocular perfusion pressure (OPP) was calculated as the difference between MAP for each animal and IOP at each level. The capillary filling index (CFI), defined as the ratio of area occupied by functional capillary vessels to the total scan area but excluding relatively large vessels of > 30 μm, was calculated at each IOP level and analyzed using the OCTA angiograms. Relative CFI vs IOP was plotted for the group means. CFI vs OPP was plotted for every animal in each group and data from all animals were combined in a CFI vs OPP scatter plot comparing the two groups.
Results
The MAP in adult animals was 108 ± 5 mmHg (mean±SD), whereas this value in the elderly was 99±5 mmHg. All other physiologic parameters for both age groups were uniform and stable. In elderly animals, significant reduction of the CFI was first noted at IOP 40 mmHg, as opposed to 60 mmHg in adult animals. Individual assessment of CFI as a function of OPP for adult animals revealed a consistent plateau until OPP reached between 40 – 60 mmHg. Elderly individuals demonstrated greater variability, with many showing a beginning of gradual deterioration of CFI at an OPP as high as 80 mmHg. Overall comparison of CFI vs OPP between the two groups was not statistically significant.
Conclusions
Compared to adults, some, but not all, elderly animals demonstrate a more rapid deterioration of CFI vs OPP. This suggests a reduced autoregulatory capacity that may contribute to increased glaucoma susceptibility in some older individuals. This variability must be considered when studying the relationship between IOP, ocular perfusion and glaucoma in elderly animal models.
Keywords: Retinal capillary blood flow, Intra-ocular pressure, Ocular perfusion pressure, Optical coherence tomography, Optical microangiography
INTRODUCTION
Glaucoma, the second leading cause of blindness in the world (Bourne et al., 2016), involves both structural and functional damage to the axons of the optic nerve head (ONH) and their retinal ganglion cells (RGC)(Quigley, 2011). Elevated intraocular pressure (IOP), a widely recognized risk factor for this disease, has long been considered to contribute to optic nerve damage through biomechanical as well as vascular mechanisms (Liang et al., 2009; Roberts et al., 2010; Yang et al., 2017). However, to date, the exact relationship between these two mechanisms and their contribution to glaucomatous optic nerve damage is still unknown.
Age is another significant risk factor for glaucoma (Chrysostomou et al., 2010; Gordon et al., 2002; Leske et al., 2003). Tissue changes that accompany advancing age have been argued to contribute to glaucoma through biomechanical as well as vascular mechanisms (Burgoyne, 2011; Coudrillier et al., 2012; Downs, 2015). Increases in stiffness of the connective tissues of the ONH could alter biomechanical responses to elevations in IOP that may increase axonal vulnerability. Additionally, age-related increases in laminar beam and basement membrane thickness may retard nutrient delivery from capillaries to axons within their nerve fiber bundles. Better understanding of these possibilities would benefit greatly from improved insights into the effects of IOP on vascular perfusion and how these may be affected by the aging process.
As a functional extension of optical coherence tomography (OCT), OCT angiography (OCTA)(Wang et al., 2010, 2007) is a technology that can generate 3D images of dynamic microcirculation within the whole retina without a need for contrast agents. Its high resolution and label-free features make OCTA a useful tool for studying glaucoma for pre-clinical as well as clinical studies. In earlier work, we used optical microangiography (OMAG), an OCTA imaging method, to demonstrate comparable responses to elevated IOP in the retina and ONH(Zhi et al., 2012). However, this work used a 1300 nm-centered light source that, while allowing penetration into the ONH, lacked the resolution needed to visualize details of capillary beds. With subsequent improvements, including use of a central wavelength of 840 nm, we later performed quantitative evaluations of capillary filling responses to a stepwise elevation of IOP, which allowed us to demonstrate, using 6 month old animals, preservation of retinal capillary bed filling down to an ocular perfusion pressure of 40 mmHg, which we interpreted as a manifestation of autoregulation (Zhi et al., 2015).
In this study, we used OMAG/OCT to evaluate the effect of elevated IOP on retinal capillary bed filling and compared the results obtained in young adult animals (age 6–8 months) to elderly animals (age 24 months). Because of the close anatomic association between the anterior optic nerve head and retinal vasculature (Morrison et al., 1999) and the comparable responses to elevated IOP between these two vascular beds (Zhi et al., 2012), we believe that observations acquired with this system have relevance for the glaucomatous process and how vascular factors may contribute to this disease in the elderly population.
MATERIAL AND METHODS
System setup and animal preparation
The system setup used in this study has been previously described in detail (Zhi et al., 2012). Briefly, it is a customized SD-OCT system using a super luminescent diode (SLD) light source with central wavelength of 840 nm and the spectral bandwidth of 42 nm. The lateral and axial resolutions are ~15 μm and 7.2 μm, respectively. The total depth range is measured to be ~2.5 mm in air, and is estimated to be about 1.85 mm in tissue. The power of the OCT beam at the cornea is ~1.2 mW, providing a system sensitivity of ~100 dB. The phase stability of the system was measured at ~4 mrad. Integrated with the system is an apparatus used to alter IOP via anterior chamber cannulation with a tube connected to a reservoir filled with balanced salt solution and to a calibrated pressure transducer.
To investigate the association between age and retinal capillary filling upon the elevated IOP, we used 10 adult (6–8 month old) and 12 elderly (24-month old) Brown Norway rats in this study. All protocols conformed to the Association for Research in Vision and Ophthalmology Statement for the Use of Animals in Ophthalmic and Vision Research, and were approved by the Animal Care and Use Committees of the Oregon Health and Science University and the University of Washington.
The rats were first anesthetized with 5.0% inhalational isoflurane mixed with pure oxygen, which was then reduced to 2.0 – 3.0% for the period of IOP elevation and data acquisition. An active pump was employed to vent expired isoflurane and CO2 (Zhi et al., 2015, 2012). Rectal temperature was monitored continuously and maintained at 38°C with a recirculating water pad. Arterial blood pressure was monitored by tail cuff manometry CODA (Kent Scientific Corporation, Northwest Connecticut, USA). Other physiologic parameters, including percent oxygen saturation of functional arterial hemoglobin, heart rate, respiratory rate, and pulse and respiratory distention were monitored continuously during each experiment via a rat foot sensor and MouseOxPlus Oximeter (STARR Life Sciences Corporation, Oakmont, PA, USA).
The animal was positioned on a platform with six degrees of adjustment to facilitate the proper positioning under the OCT system. The pupil of the right eye was dilated with 1% tropicamide (Bausch & Lomb Inc.), and 0.5% proparacaine hydrochloride instilled for added corneal anesthesia. Following an initial 31 gage needle track through the peripheral cornea, the anterior chamber was cannulated with a 1 inch long polyurethane tubing with inner and outer diameters of 0.005 and 0.010 inch, respectively (Instech laboratories, Plymouth Meeting, PA). This cannula was connected via a larger polyurethane tubing (Component Supply Co.) to a reservoir filled with balanced salt solution (Morrison et al., 2016; Zhi et al., 2012) (BSS Plus, Alcon Laboratories Inc.) and to a calibrated pressure transducer, which was calibrated against an external manometer at the beginning of each experiment and IOP was monitored periodically using a TonoLab tonometer (Icare Finland Oy, Espoo, Finland). This entire system has also been separately tested to confirm that inflow pressure determined by this transducer delivers the indicated intraocular pressure using a separate cannula and transducer (Morrison et al., 2016). Topical BSS was applied intermittently to maintain corneal hydration throughout the course of each experiment. By adjusting reservoir height, IOP was increased from 10 to 100 mmHg in 10 mmHg increments, and then lowered to 10 mmHg directly. Following a 2-minute interval at each IOP level for stabilization, an OMAG data volume was captured for later processing to determine 3D retinal structure and microvascular filling.
OMAG data acquisition
Each data volume was captured using our OMAG scanning protocol (Wang et al., 2010; Zhi et al., 2012), which provided a field of view of 2.2×2.2 mm2 (approximately 32°) over the fundus that includes the ONH. The protocol performed raster scanning of the probe beam. In the fast scanning axis, 512 A-lines were captured to form a B-frame (2D cross-sectional image). The B-frame was repeated 8 times at each spatial position. In the slow scanning axis, there were 400 equally spaced positions. Altogether, 3200 B-frames were captured for each 3D scan. For imaging, the frame rate of the system was 250 Hz, i.e. 250 frames per second (fps). Therefore, ~13 seconds were required to capture each 3D data volume for later data processing.
Microvascular imaging and capillary filling index
The 3D raw data were post-processed to generate two OCT volumes by using the OMAG algorithm (An et al., 2010a; Wang et al., 2010; Yousefi et al., 2011), one of which represents tissue structure, the other retinal vasculature. Briefly, at each spatial position (i.e. cross-section), the phase-compensation algorithm (An et al., 2010b) was applied to the eight repeated B-frames to minimize motion artifacts; then the complex signals were subtracted between adjacent B-frames, and consequently averaged to obtain final OMAG cross-sectional blood flow images. The 3D vascular image was obtained by processing the data volume at all the 400 positions. In parallel, OCT structural image was also obtained as the conventional OCT approach, but with improved signal to noise ratio since 4-repeated B-scans are available for averaging due to the OMAG scanning protocol.
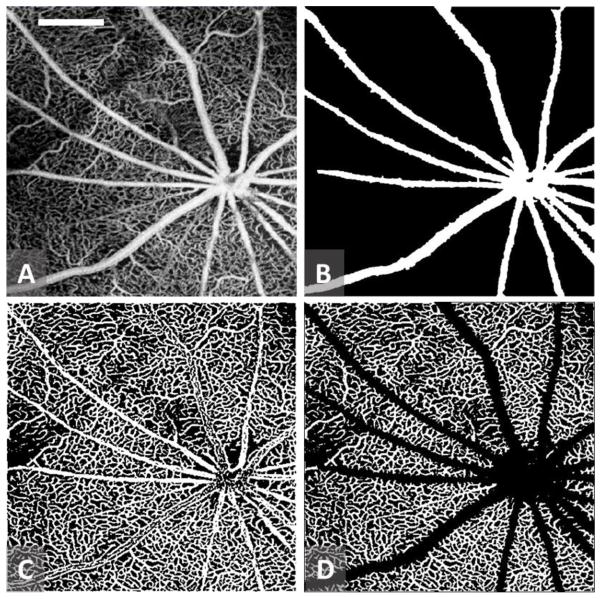
To better quantitate the microvascular response to elevated IOP, we first used a semi-automated retinal layer segmentation software (Yin et al., 2014) to separate the retinal layer from the choroidal layer through identifying the anterior surface of the retina, i.e., inner limiting membrane (ILM), and retinal pigment epithelium (RPE) in the 3D structural image. Then the resulting segmentation was directly applied to 3D blood flow images to obtain a microvascular image representing the retinal perfusion image. Maximum projection analyses, which detected the signal with highest flow intensity value along each A scan, were performed within the segmented retinal layer to generate vascular enface images for retinal perfusion (Zhi et al., 2012) (Fig. 1A). To evaluate the capillary response to the IOP elevation more accurately, large retinal vessels were discounted, using a previously described method for large retinal vessel removal (Chen et al., 2016). In brief, a structural enface image for the RPE was generated by averaging the structural signal within 10 pixels above the detected RPE boundary for each A-scan. The high scattering and absorption properties of blood within large retinal vessels give rise to vessel shadows or dark areas in the regions below them. An adaptive local thresholding based on the method proposed by Phansalkar et al.(Phansalkar et al., 2011) was applied to determine the threshold for each pixel on the structural RPE enface image to generate a binary retinal vessel map, B(x,y), representing relatively big retinal vessels of > 30 μm (Fig. 1B).
Figure 1.
Sample images for major vessel removal and perfused capillary vessel extraction from the scanned OMAG images. (A) retinal OMAG image of the scanned tissue; (B) detected large retinal vessels of > 30 μm; (C) Binary retinal vessel map obtained from (A); and (D) Functional capillary vessel map within the scanned tissue region with large vessels removed. White bar in (A) = 0.5 mm.
| (1) |
where (x, y) are the pixel coordinates of the enface image with NxN array pixels. A second binary vessel map, Fig. 1C, was also generated by binarizing the image shown in Fig 1A through multiscale Hessian filter together with localized thresholding (Chen et al., 2016) to represent all the vessels presented in the OMAG image of Fig. 1A,
| (2) |
Finally the perfused capillary vessels within the scanned tissue region were obtained by differentiating Fig. 1B from Fig. 1C to result in Fig. 1D. After the above vessel detection steps, the capillary filling was calculated as a ratio of,
| (3) |
which represents the retinal capillary response to the IOP elevation. In Equation (3), the capillary filling is a measure of perfused capillary vessel index, and thus represents a unitless ratio. For each animal, the capillary filling index (CFI) was measured at every elevated IOP level, and normalized to baseline, i.e., when the IOP was set at 10 mmHg.
RESULTS
Total retinal thickness
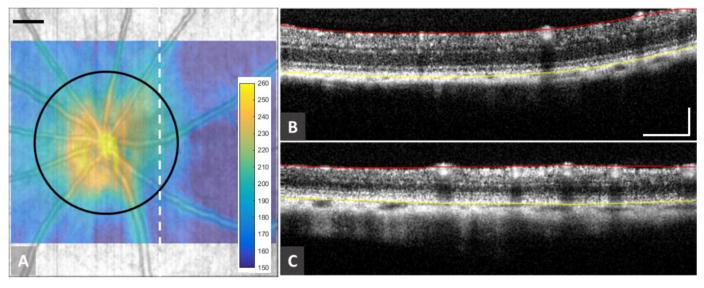
In our previous work using 6 month old animals, retinal capillary beds were separated into inner plexiform (IPL) and outer plexiform (OPL) capillary beds, and measurements were performed on each separately. (Zhi et al., 2015) In the current study, these two capillary beds were difficult to separate in the elderly animals, which we suspected was due to retinal thinning. The 3D OCT structural images obtained here provided an opportunity to compare retinal thickness between young adult and elderly animals. After segmentation of the retinal OCT images, a retinal thickness map could be produced (Fig. 2A). Representative OCT images of the retinal cross-section (0.5 mm temporally away from the ONH) are shown in Figs. 2B and 2C for adult and elderly rats, respectively, with red and yellow segmentation lines marked for ILM and RPE, respectively. Qualitatively, the retinal thickness of the elderly rat appears thinner than that of adult rat. Quantitatively, the average thickness along the circumference with a diameter of 1.2 mm centered at the ONH (black circle in Fig 2A) was evaluated for all 22 eyes. In evaluating retinal thickness, the effect of increased eye size due to age on these values was compensated for, using the method of Lozano (Lozano and Twa, 2013). These results are tabulated in Table I for adult and elderly animals, respectively. Although not necessarily representative of retinal volume, retinal thinning in the elderly animals as compared to adult rats, an approximately 40 μm reduction, was statistically significant (p<0.001).
Figure 2.
Retinal thickness measurements in adult and elderly rats. (A) Typical retinal thickness map overlaid on the retinal structural map. The color bar indicates the thickness measured in micrometers. (B) and (C) are representative OCT cross-sectional structural images for adult and elderly rats, respectively. Mean total retinal thickness of each rat was calculated along a 1.2 mm diameter circle, marked in black in (A), centered on the nerve head. Red and yellow lines in (B) and (C) indicate locations of the ILM and RPE, respectively. Scale bar = 0.25 mm
Effects of elevated IOP on retinal capillary beds
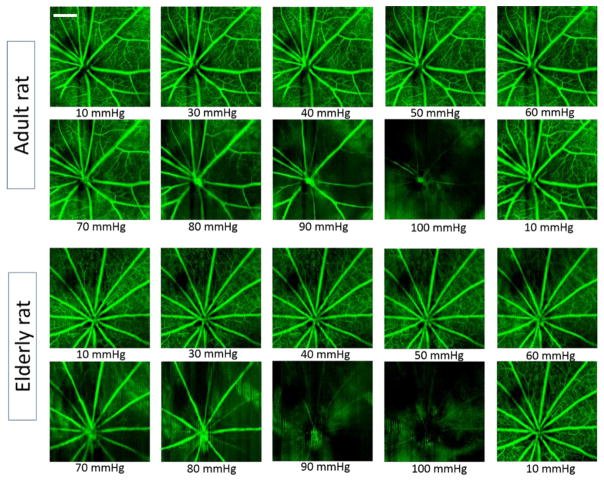
Typical enface retinal microvascular images for adult and elderly rats at each IOP level are shown in Figure 3. Qualitatively, filling of the retinal microvasculature in adult rats appeared to be less affected by IOP elevation than that of elderly rats. For instance, in the adult, an obvious reduction in capillary filling did not begin until IOP reached 70 mmHg, whereas in the elderly rat this reduction was first seen at an IOP 50 of mmHg. For both age groups, capillary filling appeared to return to near baseline when the IOP was reduced from 100 mmHg to 10 mmHg.
Figure 3.
Typical retinal OMAG images obtained from rats subjected to progressive elevation of IOP. Top panel: 6-month old, adult animal; and bottom panel: 24-month old, elderly animal. Obvious change in capillary filling appears when the IOP is elevated above70 mmHg for adults, whereas this threshold appears to be 50 mmHg for the elderly group. Scale bar = 0.5 mm.
To quantitate these effects, the capillary filling index described in Methods was evaluated for each animal at every 10 mmHg increment. At each level, the average capillary filling index of 10 adult rats and 12 elderly rats and the corresponding standard errors of the mean (SEMs) were calculated separately and compared using a two-way ANOVA. The results both age groups are presented in Fig. 4. A sigmoidal line best described the relationship between IOP and CFI for both elderly (r2 = 0.95) and adult (r2 = 0.96) animals. With IOP elevation, the mean CFI for the elderly rats showed less resistance to elevated IOP than in the adults. For these elderly animals, CFI began a significant decline from baseline when IOP reached 40 mmHg, while in the adult group this did not occur until IOP 60 mmHg. The reduction in CFI for elderly animals was significantly different (p< 0.05) than adult animals at IOP 50, 60, and 70 mmHg (shaded region in Fig. 4), with elderly rats exhibiting less capillary filling at each of these pressures.
Figure 4.
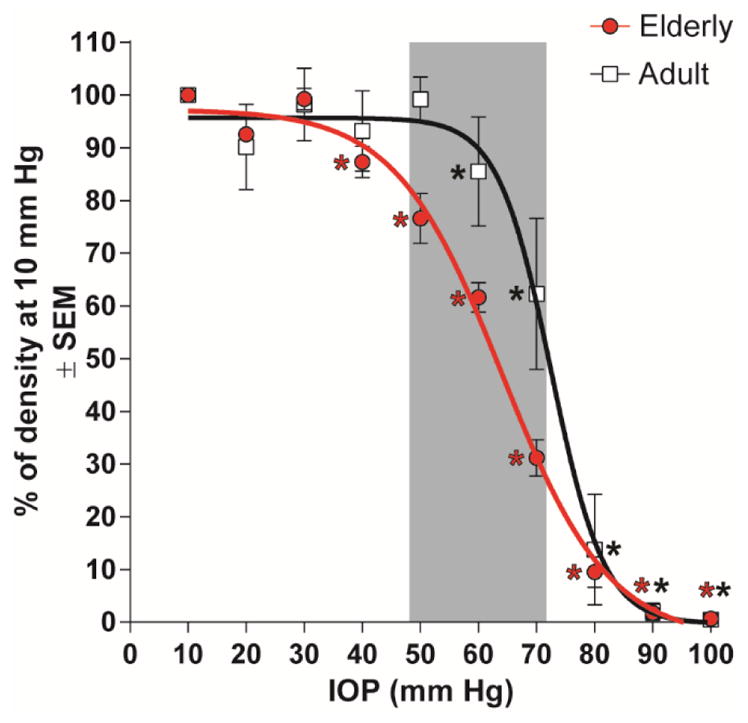
Comparison of the effect of different IOPs on capillary filling between adult and elderly rats by two-way ANOVA. Asterisks (*) indicate a statistically significant difference (p< 0.05) from its baseline; The shaded region indicates that at IOP 50, 60, 70 mmHg the capillary filling is significantly less for elderly than adult animals.
Comparison of the capillary density vs OPP between adult and elderly animals
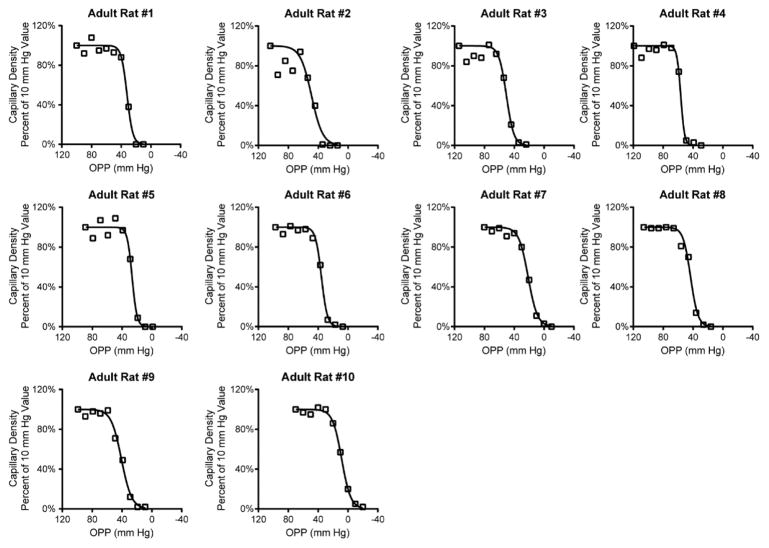
Because systemic blood pressure can affect ocular perfusion (Zhi et al., 2012), we monitored arterial blood pressure throughout each experiment. Using tail cuff manometry, we found that systolic blood pressures in adult animals ranged from 80 to 129 mmHg (mean 108 ± 5 mmHg). This is consistent with our previous findings in similar-aged rats of a MAP (mean arterial pressure) of 102±4 mmHg determined by intra-arterial cannulation (Zhi et al., 2012), and with the experience of others who have found that tail cuff-generated systolic blood pressure readings in anesthetized rats reflects MAP determined by femoral artery catheterization (Buñag, 1973; Buñag and Butterfield, 1982; Lim et al., 2014). Capillary density relative to baseline IOP was analyzed as a function of ocular perfusion pressure (OPP), which we calculated as the difference between systolic blood pressure and IOP. On a per-animal analysis, we found that there was an initial plateau in capillary density followed by an abrupt decline in almost all adult animals (Fig. 5). The plateau in capillary filling tended to persist until OPPs reached 40 – 60 mm Hg.
Figure 5.
Relationship between ocular perfusion pressure (OPP) and capillary density for all adult animals. Notice the consistent plateau in capillary filling for OPPs greater than 40–60 mm Hg.
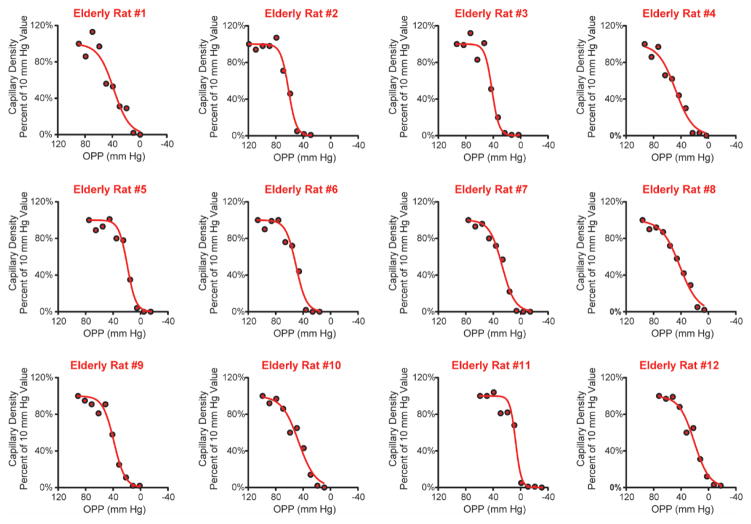
By contrast, systolic blood pressure in elderly rats ranged from 69 to 128 mmHg (mean 99 ± 5 mmHg), approximately 10 mmHg lower than in the adult group. Furthermore, the relationship between OPP and capillary density in elderly animals displayed a different pattern than that seen in adults. Most of the elderly animals did not have an initial plateau in capillary filling, but instead showed a gradual decline in capillary filling with decreasing OPP that in many cases began at an OPP above 60 mmHg, and in some as high as 80 mmHg (Fig. 6).
Figure 6.
Relationship between ocular perfusion pressure (OPP) and capillary density for all elderly animals. Many elderly animals (e.g. Elderly rat #4) showed a gradual decline in capillary filling with decreasing OPPs.
When analyzed as a group, a sigmoidal curve still provided the best fit to characterize the relationship between OPP and capillary density for both elderly (r2 = 0.76) and adult (r2 = 0.71) rats (Fig. 7). Although there was, in aggregate, a suggestion of a more gradual decline in the elderly animals, there was no statistical difference between elderly and adult CFI versus OPP functions (P = .65; Fig. 7).
Figure 7.
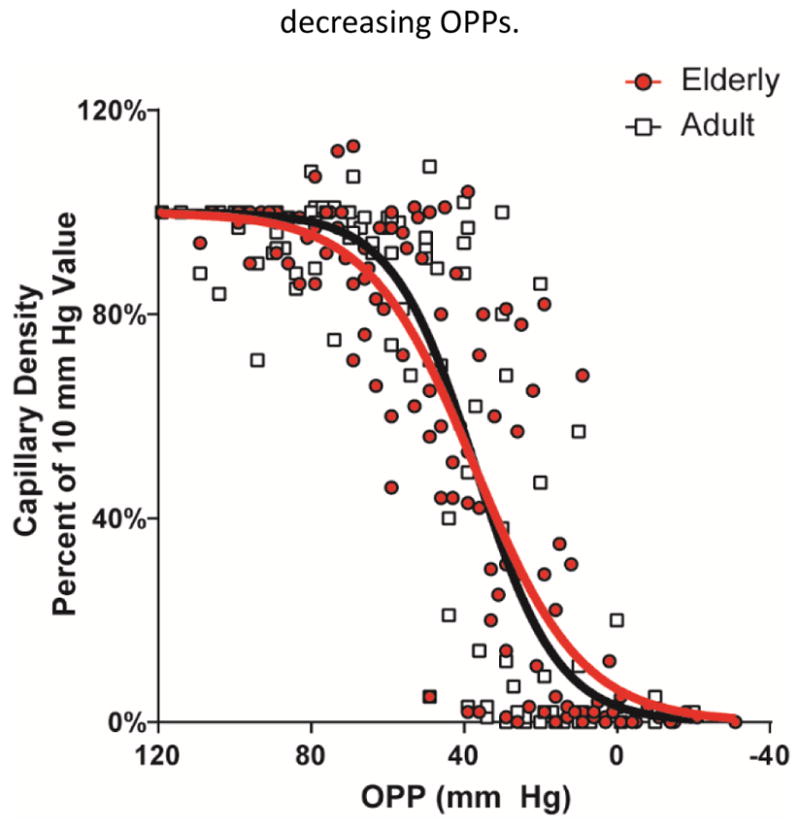
Comparison of the relative capillary density vs. ocular perfusion pressure (OPP) for adult (in black) and elderly (in red) rat eyes.
DISCUSSION
In a previous study (Zhi et al., 2015) we used OMAG in 6 month old rats to determine how retinal capillary filling responds to acute elevation of IOP. We found that retinal capillary filling was relatively preserved until perfusion pressure fell below 40 mmHg. Taken as a measure of autoregulation, this relationship was sustained even in the face of reduced systemic blood pressure, such that the IOP threshold for reduction in retinal perfusion was reduced by an amount equal to the change in systemic blood pressure. Thus, in young adult animals, autoregulation appeared to be preserved down to a perfusion pressure of 40 mmHg. Given the high prevalence of glaucoma in the elderly population (Gordon et al., 2002; Leske et al., 2003), and the potential contribution of vascular factors to the pathogenesis of glaucoma (Chen et al., 2017; JS, 2015), we sought to extend these studies to elderly individuals.
Looking at capillary filling in adult and elderly animals solely as a function of IOP, (Figs. 3 and 4), it is clear that perfusion is affected by increased IOP in both groups. Interestingly, in elderly animals, significant reductions in CFI initially occurred at an IOP of 40 mmHg, whereas in the adult group IOP had to reach 60 mmHg before CFI began to decrease significantly. Thus, a given IOP appears to have an approximately 20 mmHg greater effect on CFI in older animals.
It is known that isoflurane and other inhalational anesthetics can lower systemic blood pressure to a greater degree in older individuals (Dwyer and Howe, 1995; Hoffman et al., 1982; McKinney et al., 1993). This leaves open the possibility that reduced blood pressure might explain the observed difference in CFI response to IOP(He et al., 2012; Liang et al., 2009; Zhi et al., 2015). However, in the current study, mean systemic blood pressure in elderly animals (99 ± 5 mmHg) was approximately 10 mmHg lower than in the adults (108 ± 5 mmHg). This is approximately half the observed effect of aging on capillary filling threshold, and indicates that the heightened response of capillary filling to IOP seen in elderly individuals likely results from factors other than systemic blood pressure alone.
Overall evaluation of capillary filling as a function of perfusion pressure failed to demonstrate a significant difference between the two groups. (Figure 7) However, examination of this relationship for individual animals in the adult group demonstrated a generally uniform response, characterized by relatively little change in filling until OPP reached 40–60 mmHg, after which filling decreased rapidly. This agrees with our previous work in similar-aged rats (Zhi et al., 2015) and with a comparable observation in the optic nerve head by Wang et al in adult rhesus macaques (Wang et al., 2014). By contrast, while a few elderly animals exhibited a similar response, capillary filling in most demonstrated a more gradual reduction, beginning in some animals with OPP’s as high as 80 mmHg. This observation strongly supports the likelihood that autoregulatory capacity of retinal blood vessels diminishes with age, but that the rate of this decline varies among individuals. We believe that this variability contributes to the relatively little separation between the two groups, when considered overall.
Autoregulation describes the capacity for vascular beds to dilate or constrict their resistance vessels in order to maintain a relatively constant blood flow in the face of changing perfusion pressure. In the retina, it is felt that these alterations rely primarily on local vascular mechanisms (Harris et al., 1998; Pournaras et al., 2008). Changes in retinal vascular endothelial cells, smooth muscle cells and pericytes have all been documented as part of the aging process (Hughes et al., 2006; Scioli et al., 2014). These changes, which include vascular wall thickening and deposition of extracellular matrix components, would be anticipated to reduce the vasodilation and vasoconstriction required for normal autoregulation to take place.
Consistent with these considerations, optic nerve head blood flow has been observed to decrease with age in humans (Boehm et al., 2005), and vasoconstriction of retinal blood vessels to a light stimulus has been shown to be reduced in elderly individuals (Kneser et al., 2009). Kida, et al, studying elderly humans up to age 80, noted reduced nocturnal optic nerve head and macular blood flow as compared to young 20–25 year-olds, despite a higher ocular perfusion pressure (Kida et al., 2008). In rats, vasoconstriction in isolated retinal arterioles to endothelin-1, a mediator of metabolic autoregulation, was demonstrated to be reduced with age over 20 months (MacIntyre et al., 2012). In other work, Lim et al, studying 3- and 14-month old rats, did not find a significant difference in blood flow response (determined by laser Doppler flowmetry) to a step-wise elevation in IOP between the two age groups (Lim et al., 2014). However, the older group, termed “middle-aged” by the authors, was significantly younger than the 24 month-olds used in our study. To our knowledge our study is the first to evaluate capillary filling response to stepwise IOP elevations using OCT angiography in elderly rats.
This study presented us with several challenges for determining retinal microvascular response in elderly animals, in addition to the above-noted increased inter-animal variability. Initial attempts to perform OMAG on 28 month old animals were limited by poor signal strength due to the presence of lens opacities, which necessitated the study of slightly younger 24 month-old animals. It remains possible that, had we been able to study 28 month old animals as originally planned, greater differences affecting more animals would have been determined. Even though reduced lens opacity in the 24 month old animals did allow visualization and quantification of retinal capillary beds, signal strength was still too weak to allow simultaneous evaluation of total retinal blood flow, so this part of the analysis, which was possible in our earlier study, (Zhi et al., 2015) could not be performed. An additional complicating factor was that of reduced retinal thickness in the elderly animals (Figure 2), which has been noted by others (Abbott et al., 2014; O’Steen et al., 1987; Shariati et al., 2015). Because of this, a clear separation of the inner and outer plexiform capillary beds from each other during segmentation was not possible, unlike in our previous study for 6 month old animals, which allowed us to perform detailed measurements on just the outer plexiform capillary bed (Zhi et al., 2015). As a result, this study reflects total retinal capillary blood flow and may explain subtle differences between the adult group and our prior findings.
CONCLUSIONS
OMAG provides the opportunity to compare the response to elevated IOP between young adult and elderly rats. As a function of IOP, capillary filling in elderly animals appeared to diminish at relatively lower IOPs than that in adults. While systemic blood pressure was less in this elderly group, this did not fully explain this effect, which occurred out of proportion to the reduction in blood pressure. Assessment of capillary filling as a function of perfusion pressure revealed variability in response among elderly individuals. While some demonstrated relative preservation of filling to an OPP down to approximately 40 mmHg, in others filling deteriorated well above this level. These results are consistent with the notion that reduced autoregulatory capacity may contribute to increased glaucoma susceptibility among some, but not all, elderly individuals.
Table 1.
Mean retinal thickness evaluated in adult and elderly rats
| Age group | Mean retina thickness (μm) | SD (μm) | Lower 95% | Upper 95% |
|---|---|---|---|---|
| Adult | 223.4 | ±10.3 | 217.8 | 228.9 |
| Elderly | 183.1 | ±6.8 | 177.9 | 188.2 |
SD – standard deviation
HIGHLIGHTS.
Optical coherence tomography angiography is useful in investigating dynamic retinal capillary filling in small animal models.
Elderly individuals demonstrate greater sensitivity of retinal capillary filling to elevated intraocular pressure than young adults.
The relationship of retinal capillary filling to ocular perfusion pressure in elderly individuals is variable.
Some elderly individuals demonstrate less autoregulatory capacity than young adults.
Acknowledgments
This work was supported by National Institutes of Health [Grants NEI: R01EY024158 (RKW), R01EY010145 (JCM), and P30 EY010572 (OHSU)], and an unrestricted grants to OHSU from Research to Prevent Blindness (RPB).
Footnotes
Publisher's Disclaimer: This is a PDF file of an unedited manuscript that has been accepted for publication. As a service to our customers we are providing this early version of the manuscript. The manuscript will undergo copyediting, typesetting, and review of the resulting proof before it is published in its final citable form. Please note that during the production process errors may be discovered which could affect the content, and all legal disclaimers that apply to the journal pertain.
References
- Abbott CJ, Choe TE, Burgoyne CF, Cull G, Wang L, Fortune B. Comparison of retinal nerve fiber layer thickness in vivo and axonal transport after chronic intraocular pressure elevation in young versus older rats. PLoS One. 2014:9. doi: 10.1371/journal.pone.0114546. [DOI] [PMC free article] [PubMed] [Google Scholar]
- An L, Qin J, Wang RK. Ultrahigh sensitive optical microangiography for in vivo imaging of microcirculations within human skin tissue beds. Opt Express. 2010a;18:8220–8228. doi: 10.1364/OE.18.008220. [DOI] [PMC free article] [PubMed] [Google Scholar]
- An L, Subhush HM, Wilson DJ, Wang RK. High-resolution wide-field imaging of retinal and choroidal blood perfusion with optical microangiography. J Biomed Opt. 2010b;15:26011. doi: 10.1117/1.3369811. [DOI] [PMC free article] [PubMed] [Google Scholar]
- Boehm AG, Koeller AU, Pillunat LE. The effect of age on optic nerve head blood flow. Invest Ophthalmol Vis Sci. 2005;46:1291–1295. doi: 10.1167/iovs.04-0987. [DOI] [PubMed] [Google Scholar]
- Bourne RRA, Taylor HR, Flaxman SR, Keeffe J, Leasher J, Naidoo K, Pesudovs K, White RA, Wong TY, Resnikoff S, Jonas JB. Number of People Blind or Visually Impaired by Glaucoma Worldwide and in World Regions 1990–2010: A Meta-Analysis. PLoS One. 2016;11:e0162229. doi: 10.1371/journal.pone.0162229. [DOI] [PMC free article] [PubMed] [Google Scholar]
- Buñag RD. Validation in awake rats of a tail-cuff method for measuring systolic pressure. J Appl Physiol. 1973;34:279–282. doi: 10.1152/jappl.1973.34.2.279. [DOI] [PubMed] [Google Scholar]
- Buñag RD, Butterfield J. Tail-cuff blood pressure measurement without external preheating in awake rats. Hypertension. 1982;4:898–903. doi: 10.1161/01.HYP.4.6.898. [DOI] [PubMed] [Google Scholar]
- Burgoyne CF. A biomechanical paradigm for axonal insult within the optic nerve head in aging and glaucoma. Exp Eye Res. 2011;93:120–132. doi: 10.1016/j.exer.2010.09.005. [DOI] [PMC free article] [PubMed] [Google Scholar]
- Chen C, KDB, JCW, et al. Peripapillary retinal nerve fiber layer vascular microcirculation in eyes with glaucoma and single-hemifield visual field loss. JAMA Ophthalmol. 2017 doi: 10.1001/jamaophthalmol.2017.0261. [DOI] [PMC free article] [PubMed] [Google Scholar]
- Chen CL, Zhang A, Bojikian KD, Wen JC, Zhang Q, Xin C, Mudumbai RC, Johnstone MA, Chen PP, Wang RK. Peripapillary retinal nerve fiber layer vascular microcirculation in glaucoma using optical coherence tomography???based microangiography. Investig Ophthalmol Vis Sci. 2016;57:475–485. doi: 10.1167/iovs.15-18909. [DOI] [PMC free article] [PubMed] [Google Scholar]
- Chrysostomou V, Trounce IA, Crowston JG. Mechanisms of retinal ganglion cell injury in aging and glaucoma. Ophthalmic Res. 2010 doi: 10.1159/000316478. [DOI] [PubMed] [Google Scholar]
- Coudrillier B, Tian J, Alexander S, Myers KM, Quigley HA, Nguyen TD. Biomechanics of the human posterior sclera: Age- and glaucoma-related changes measured using inflation testing. Investig Ophthalmol Vis Sci. 2012;53:1714–1728. doi: 10.1167/iovs.11-8009. [DOI] [PMC free article] [PubMed] [Google Scholar]
- Downs JC. Optic nerve head biomechanics in aging and disease. Exp Eye Res. 2015 doi: 10.1016/j.exer.2015.02.011. [DOI] [PMC free article] [PubMed] [Google Scholar]
- Dwyer R, Howe J. Peripheral blood flow in the elderly during inhalational anaesthesia. Acta Anaesthesiol Scand. 1995;39:939–944. doi: 10.1111/j.1399-6576.1995.tb04201.x. [DOI] [PubMed] [Google Scholar]
- Gordon MO, Beiser JA, Brandt JD, Heuer DK, Higginbotham EJ, Johnson CA, Keltner JL, Miller JP, Parrish RK, Wilson MR, Kass MA. The Ocular Hypertension Treatment Study: baseline factors that predict the onset of primary open-angle glaucoma. Arch Ophthalmol. 2002;120 doi: 10.1001/archophthalmol.2008.599. 714-20-30. [DOI] [PubMed] [Google Scholar]
- Harris A, Ciulla TA, Chung HS, Martin B. Regulation of Retinal and Optic Nerve Blood Flow. Arch Ophthalmol. 1998;116:1491–1495. doi: 10.1001/archopht.116.11.1491. [DOI] [PubMed] [Google Scholar]
- He Z, Nguyen CTO, Armitage JA, Vingrys AJ, Bui BV. Blood pressure modifies retinal susceptibility to intraocular pressure elevation. PLoS One. 2012:7. doi: 10.1371/journal.pone.0031104. [DOI] [PMC free article] [PubMed] [Google Scholar]
- Hoffman WE, Miletich DJ, Albrecht RF. Cardiovascular and regional blood flow changes during halothane anesthesia in the aged rat. Anesthesiology. 1982;56:444–448. doi: 10.1097/00000542-198206000-00007. [DOI] [PubMed] [Google Scholar]
- Hughes S, Gardiner T, Hu P, Baxter L, Rosinova E, Chan-Ling T. Altered pericyte-endothelial relations in the rat retina during aging: Implications for vessel stability. Neurobiol Aging. 2006;27:1838–1847. doi: 10.1016/j.neurobiolaging.2005.10.021. [DOI] [PubMed] [Google Scholar]
- JSS Measuring blood flow: So what? JAMA Ophthalmol. 2015;133:1052–1053. doi: 10.1001/jamaophthalmol.2015.2287. [DOI] [PMC free article] [PubMed] [Google Scholar]
- Kida T, Liu JHK, Weinreb RN. Effect of aging on nocturnal blood flow in the optic nerve head and macula in healthy human eyes. J Glaucoma. 2008;17:366–371. doi: 10.1097/IJG.0b013e31815d7838. [DOI] [PubMed] [Google Scholar]
- Kneser M, Kohlmann T, Pokorny J, Tost F. Age related decline of microvascular regulation measured in healthy individuals by retinal dynamic vessel analysis. Med Sci Monit. 2009;15:CR436–41. [PubMed] [Google Scholar]
- Leske MC, Heijl A, Hussein M, Bengtsson B, Hyman L, Komaroff E. Factors for glaucoma progression and the effect of treatment: the early manifest glaucoma trial. Arch Ophthalmol. 2003;121:48–56. doi: 10.1097/00132578-200310000-00007. [DOI] [PubMed] [Google Scholar]
- Liang Y, Downs JC, Fortune B, Cull G, Cioffi GA, Wang L. Impact of systemic blood pressure on the relationship between intraocular pressure and blood flow in the optic nerve head of nonhuman primates. Invest Ophthalmol Vis Sci. 2009;50:2154–2160. doi: 10.1167/iovs.08-2882. [DOI] [PubMed] [Google Scholar]
- Lim JKH, Nguyen CTO, He Z, Vingrys AJ, Bui BV. The effect of ageing on ocular blood flow, oxygen tension and retinal function during and after intraocular pressure elevation. PLoS One. 2014:9. doi: 10.1371/journal.pone.0098393. [DOI] [PMC free article] [PubMed] [Google Scholar]
- Lozano DC, Twa MD. Development of a Rat Schematic Eye From In Vivo Biometry and the Correction of Lateral Magnification in SD-OCT Imaging. Invest Ophthalmol Vis Sci. 2013;54:6446–6455. doi: 10.1167/iovs.13-12575. [DOI] [PMC free article] [PubMed] [Google Scholar]
- MacIntyre JN, Slusar JE, Zhu J, Dong AX, Howlett SE, Kelly ME. Age-associated alterations in retinal arteriole reactivity to endothelin-1 differ between the sexes. Mech Ageing Dev. 2012;133:611–619. doi: 10.1016/j.mad.2012.08.001. [DOI] [PubMed] [Google Scholar]
- McKinney MS, Fee JP, Clarke RS. Cardiovascular effects of isoflurane and halothane in young and elderly adult patients. Br J Anaesth. 1993;71:696–701. doi: 10.1093/bja/71.5.696. [DOI] [PubMed] [Google Scholar]
- Morrison JC, Cepurna WO, Tehrani S, Choe TE, Jayaram H, Lozano DC, Fortune B, Johnson EC. A Period of Controlled Elevation of IOP (CEI) Produces the Specific Gene Expression Responses and Focal Injury Pattern of Experimental Rat GlaucomaResponses to Controlled Elevation of IOP. Invest Ophthalmol Vis Sci. 2016;57:6700–6711. doi: 10.1167/iovs.16-20573. [DOI] [PMC free article] [PubMed] [Google Scholar]
- Morrison JC, Johnson EC, Cepurna WO, Funk RH. Microvasculature of the rat optic nerve head. Invest Ophthalmol Vis Sci. 1999;40:1702–1709. [PubMed] [Google Scholar]
- O’Steen WK, Sweatt AJ, Brodish A. Effects of acute and chronic stress on the neural retina of young, mid-age, and aged Fischer-344 rats. Brain Res. 1987;426:37–46. doi: 10.1016/0006-8993(87)90422-7. [DOI] [PubMed] [Google Scholar]
- Phansalkar N, More S, Sabale A, Joshi M. Adaptive local thresholding for detection of nuclei in diversity stained cytology images. ICCSP 2011 – 2011 International Conference on Communications and Signal Processing; 2011. pp. 218–220. [DOI] [Google Scholar]
- Pournaras CJ, Rungger-Brändle E, Riva CE, Hardarson SH, Stefansson E. Regulation of retinal blood flow in health and disease. Prog Retin Eye Res. 2008 doi: 10.1016/j.preteyeres.2008.02.002. [DOI] [PubMed] [Google Scholar]
- Quigley HA. Glaucoma. The Lancet. 2011:1367–1377. doi: 10.1016/S0140-6736(10)61423-7. [DOI] [PubMed] [Google Scholar]
- Roberts MD, Sigal IA, Liang Y, Burgoyne CF, Downs JC. Changes in the Biomechanical Response of the Optic Nerve Head in Early Experimental Glaucoma. Invest Ophthalmol Vis Sci. 2010;51:5675–5684. doi: 10.1167/iovs.10-5411. [DOI] [PMC free article] [PubMed] [Google Scholar]
- Scioli MG, Bielli A, Arcuri G, Ferlosio A, Orlandi A. Ageing and microvasculature. Vasc Cell. 2014;6:19. doi: 10.1186/2045-824X-6-19. [DOI] [PMC free article] [PubMed] [Google Scholar]
- Shariati MA, Park JH, Liao YJ. Optical Coherence Tomography Study of Retinal Changes in Normal Aging and After Ischemia. Investig Opthalmology Vis Sci. 2015;56:2790. doi: 10.1167/iovs.14-15145. [DOI] [PubMed] [Google Scholar]
- Wang L, Burgoyne CF, Cull G, Thompson S, Fortune B. Static blood flow autoregulation in the optic nerve head in normal and experimental glaucoma. Invest Ophthalmol Vis Sci. 2014;55:873–80. doi: 10.1167/iovs.13-13716. [DOI] [PMC free article] [PubMed] [Google Scholar]
- Wang RK, An L, Francis P, Wilson DJ. Depth-resolved imaging of capillary networks in retina and choroid using ultrahigh sensitive optical microangiography. Opt Lett. 2010;35:1467. doi: 10.1364/OL.35.001467. [DOI] [PMC free article] [PubMed] [Google Scholar]
- Wang RK, Jacques SL, Ma Z, Hurst S, Hanson SR, Gruber A. Three dimensional optical angiography. Opt Express. 2007;15:4083. doi: 10.1364/OE.15.004083. [DOI] [PubMed] [Google Scholar]
- Yang H, Reynaud J, Lockwood H, Williams G, Hardin C, Reyes L, Stowell C, Gardiner SK, Burgoyne CF. The connective tissue phenotype of glaucomatous cupping in the monkey eye - Clinical and research implications. Prog Retin Eye Res. 2017 doi: 10.1016/j.preteyeres.2017.03.001. [DOI] [PMC free article] [PubMed] [Google Scholar]
- Yin X, Chao JR, Wang RK. User-guided segmentation for volumetric retinal optical coherence tomography images. J Biomed Opt. 2014;19:86020. doi: 10.1117/1.JBO.19.8.086020. [DOI] [PMC free article] [PubMed] [Google Scholar]
- Yousefi S, Zhi Z, Wang RK. Eigendecomposition-based clutter filtering technique for optical microangiography. IEEE Trans Biomed Eng. 2011;58:2316–2323. doi: 10.1109/TBME.2011.2152839. [DOI] [PMC free article] [PubMed] [Google Scholar]
- Zhi Z, Cepurna W, Johnson E, Jayaram H, Morrison J, Wang RK. Evaluation of the effect of elevated intraocular pressure and reduced ocular perfusion pressure on retinal capillary bed filling and total retinal blood flow in rats by OMAG/OCT. Microvasc Res. 2015;101:86–95. doi: 10.1016/j.mvr.2015.07.001. [DOI] [PMC free article] [PubMed] [Google Scholar]
- Zhi Z, Cepurna WO, Johnson EC, Morrison JC, Wang RK. Impact of intraocular pressure on changes of blood flow in the retina, choroid, and optic nerve head in rats investigated by optical microangiography. Biomed Opt Express. 2012;3:2220. doi: 10.1364/BOE.3.002220. [DOI] [PMC free article] [PubMed] [Google Scholar]


