

Abstract
Rationale
The phenotypes of vascular smooth-muscle cells (vSMCs) comprise a continuum bounded by predominantly contractile and synthetic cells. Some evidence suggests that contractile vSMCs can assume a more synthetic phenotype in response to ischemic injury, but the mechanisms that activate this phenotypic switch are poorly understood.
Objective
To determine whether lactate, which increases in response to regional ischemia, may promote the synthetic phenotype in vSMCs.
Methods and Results
Experiments were performed with vSMCs that had been differentiated from human induced pluripotent stem cells and then cultured in glucose-free, lactate-enriched (L+) medium or in standard (L−) medium. Compared to the L− medium, the L+ medium was associated with significant increases in synthetic vSMC marker expression, proliferation, and migration, and with significant declines in contractile and apoptotic activity. Furthermore, these changes were accompanied by increases in the expression of monocarboxylic acid transporters (MCT) and were generally attenuated both by the blockade of MCT activity and by transfection with iRNA for N-myc downstream regulated gene (NDRG). Proteomics, biomarker, and pathway analyses suggested that the L+ medium tended to upregulate the expression of synthetic vSMC markers, the production of extracellular proteins that participate in tissue construction or repair, and the activity of pathways that regulate cell proliferation and migration. Observations in hypoxia-cultured vSMCs were similar to those in L+ cultured vSMCs, and assessments in a swine myocardial infarction model suggested that measurements of lactate levels, lactate dehydrogenase levels, vSMC proliferation, and MCT and NDRG expression were greater in the ischemic zone than in nonischemic tissues.
Conclusions
These results demonstrate for the first time that vSMCs assume a more synthetic phenotype in a microenvironment that is rich in lactate. Thus, mechanisms that link glucose metabolism to vSMC phenotypic switching could play a role in the pathogenesis and treatment of cardiovascular disease.
Keywords: Smooth Muscle Cell, heart, lactate, myocardial infarction, ischemic
INTRODUCTION
Vascular smooth muscle cells (vSMCs) are perhaps most frequently studied for their role in arterial contraction.1 vSMCs are found in a wide range of organs and participate in a variety of other physiological activities and repair mechanisms.1 The diversity of vSMC function is reflected in their phenotypes, which compose a spectrum that ranges from predominantly contractile cells at one end to predominantly synthetic cells at the other. The contractile and synthetic phenotypes are characterized by substantial differences in marker expression, morphology, and activity,2, 3 and some evidence suggests that contractile cells can adopt a more synthetic phenotype in response to ischemic injury,4 but the mechanisms that activate this phenotypic switch are poorly understood.
Even under fully oxygenated conditions, vSMCs produce a substantial amount of lactate,5 and both local and systemic lactate concentrations increase in response to regional ischemia and cardiac arrest, as well as shock, burns, trauma, and other conditions.6, 7 Lactate is the end product of cellular anaerobic glucose catabolism and has long been considered a metabolic waste product; however, there are reports indicate that lactate is taken up by myocytes, endothelial cells (ECs) and human cytotoxic T lymphocytes,8, 9 inhibits phosphofructokinase,10 alters gene expression in L6 muscle cells,11 participates in T-cell migration,12 and contributes to tumor growth.13–16 It have been reported that the synthetic phenotype switch involves vSMC-dependent mechanisms of repair in response to injury.17, 18 Here, we show that lactate promotes the synthetic phenotype of vSMCs. This mechanism maybe utilized to enhance myocardial repair in some forms of ischemia heart disease.
METHODS
All the original data are available upon request. Please email the request to the first author directly.
Maintenance and differentiation of hiPSCs
hiPSCs were maintained on vitronectin-coated plates in DMEM-F12 (Life Science, USA) supplemented with 20% knockout serum replacement (Invitrogen, USA),0.1 mM MEM nonessential amino acid solution (Life Science, USA), 2 mM L glutamine (Life Science, USA), 0.1 mM b-mercaptoethanol (Sigma, USA), and 4 ng/mL basic fibroblast growth factor (Thermo Fisher Scientific, USA). Passage 10~15 of hiPSC was used in this project19. hiPSCs were differentiated into hiPSC-vSMCs and endothelial cells as described previously.20 The standard culture medium consisted of RPMI-1640 with 1× B27 minus insulin and a growth factor mixture (human basic fibroblast growth factor, 2 ng/mL; human epidermal growth factor, 0.5 ng/ml). The lactate-enriched (L+) medium consisted of glucose-free RPMI-1640 with 1× B27 minus insulin, growth factor mixture, and L-lactate added as needed. For the hypoxic condition, the medium was vacuumed; then, the cells were cultured for 4 hours at 37 °C with 5% CO2 and 1% O2. For lactate assay the cells were treated with 100 μM CoCl2 for hypoxia condition.
Migration assay
Migration was evaluated across 8-μm pore size membranes in 24-well tissue culture plates with a cell-migration kit (Millipore, USA). Cells were cultured in RPMI-1640 B27 for 24 h, trypsinized, and then added with 300 μL RPMI-1640 B27 to the upper chamber (1×10⁵ cells/chamber). The lower chamber contained 500 μL RPMI-1640 B27 and was coated with (positive control) or without (negative control) Matrigel. The cells were incubated for 12h at 37 °C, and then the cells that had migrated to the lower chamber were detected with CyQuant GR Dye.
Contraction assay
Collagen gels were prepared by incubating bovine type I collagen (3 mg/mL) in 24-well culture dishes overnight at 37 °C; then, the cells were plated at a density of 5×10⁴ cells per well. On the following day, the collagen gels were treated with 1 μM carbachol and detached from the sides of the wells, and the surface areas of the collagen lattices were measured from digital photographs taken 0 and 24 h later. The decline in surface area was determined with Image J software for three replicates per experimental group.
Live/dead cell assay
Living and dead cells were quantified via two-color fluorescence with the LIVE/DEAD Viability/Cytotoxicity kit (Molecular Probes, USA) as directed by the manufacturer’s instructions. The cells were cultured in medium containing calcein AM and ethidium homodimer-1, both of which easily pass from the culture medium into the cellular cytoplasm; then, viable cells were detected by intracellular esterase activity, which converts the non-fluorescent calcein AM into the intensely green fluorescent molecule calcein, and non-viable cells are detected by the binding of ethidium homodimer-1, which produces a bright red fluorescence in dead cells. Briefly, the cells were washed with PBS, incubated with 300 μL of the live/dead solution for 30 min at 37 °C in the dark, and viewed with a microscope and appropriate filters (Leica, Germany). Each treatment group was evaluated in triplicate, and three representative images were taken for each triplicate. Live and dead cells were counted and quantified with Image J software.
Western blot analysis
Cells were washed twice in cold PBS and lysed in New RIPA lysis buffer (150 mM NaCl, 50 mM Tris pH 8.0, 1 mM EDTA, 1 mM EGTA, 0.5 % sodium deoxycholate, 0.1 % SDS, and 1 % Triton X-100) with protease inhibitors (0.1 M phenylmethylsulfonyl fluoride, 5 μg/mL leupeptin, 2 μg/mL aprotinin, and 1 μg/mLpepstatin). Protein concentrations for the whole-cell lysates were determined via the bicinchoninic acid (BCA) method, and equal amounts of each protein sample (15 μg) were separated on an 8–14 % SDS–polyacrylamide gel at 80 V; then, a Turbo transfer System (Bio-Rad, USA) was used for 8 minutes to transfer the separated proteins to a polyvinylidene difluoride membrane, and the proteins were blocked with 5% skim milk powder for 1 h at room temperature. Membranes were incubated with primary antibodies for 1 h at room temperature or overnight at 4°C, washed three times with 0.05 % PBS-Tween, incubated for 1 h at room temperature with a horseradish peroxidase-conjugated secondary antibody, and washed with 0.05% PBS-T; then, the protein bands were visualized with ECL Plus as directed by the manufacturer’s instructions and developed on film (Cell signaling, USA).
MCT4 and NDRG3 knock down
Cells were transfected with MCT4 siRNA or control siRNAs (Santa Cruz Biotechnology, USA) by using HiperFect transfection reagent (Qiagen, USA) as directed by the manufacturer’s instructions. Briefly, the siRNAs and reagent (in a 1:2 ratio) were dissolved in RPMI-1640 and incubated for 5 min at room temperature; then, the siRNA-reagent complexes were added to the cells, and the cells were incubated at 37°C. Six hours later, the transfection medium was replaced with fresh medium and the cells were cultured for 2 more days before use in subsequent experiments. Transfection with NDRG3 shRNA or control RNA particles (Origene, USA) was performed in RPMI-1640 with 2 μg/mL Polybrene (Millipore, USA); then, the cells were incubated overnight, the transfection medium was replaced with fresh medium, and the cells were cultured for 2 days before use in subsequent experiments.
Real-time reverse transcription PCR
Total RNA was extracted with an RNeasy mini kit (Qiagen, USA), and the PCR reactions were performed with 4 μL RT-PCR Reaction Mix (Qiagen, USA), 1 μL iScript reverse transcriptase, 900 nM forward primer, 900 nM reverse primer, 250 nM probe and 50 ng RNA in 20 μL reaction volumes. Reactions were performed in an Eppendorf MastercyclerPro PCR system (Thermo Scientific, USA) as described previously.20
The primer sequences are listed below.
-
GAPDH: AACTTTGGCATTGTGGAAGG (forward) and
CACATTGGGGGTAGGAACA (reverse);
-
MCT1: CTCTGGGCGCCGCGAGATAC (forward) and
CAACTACCACCGCCCAGCCC (reverse);
-
MCT4: CCAGGCCCACGGCAGGTTTC (forward) and
GCCACCGTAGTC ACTGGCCG (reverse);
-
CNN1: ATGTCCTCTGCTCACTTCAAC(forward) and
CACGTTCACCTTGTTTCCTTTC(reverse);
-
TAGLN: GAAGAAAGCCCAGGAGCATAA(forward)and
CCAGGATGAGAGGAACAGTAGA (reverse);
-
ACTA2: GATCTGGCACCACTCTTTCTAC(forward) and
CAGGCAACTCGTAACTCTTCTC (reverse);
-
MYH11: AGGCGAACCTAGACAAGAATAAG(forward) and
CTGGATGTTGAGAGTGGAGATG (reverse);
-
NDRG3: CGAGGCATACCCAAGAGGAAC(forward) and
GGCACACAGCAAAATGATGAG (reverse);
-
Vimentin: TCGTTTCGAGGTTTTCGCGTTAGAGAC (forward) and
GACTAAAACTCGACCGACTCGCGA (reverse).
-
YAP: CCTTCTTCAAGCCGCCGGAG (forward) and
CAGTGTCCCAGGAGAAACAGC(reverse).
-
mTOR: CAGAAGGTGGAGGTGTTTGAG(forward) and
TGACATGACCGCTAAAGAACG(reverse).
-
AMPK: TGTTCCAGCAGATCCTTTCC(forward) and
ATAATTGGGTGAGCCACAGC(reverse).
Immunocytochemistry
Cells were cultured in slide chambers for 24–72 h, fixed in 4% paraformaldehyde at room temperature for 20 minutes, permeabilized in 0.1% Triton X-100 at 4°C for 10 minutes, and blocked with secondary antibody serum for 60 minutes. Primary antibodies were added to the 2% secondary antibody serum in PBS at a concentration of 1:100, and the cells were incubated at 4°C overnight; then, the labeled sections were washed and incubated with FITC-, and TRITC-conjugated secondary antibodies in Lab Vision UltraV Block (Thermo Scientific, USA) at room temperature for 1 hour, counterstained with DAPI, washed, and visualized under a fluorescence microscope (DP71; Olympus, Tokyo, Japan). Positively stained cells were quantified on serial sections by using Image J software.
Flow cytometry analysis
Cells were dissociated with 0.25% trypsin-EDTA, fixed with 4% paraformaldehyde for 10 min, permeabilized with 0.1% Triton X-100 (Sigma) at room temperature for 10 min, and incubated with antibodies (Supplemental Table I) for 3 hr; then, the cells were washed with PBS containing 0.1% Tween 20, and incubated with Alexa Fluor 488 donkey anti-mouse IgG secondary antibodies (Invitrogen, USA) at room temperature for 2 h. Flow cytometry analyses were performed with a BD Aria II instrument (BD Biosciences, USA).
Glucose and lactate uptake assay
14C glucose and 14C lactate were used in the assay. The cells were culture in RPMI-1640 with B27 minus for 18 hrs and the cell were washed with PBS for 2 times. The cultures were then incubated for 5 min in basic RPMI-1640 (no glucose, Gibco) containing 1 μCi/mL 14C-glucose or 14C -lactate (Sigma, USA). The optimal 5 min time for such incubation period was established in preliminary experiments (data not shown). After washing with PBS, the protein content was determined by the BCA assay and the radioactivity incorporated to the cells was measured in a liquid scintillation counter (Tri-Carb 2800 TR, Perkin Elmer, USA). Results were expressed in dpm/μg protein.
Glucose consumption and lactate turnover assay
The cells (2×10⁴) were seeded into 48 well plates, incubated in RPMI-1640 with 1× B27 minus insulin for 24 hours, and then changed in RPMI-1640 without B27 for 24 hours; then, the cells were lysed, and the lysate and medium were collected. Glucose and lactate levels at different time points were determined with Glucose assay (Sigma, USA) and Lactate Assay (Biovision, Milpitas, CA, USA) kits as directed by the manufacturer’s instructions; fluorescent and colorimetric densities were evaluated at 570 nm with a Biotek Dynax2.
ELISA, proliferation, apoptosis, and lactate concentration measurements
Collagen I and lactate dehydrogenase levels were measured with an ELISA kit (R & D systems, USA or Life Span biological, Seattle, USA), cell proliferation and apoptosis were measured with proliferation and apoptosis kits (Roche, USA), and lactate concentrations were measured with a lactate assay kit (Promokine, USA) as directed by the manufacturers’ instructions. Measurements were quantified with a SpectraMax M3 microplate reader (Molecular Devices, USA).
ATP concentration measurement
Cells were plated onto gelatin-coated, 96-well, white, clear-bottomed culture plates (Fisher Scientific, USA). Two days later, the cells were treated with the indicated medium, and ATP levels were measured with an ATP assay kit (Invitrogen, USA) as directed by the manufacturer’s instructions. Briefly, 100 μL of the lysis and assay solution was added to the wells; then, the solutions were shaken for 1 min, and incubated for 20 min at 23°C. ATP levels were quantified with a luminometer (Synergy 2, BioTek).
Swine model of ischemia-reperfusion (IR) injury
IR injury was surgically induced in female Yorkshire swine (~13 kg, Manthei Hog Farm, MN) via a transient, 60-min occlusion of the left anterior descending coronary artery as described previously.21
Proteomics
Protein concentrations were determined in desalted samples with Bradford reagent (Bio-Rad, Hercules, CA), and then samples containing equal amounts of protein (20 μg) were labeled with iTRAQ™ reagent (ABI, Foster City, CA) as directed by the manufacturer’s instructions and as described previously.22 Assessments were performed in triplicate with iTRAQ 8-plex kits.
Strong cation exchange (SCX) chromatography, LC-MALDI and 4800 MS/MS, and peptide and protein identification
Peptide/protein isolation and identification were conducted as described previously.23
Ingenuity pathway analysis (IPA)
The selected proteins were imported to the IPA software (http://www.ingenuity.com, 2016, May) to identify their associated pathways, biological functions, and diseases. The number of genes associated with each biological function and/or disease was counted, and p values were calculated via Fisher’s exact test.
Statistical analysis
All statistical analyses were performed with Statistical Package for the Social Sciences for Windows version 17 software (SPSS, Chicago). Values are presented as mean ± standard deviation, and significance was evaluated via the Student’s t test. A p value of less than 0.05 was considered statistically significant.
RESULTS
Lactate enhances hiPSC-vSMC proliferation
hiPSCs were reprogrammed from human heart fibroblasts, engineered to express eGFP,19 and differentiated into vSMCs (hiPSC-vSMCs) and endothelial cells (hiPSC-ECs). Under standard (i.e., glucose-containing, lactate-free) culture conditions (L−), measurements of glucose uptake (Figure 1A), glucose consumption, and lactate production (Figure 1B) in hiPSC-vSMCs did not differ significantly from those in human aortic SMCs (HA-SMCs), and glucose uptake measurements were significantly greater (p<0.05) in both hiPSC-vSMCs (3.41±0.44 normalized units) and HA-SMCs (2.98±0.42) than in hiPSC-ECs (1.00±0.24). When the cells were cultured in glucose-free, lactate-enriched (L+) medium, lactate uptake (Figure 1C) in hiPSC-vSMCs (6.30 ±0.23 normalized units) and HA-SMCs (5.20±0.45) was similar and significantly greater (p<0.05) than in hiPSC-ECs (1.00±0.18), and ATP levels (Figure 1D) remained steady for at least 96 hours in hiPSC-vSMCs but declined significantly (p<0.05) over 48 and 96 hours (to 36.21±3.20% and 14.2±2.10% of the original level, respectively) in hiPSC-ECs. Intracellular lactate concentrations at saturation were also greater in hiPSC-ECs than in hiPSC-vSMCs, except under hypoxic conditions, when lactate levels in both cell types were suppressed but greater in hiPSC-vSMCs than in hiPSC-ECs (Figure 1E). Furthermore, the number of living hiPSC-vSMCs or HA-SMCs increased by approximately 55%–65% when the cells were cultured for 4 days in L+ medium, compared to just 10%–15% when the cells were cultured in L− medium (Figure 1F). The number of dead cells also increased over the 4-day culture period, but the rate of increase for cells in L+ and L− medium was not significantly different. Subsequent experiments indicated that hiPSC-vSMCs proliferated best in L+ medium when the lactate concentration was 4–8 mM (Figure 1G).
Figure 1. Lactate enhances hiPSC-vSMC proliferation.
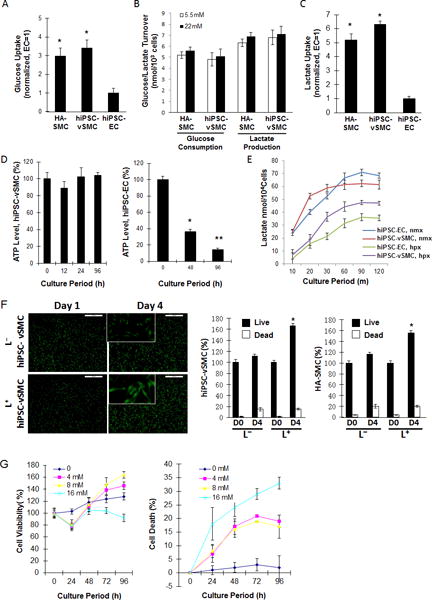
(A) Human aortic SMCs (HA-SMCs) and hiPSC-derived vSMCs (hiPSC-vSMCs) and ECs (hiPSC-ECs) were cultured in standard (i.e., lactate-free [L−]) medium; then, intracellular glucose concentrations were determined and normalized to measurements in hiPSC-ECs. (B) HA-SMCs and hiPSC-vSMCs were cultured in L− medium containing 5.5 mM or 22 mM glucose for 24 hours; then, the amount of glucose consumed and lactate produced was measured. (C) HA-SMCs, hiPSC-vSMCs, and hiPSC-ECs were cultured in glucose-free, lactate-containing (L+) medium for 20 minutes; then, intracellular lactate concentrations were determined and normalized to measurements in hiPSC-ECs. (D) hiPSC-SMCs and -ECs were cultured in L+ medium; then, intracellular ATP levels were measured at the indicated time points, normalized to the level observed at 0 h, and expressed as a percentage. (E) hiPSC-vSMCs and -ECs were cultured in L+ medium under normoxic (nmx) or hypoxic (hpx) conditions; then, intracellular lactate levels were determined at the indicated time points. (F) HA-SMCs and hiPSC-vSMCs were cultured in L+ or L− medium for 4 days; live and dead cells were quantified at the beginning (D0) and end (D4) of the culture period and expressed as a percentage of the total number of cells at D0. (G) vSMCs were cultured with the indicated concentrations of lactate. Live and dead cells were quantified at the indicated time points and expressed as a percentage of the number observed at 0 h. *P<0.05, ** P<0.01.
Lactate promotes the synthetic phenotype in cultured hiPSC-vSMCs
When cultured in L+ medium, both hiPSC-vSMCs and HA-SMCs tended to become less spindle-shaped and to develop the more irregular morphology associated with synthetic vSMCs (Figure 2A). Thus, we investigated whether lactate may induce cultured vSMCs to assume a predominantly synthetic phenotype. When hiPSC-vSMCs were cultured in L+ medium (4 mM lactate) for 3 days, mRNA levels (reported in relative units) for markers of the contractile phenotype decreased significantly (myosin heavy chain 11: from 2.30±0.22 to 0.65±0.23, p<0.05; calponin: from 1.76±0.12 to 0.43±0.14, p<0.05), while the expression of synthetic vSMC markers increased (collagen 1: from 1.30±0.24 to 2.81±0.33, p<0.05; vimentin: from 0.43±0.16 to 40.6±0.26, p<0.05) (Figure 2Bi). Similar changes were observed in Western blot analyses of marker protein levels (Figure 2Bii), and L+ cultured cells were significantly more proliferative than L− cultured cells when evaluated via both the MTT assay (p<0.01) and ki67 staining (L+: 50.6±8.92 cells/field, L−: 14.50±6.11 cells/field, p<0.01) (Figure 2C). Measurements of cell motility were also significantly greater when the cells were cultured in L+ medium than in L− medium (L+: 42.61±3.82%, L−: 7.88±1.82%; p<0.01) (Figure 2D), but the size of gels seeded with L+ cultured cells declined by just 21.22±1.0% in response to carbachol treatment, compared to a 50.42±3.20% decline in the size of gels containing L− cultured cells (p<0.01) (Figure 2E). Assessments of caspace 3 activity (L+: 4.78±0.21, L–:3.31±0.14; p<0.01) (Figure 2Fi) and Western blots of caspace 3, Annexin V, and Bcl-2 levels (Figure 2Fii) both indicated that apoptosis activity was greater in L+ cultured than in L− cultured hiPSC-vSMCs, and L+ cultured hiPSC-vSMCs produced more collagen I protein (L+: 523.95±18.24 ng/mg protein, L−: 131.31±21.77 ng/mg protein; p<0.01) (Figure 2G), while proteomics analysis indicated that a wide range of extracellular matrix proteins and transcription factors were more highly expressed in L+hiPSC-vSMCs than in L− hiPSC-vSMCs (Figure 2H). Notably, the changes in protein expression associated with the L+ medium were similar to those observed when the cells were cultured under hypoxic conditions. Thus, lactate appears to promote the synthetic phenotype in hiPSC-vSMCs.
Figure 2. Lactate promotes the synthetic phenotype in cultured hiPSC-vSMCs.
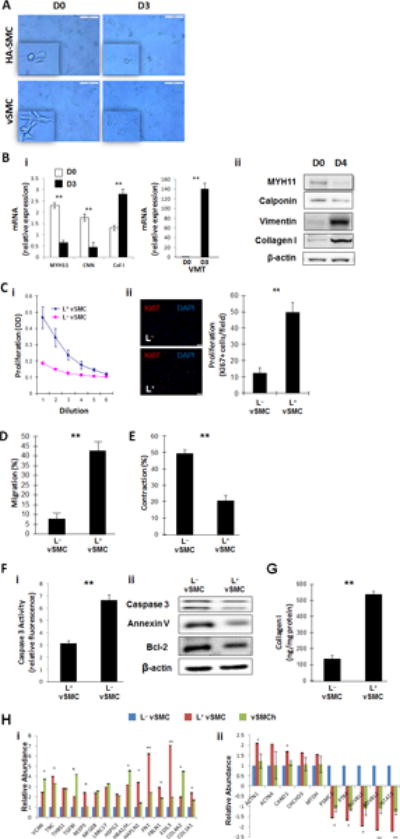
(A) hiPSC-derived vSMCs (vSMCs) and human aortic smooth-muscle cells (HA-SMC) were cultured in L+ medium for 3 days, and their morphologies were evaluated at the beginning (D0) and end (D3) of the culture period via light microscopy; bar=100 μm (B) vSMCs were cultured in L+ medium (4 mM lactate) for three or four days; the expression of markers for the contractile (myosin heavy chain 11 [MYH11] and calponin [CNN]) and synthetic (collagen I [Col 1] and vimentin [VMT]) vSMC phenotype was evaluated via (i) quantitative RT-PCR (n=4) and (ii) Western blot at the beginning (D0) and end (D3 or D4) of the culture period. (C) vSMCs were cultured for 12 hours in standard (L−) or L+ medium (i) with or (ii) without 3 ng/mL transforming growth-factor β; then, proliferation was evaluated via (i) optical density measurements of serially diluted cell solutions and (ii) immunofluorescent analyses of Ki67 expression; bar=20 μm. (D) vSMCs were cultured in L+ or L− medium and then added with 300 uL of serum free medium to the upper chamber of a cell-migration apparatus. The lower chamber contained 500 μL medium and was coated with Matrigel, and the cells that had migrated into the lower chamber were quantified 12 hours later (n=3). (E) L+ and L−vSMCs were plated onto collagen gels in 24-well culture dishes and allowed to attach overnight; then, the gels were released from the wells and images were obtained 0 and 24 hours later. Measurements at 24 hours were normalized to measurements at 0 hours and expressed as a percentage (n=3). (F) Apoptosis was evaluated in L+ and L−vSMCs by quantifying caspase 3 expression, Bcl-2 expression, and Annexin V binding via (i) quantitative RT-PCR (n=3) and/or (ii) Western blot. (G) vSMCs were cultured in L+ or L− medium for 24 hours and lysed; then, collagen levels were determined via ELISA (n=3). (H) vSMCs were cultured in L+ medium, in L− medium, or in L− medium under hypoxic conditions (vSMCh); then, the expression of (i) extracellular matrix proteins and (ii) transcription factors was evaluated via proteomics analysis. L+ medium vs L− medium with hypoxia, **P<0.01, ***P<0.001 for all panels (n=3).
Lactate-induced phenotypic modulation of hiPSC-vSMCs is mediated by monocarboxylic acid transporters (MCTs) and N-myc downstream regulated gene (NDRG)
Lactate transportation is mediated by MCTs, of which subtypes 1 and 4 are expressed in vSMCs,24, 25 and compared to assessments in L− cultured hiPSC-vSMCs under normoxic conditions, MCT mRNA levels were 6.71±0.89-fold (MCT1) and 15.18±0.48-fold (MCT4) greater when the cells were cultured in L+ medium under normoxic conditions, and 5.72±1.48-fold (MCT1) and 13.21±1.68-fold (MCT4) greater when cultured in L− medium under hypoxic conditions (Figure 3A). Furthermore, the generalized MCT inhibitor α-cyano-4-hydroxycinnamate26 (α-CHC) inhibited MCT expression by ~50% and the MCT1-specific inhibitor AZ3965 inhibited MCT1 expression by ~70% in L+ cultured cells (Figure 3B), and Western blot assessments confirmed that the response of MCT1 and MCT4 protein levels to the presence of lactate, hypoxia, α-CHC, and AZ3965 were consistent with the mRNA results (Figures 3A–3B).
Figure 3. Lactate-induced phenotypic modulation of hiPSC-vSMCs is mediated by monocarboxylic acid transporters (MCTs).
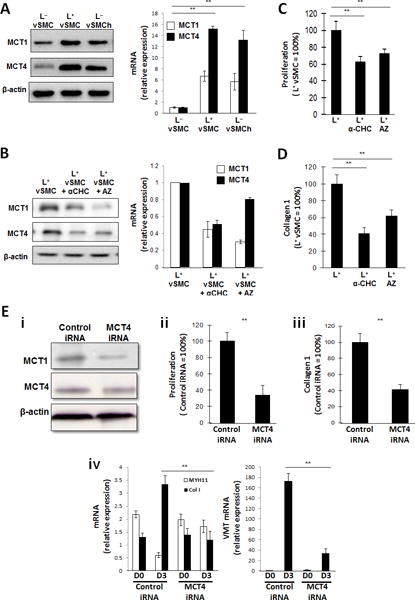
(A) hiPSC-derived vSMCs were cultured in L+ medium (L+vSMC), in L− medium (L−vSMC), or in L− medium under hypoxic conditions (L−vSMCh); then, the expression of MCT1 and MCT4 were evaluated via Western blot (left) and quantitative RT-PCR (right). mRNA levels were normalized to measurements in L−vSMC. (B-D) vSMCs were cultured in L+ medium, in L+ medium with the generalized MCT inhibitor α-CHC, or in L+ medium with the MCT1 inhibitor AZ3965 (AZ); then, (B) MCT1 and MCT4 expression was evaluated via Western blot (left) and quantitative RT-PCR (right), (C) proliferation was evaluated via proliferation assay (n= 3), and (D) collagen 1 levels were determined via ELISA (n= 3). mRNA levels were normalized to measurements in L+vSMC, and proliferation and collagen protein measurements were expressed as a percentage of measurements in cells that had been cultured in the absence of either inhibitor. (E) vSMCs were transfected with MCT4 iRNA or a scrambled iRNA sequence (Control iRNA) and cultured in L+ medium; then (i) MCT4 and MCT1 protein levels were evaluated via Western blot, (ii) proliferation was evaluated via proliferation assay (n= 3), and (iii) collagen 1 protein levels were evaluated via ELISA (n= 3); proliferation and collagen protein measurements were expressed as a percentage of measurements in cells that had been transfected with scrambled iRNA. (iv) MYH11, collagen 1 (Col 1), and vimentin (VMT) mRNA levels were evaluated via quantitative RT-PCR before (D0) and after (D3) a 3-day culture period (n= 3). **P<0.01 for all panels.
The proliferation of L+ cultured cells also declined by 37.2% in the presence of α-CHC (p<0.01), by 24.5% in the presence of AZ3965 (p<0.01) (Figure 3C), and by 64.2% (p<0.01) when the cells were transfected with MCT4 siRNA (Figure 3E), while collagen production declined by 59.4% (p<0.01), 38.2% (p<0.01), and 58.4% (p<0.01) in response to generalized MCT inhibition, MCT4-specific inhibition, and MCT4 siRNA transfection, respectively. Notably, the magnitudes of the declines in proliferation and collagen I production associated with the generalized MCT (α-CHC) and MCT-1 specific (AZ3965) inhibitors were not significantly different, which suggests that the roles of MCT1 and MCT4 in lactate-induced vSMC phenotypic modulation may differ. MCT4 iRNA transfection also altered mRNA measurements of contractile (MYH11) and synthetic (collagen 1, vimentin) vSMC marker expression: during three days of culture in L+ medium, MYH11 mRNA levels declined (from 2.18±0.14 to 0.61±0.09 relative units; p<0.01) while collagen 1 levels increased (from 3.35±0.15 to 1.19±0.23 relative units, p<0.01) in cells transfected with control siRNA but did not change significantly in cells transfected with MCT4 siRNA, and vimentin mRNA levels on day 3 were 11.4-fold greater (p<0.01) in cells transfected with control iRNA than in MCT4-iRNA–transfected cells.
The L+ medium and hypoxia also upregulated the expression of NDRG3 (Figure 4A), which is stabilized by lactate to promote angiogenesis and cell growth under hypoxic conditions,27 as well as a number of downstream components such as Raf and ERK of the NDRG3 signaling pathway (Figure 4B) that participate in cell proliferation, migration, and differentiation.28 Furthermore, when NDRG3 activity was blocked by transfecting the hiPSC-vSMCs with NDRG3 siRNA (Figure 4C), proliferation was inhibited by 43.8% (p<0.01) (Figure 4D), collagen production declined by 62.2% (p<0.01) (Figure 4E), and the expression of synthetic vSMC markers declined significantly, while contractile vSMC marker expression increased significantly (Figure 4F), in hiPSC-vSMCs that had been cultured in L+ medium.
Figure 4. Lactate-induced phenotypic modulation of hiPSC-vSMCs is mediated by NDRG3.
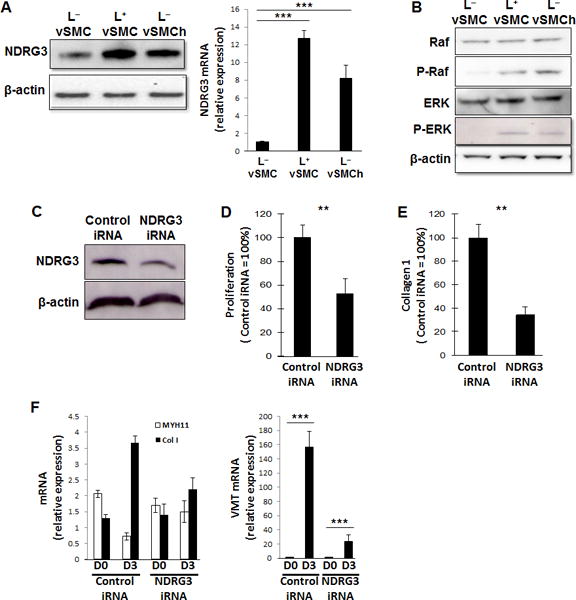
(A–B) hiPSC-derived vSMCs were cultured in L+ medium, in L− medium, or in L− medium under hypoxic conditions (L−vSMCh); then, (A) the levels of NDRG3 protein (left) and mRNA (right) were evaluated via Western blot and quantitative RT-PCR (n=3), respectively, and (B) protein levels of Raf, phosphorylated Raf (P-Raf), (ERK), and phosphorylated ERK (P-ERK) were evaluated via Western blot. (C-F) vSMCs were transfected with NDRG3 iRNA or scrambled (control) iRNA. (C) NDRG3 protein levels in NDRG3-iRNA–transfected and control-iRNA–transfected vSMCs were evaluated via Western blot. (D-E) NDRG3-iRNA–transfected and control-iRNA–transfected SMCs were cultured in L+ medium; then, (D) proliferation was evaluated via proliferation assay (n=3) and (E) collagen 1 production was measured via ELISA (n=3). (F) NDRG3-iRNA–transfected and control-iRNA–transfected vSMCs were cultured in L+ medium for 3 days; mRNA levels of MYH11, collagen 1 (Col 1), and vimentin (VMT) were measured via quantitative RT-PCR before and after the culture period (n=3). **P<0.01, ***P<0.001 for all panels.
Lactate promotes the synthetic vSMC phenotype in the hearts of swine after MI
To determine whether the results from our in vitro experiments were consistent with observations in vivo, ischemia-reperfusion (IR) injury was surgically induced in swine, and then lactate concentrations, lactate-dehydrogenase (LDH) activity, and the amount of MCT1, MCT4, and NDRG3 protein were evaluated in the remote (i.e., nonischemic) zone (RZ) and in the ischemic zone (IZ) 1 hour later. All five parameters (lactate concentration: RZ=77.72±6.71 μmol, IZ=130.12±7.89 μmol, p<0.01; LDH activity: RZ=61.14±5.73 milliunits/mg, IZ=114.88±11.19 milliunits/mg, p<0.01; and Western-blot assessments of MCT1, MCT4, and NDRG3 levels) were greater in the IZ than in the RZ (Figures 5A–5C); furthermore, vimentin expression was observed in small vessels near the border of the infarct, and the number of cells that expressed both Ki67 and vimentin were significantly higher in the IZ than in the RZ (Figure 5D). Collectively, these results suggest that IR injury may promote the proliferation of synthetic vSMCs and that this effect could be induced by increases in lactate levels.
Figure 5. Lactate promotes the synthetic vSMC phenotype in the hearts of swine after MI.
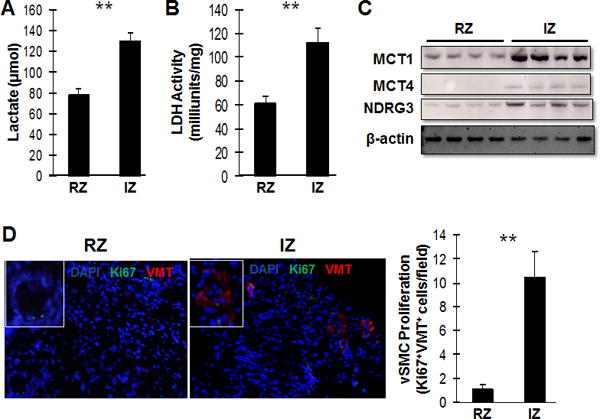
Myocardial infarction was surgically induced in the hearts of swine by occluding the left-anterior descending coronary artery for 60 minutes. (A) Lactate levels and (B) lactate dehydrogenase (LDH) levels were measured in the zone of ischemia (IZ) and in the remote (i.e., non-infarcted) zone (RZ) (n= 5). (C) MCT1, MCT4, and NDRG3 protein levels were evaluated in the IZ and RZ via Western blot. (D) Sections from the IZ and RZ were immunofluorescently stained for the presence of Ki67 (green) and vimentin (VMT, red), and nuclei were counterstained with DAPI (blue); then, the proliferation of vSMCs was evaluated by quantifying the number of cells that expressed both Ki67 and vimentin (n=5 sections per heart, 30 fields per section). **P<0.01 for all panels.
Proteomic, biomarker, and pathway analyses
Global proteomic analyses with L− and L+hiPSC-vSMCs identified and quantified 2713 proteins, 84.9% of which were present in both experimental groups. Within each experimental group, analyses of replicate samples were highly reproducible (i.e., 91.0% of the proteins identified in L−hiPSC-vSMCs and 81.6% of the proteins identified in L+hiPSC-vSMCs were observed in more than 50% of duplicates) with low variations in intensity (i.e., the coefficient of variation was <10% for >95% of identified proteins). Significant differences between L− and L+hiPSC-vSMCs were observed for 685 proteins, including 45 extracellular proteins that are involved in tissue construction or repair, most of which were expressed at higher levels in L+ than in L− cells. L+ culture conditions also upregulated the expression of 54 transcriptional or translational proteins, while biomarker analysis found significant differences for 15 proteins that are markers for vSMC identity, including tenascin-C and versican, which are associated with the synthetic phenotype. Furthermore, pathway analysis suggested that lactate altered the activity of mechanisms that regulate cell proliferation, survival, and migration; protein synthesis; gene transcription; and differentiation (Table 1)4; and the changes associated with lactate and hypoxia tended to not differ significantly (e.g., both conditions increased ILK signaling, which has been linked to the synthetic vSMC phenotype). Follow-up assessments via Western blot (Figure 6A) and quantitative RT-PCR (Figure 6B) confirmed that both lactate and hypoxia upregulate the expression of Yes-associated protein (Yap), which participates in the Hippo signaling pathway, as well as mechanistic target of rapamycin (mTOR) and adenosine monophosphate-activated protein kinase (AMPK), which are components of pathways involved in fibrosis and/or injury repair. Collectively, these observations are consistent with the role of synthetic vSMCs in myocardial repair and with our observations that lactate promotes the expression of synthetic markers, as well as proliferation and migration, in hiPSC-vSMCs.
Table 1.
Activity of canonical pathways in hiPSC-vSMCs after stimulation with lactate or hypoxia
| Ingenuity Canonical Pathways | SMC-hypoxia | SMC-lac |
|---|---|---|
| EIF2 Signaling | −2.940 | −6.021 |
| HIPPO signaling | 2.496 | 3.051 |
| ILK Signaling | 2.111 | 3.015 |
| mTOR Signaling | 3.266 | 1.633 |
| p70S6K Signaling | 1.964 | 1.528 |
| CREB Signaling | 1.698 | 1.698 |
| AMPK Signaling | 2.000 | 1.000 |
| Calcium Signaling | 1.155 | 1.155 |
| PAK Signaling | 0.447 | 1.789 |
| Signaling by Rho family GTPases | 0.866 | 1.155 |
| Telomerase Signaling | 1.213 | 0.728 |
| Regulation of eIF4 and p70S6K Signaling | 0.943 | 0.943 |
| Ephrin B Signaling | 0.905 | 0.905 |
| Protein Kinase A Signaling | −0.745 | −1.044 |
| Insulin Receptor Signaling | −0.218 | −1.528 |
| GNRH Signaling | 0.853 | 0.853 |
| Rho A Signaling | −0.667 | −1.000 |
| JAK/Stat Signaling | 1.069 | −0.535 |
| Granzyme B Signaling | 0.378 | 1.134 |
| PTEN Signaling | −0.447 | −0.894 |
| Apoptosis Signaling | −1.091 | −0.218 |
| Acute Phase Response Signaling | 1.091 | −0.218 |
| CDK5 Signaling | −0.218 | −1.091 |
| Rac Signaling | −0.378 | −0.756 |
| VEGF Signaling | 0.000 | 1.069 |
| IGF-1 Signaling | 0.535 | 0.535 |
| Agrin Interactions at Neuromuscular Junction | 0.258 | 0.775 |
| PI3K/AKT Signaling | 0.343 | 0.686 |
| PDGF Signaling | −0.728 | −0.243 |
| ERK/MAPK Signaling | 0.000 | 0.354 |
Proteins in hiPSC-vSMCs that were quantitatively changed by L+ culture conditions or hypoxia were identified via proteomics analysis and then evaluated with Ingenuity Pathway Analysis software. The results for pathways that regulate cell proliferation, survival, and migration; protein synthesis; gene transcription; and synthetic SMC differentiation are displayed.
Figure 6. Lactate upregulates the expression of proteins involved in fibrosis and/or injury repair in vSMCs.
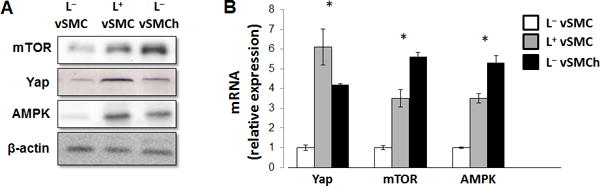
hiPSC-derived vSMCs were cultured in L+ medium, in L− medium, or in L− medium under hypoxic conditions (L−vSMCh); then, (A) the levels of mTOR, Yap, and AMPK (A) protein and (B) mRNA were evaluated via Western blot and quantitative RT-PCR, respectively (n=4). L− mediumvs L+ medium and L− medium with hypoxia all P<0.01 in RT-PCR, **P<0.01 for all panels.
DISCUSSION
The phenotype of an individual vSMC is thought to fluctuate within a continuum bounded by predominantly contractile and synthetic cells. The synthetic phenotype is characterized by higher proliferation rates, as well as the production of extracellular matrix proteins, and likely contributes to the role of vSMCs in intimal hyperplasia, hypertension, atherosclerosis, and other disease conditions.29–31 However, synthetic vSMCs also participate in a variety of beneficial physiological processes, such as the remodeling of vessels in response to vascular injury, pregnancy, or exercise.1, 32 Here, we show that the switch from a contractile to synthetic vSMC phenotype can be triggered by the presence of lactate, which has traditionally been considered a metabolic byproduct, but has more recently been shown to function as a signaling molecule13, 14 with roles in wound healing, angiogenesis, chronic inflammation, cancer development, and gene expression.11, 12, 15, 16 Thus, patients with a number of pathological conditions may respond to therapeutic interventions that target tissue lactate levels.33, 34
Because synthetic vSMCs participate in a variety of myocardial repair processes, including angiogenesis, the switch from a contractile to synthetic vSMC phenotype may be useful for treatment of cardiovascular diseases such as increase of neovascularization. However, vSMCs also contribute to fibrosis which could be counter productive or even harmful depending on location or microenvironment. The potential relationship between myocardial lactate levels and myocardial neovascularization has yet to be investigated. Although studies in the fields of cancer research and immune modulation have identified changes in SMC phenotype are associated with the amount of lactate in the cellular microenvironment, which appears to be mediated by mTOR, AMPK and PI3K-Akt,33, 34 the mechanisms by which lactate levels induce vSMC phenotypic switching in cardiovascular tissues remain unclear. The results from the current study demonstrate that lactate-induced phenotypic switching requires the activity of known lactate transporters (MCT1 and MCT4) and appears to involve the stabilization of NDRG3, which has been linked to a number of cellular activities that are associated with the synthetic vSMC phenotype, including proliferation,28 and is activated by lactate to promote angiogenesis and cell growth under hypoxic conditions.27 Furthermore, the effects of the L+ medium on lactate concentration and on MCT1, MCT4, and NDRG3 expression were similar to those observed under hypoxic culture conditions, and MI injury was associated with increases in lactate levels, in LDH activity, and in MCT1, MCT4, and NDRG3 expression, as well as in the number of cells that expressed the proliferation marker Ki67. Notably, many of the signaling molecules and pathways that contribute to vSMC proliferation such as protein kinases A-C, mitogen-activated protein kinase, the transforming growth factor β superfamily, the Ras-MAPK and PI3K-Akt pathways, also appear to have a role in vSMC phenotypic switching.35 The proteomic and pathway analyses data in the current study also confirmed that lactate induces many of these same signaling mechanisms in vSMCs.
In conclusion, the results in the present study demonstrate for the first time that vSMCs assume a more synthetic phenotype in a microenvironment that is rich in lactate. Thus, mechanisms that link glucose metabolism to vSMC phenotypic switching could play a key role in the pathogenesis and treatment of cardiovascular disease.
Supplementary Material
NOVELTY AND SIGNIFICANCE.
What Is Known?
-
❖
The phenotypes of vascular smooth muscle cells (vSMCs) change within a continuum bounded by predominantly contractile and synthetic vSMCs.
-
❖
Contractile vSMCs provide the mechanical force required for blood-pressure regulation, while synthetic vSMCs produce extracellular matrix proteins, growth factors, and other molecules that contribute to vascular remodeling in response to injury, pregnancy, and other physiological conditions.
-
❖
While lactate has traditionally been considered a metabolic product, lactate levels increase in response to ischemia
What New Information Does This Article Contribute?
-
❖
When vSMCs were cultured in glucose-free, lactate-enriched (L+) medium, activities associated with the synthetic phenotype, such as proliferation, migration, the production of proteins that participate in tissue construction or repair, and the expression of synthetic vSMC markers increased, while contractile activity and the expression of contractile proteins declined.
-
❖
The changes induced by the L+ medium were accompanied by increases in the expression of proteins involved in lactate transport and neovascularization.
-
❖
Observations in hypoxia-cultured vSMCs were similar to those in L+-cultured vSMCs, and measurements of lactate levels, lactate dehydrogenase levels, vSMC proliferation, and MCT and NDRG expression were greater in the infarct border zone than in the remote zone of infarcted porcine hearts.
The functional characteristics of vSMCs include the contractile activity, as well as participation of a variety of other physiological activities and repair mechanisms. The diversity of vSMC function is reflected in their phenotypes, which comprise a spectrum ranging from contractile cells at one end to structural synthetic cells at the other. Evidence suggest that contractile vSMCs can adopt a more synthetic phenotype in response to ischemic injury, but the mechanisms that activate this phenotypic switch are poorly understood. The results presented in this report indicate that vSMCs assume a more synthetic phenotype when cultured in the presence of lactate and, consequently, that the lactate produced during ischemic injury could trigger vSMC phenotypic switching and promote vSMC-dependent repair mechanisms.
Acknowledgments
SOURCES OF FUNDING
This work was supported by the following funding sources: NIH RO1 HL 99507, HL114120, HL 131017, UO1 HL134764.
Nonstandard Abbreviations and Acronyms
- vSMCs
vascular smooth muscle cells
- ECs
endothelial cells
- hiPSCs
human-induced pluripotent stem cells
- MCTs
monocarboxylic acid transporters
- NDRG
N-myc downstream regulated gene
- LDH
lactate-dehydrogenase
- IPA
Ingenuity pathway analysis
- IR
ischemia-reperfusion
Footnotes
DISCLOSURES
None.
References
- 1.Owens GK, Kumar MS, Wamhoff BR. Molecular regulation of vascular smooth muscle cell differentiation in development and disease. Physiol Rev. 2004;84:767–801. doi: 10.1152/physrev.00041.2003. [DOI] [PubMed] [Google Scholar]
- 2.Yang L, Geng Z, Nickel T, Johnson C, Gao L, Dutton J, Hou C, Zhang J. Differentiation of human induced-pluripotent stem cells into smooth-muscle cells: Two novel protocols. PloS one. 2016;11:e0147155. doi: 10.1371/journal.pone.0147155. [DOI] [PMC free article] [PubMed] [Google Scholar]
- 3.Bennett MR, Sinha S, Owens GK. Vascular smooth muscle cells in atherosclerosis. Circ Res. 2016;118:692–702. doi: 10.1161/CIRCRESAHA.115.306361. [DOI] [PMC free article] [PubMed] [Google Scholar]
- 4.Shi N, Chen SY. Smooth muscle cell differentiation: Model systems, regulatory mechanisms, and vascular diseases. J Cell Physiol. 2016;231:777–787. doi: 10.1002/jcp.25208. [DOI] [PubMed] [Google Scholar]
- 5.Barron JT, Parrillo JE. Production of lactic acid and energy metabolism in vascular smooth muscle: Effect of dichloroacetate. Am J Physiol. 1995;268:H713–719. doi: 10.1152/ajpheart.1995.268.2.H713. [DOI] [PubMed] [Google Scholar]
- 6.Andersen LW, Mackenhauer J, Roberts JC, Berg KM, Cocchi MN, Donnino MW. Etiology and therapeutic approach to elevated lactate levels. Mayo Clin Proc. 2013;88:1127–1140. doi: 10.1016/j.mayocp.2013.06.012. [DOI] [PMC free article] [PubMed] [Google Scholar]
- 7.Mauro C, Marelli-Berg FM. T cell immunity and cardiovascular metabolic disorders: Does metabolism fuel inflammation? Front Immunol. 2012;3:173. doi: 10.3389/fimmu.2012.00173. [DOI] [PMC free article] [PubMed] [Google Scholar]
- 8.Fischer K, Hoffmann P, Voelkl S, Meidenbauer N, Ammer J, Edinger M, Gottfried E, Schwarz S, Rothe G, Hoves S, Renner K, Timischl B, Mackensen A, Kunz-Schughart L, Andreesen R, Krause SW, Kreutz M. Inhibitory effect of tumor cell-derived lactic acid on human t cells. Blood. 2007;109:3812–3819. doi: 10.1182/blood-2006-07-035972. [DOI] [PubMed] [Google Scholar]
- 9.Vegran F, Boidot R, Michiels C, Sonveaux P, Feron O. Lactate influx through the endothelial cell monocarboxylate transporter mct1 supports an nf-kappab/il-8 pathway that drives tumor angiogenesis. Cancer Res. 2011;71:2550–2560. doi: 10.1158/0008-5472.CAN-10-2828. [DOI] [PubMed] [Google Scholar]
- 10.Leite TC, Coelho RG, Da Silva D, Coelho WS, Marinho-Carvalho MM, Sola-Penna M. Lactate downregulates the glycolytic enzymes hexokinase and phosphofructokinase in diverse tissues from mice. FEBS Lett. 2011;585:92–98. doi: 10.1016/j.febslet.2010.11.009. [DOI] [PubMed] [Google Scholar]
- 11.Hashimoto T, Hussien R, Oommen S, Gohil K, Brooks GA. Lactate sensitive transcription factor network in l6 cells: Activation of mct1 and mitochondrial biogenesis. FASEB J. 2007;21:2602–2612. doi: 10.1096/fj.07-8174com. [DOI] [PubMed] [Google Scholar]
- 12.Haas R, Smith J, Rocher-Ros V, Nadkarni S, Montero-Melendez T, D’Acquisto F, Bland EJ, Bombardieri M, Pitzalis C, Perretti M, Marelli-Berg FM, Mauro C. Lactate regulates metabolic and pro-inflammatory circuits in control of t cell migration and effector functions. PLoS Biol. 2015;13:e1002202. doi: 10.1371/journal.pbio.1002202. [DOI] [PMC free article] [PubMed] [Google Scholar]
- 13.Hsu PP, Sabatini DM. Cancer cell metabolism: Warburg and beyond. Cell. 2008;134:703–707. doi: 10.1016/j.cell.2008.08.021. [DOI] [PubMed] [Google Scholar]
- 14.Colegio OR, Chu NQ, Szabo AL, Chu T, Rhebergen AM, Jairam V, Cyrus N, Brokowski CE, Eisenbarth SC, Phillips GM, Cline GW, Phillips AJ, Medzhitov R. Functional polarization of tumour-associated macrophages by tumour-derived lactic acid. Nature. 2014;513:559–563. doi: 10.1038/nature13490. [DOI] [PMC free article] [PubMed] [Google Scholar]
- 15.Hirschhaeuser F, Sattler UG, Mueller-Klieser W. Lactate: A metabolic key player in cancer. Cancer Res. 2011;71:6921–6925. doi: 10.1158/0008-5472.CAN-11-1457. [DOI] [PubMed] [Google Scholar]
- 16.Dhup S, Dadhich RK, Porporato PE, Sonveaux P. Multiple biological activities of lactic acid in cancer: Influences on tumor growth, angiogenesis and metastasis. Curr Pharm Des. 2012;18:1319–1330. doi: 10.2174/138161212799504902. [DOI] [PubMed] [Google Scholar]
- 17.Simon DI. Inflammation and vascular injury: Basic discovery to drug development. Circ J. 2012;76:1811–1818. doi: 10.1253/circj.cj-12-0801. [DOI] [PMC free article] [PubMed] [Google Scholar]
- 18.Kudryavtseva O, Aalkjaer C, Matchkov VV. Vascular smooth muscle cell phenotype is defined by ca2+-dependent transcription factors. FEBS J. 2013;280:5488–5499. doi: 10.1111/febs.12414. [DOI] [PubMed] [Google Scholar]
- 19.Zhang L, Guo J, Zhang P, Xiong Q, Wu SC, Xia L, Roy SS, Tolar J, O’Connell TD, Kyba M, Liao K, Zhang J. Derivation and high engraftment of patient-specific cardiomyocyte sheet using induced pluripotent stem cells generated from adult cardiac fibroblast. Circulation. Heart failure. 2015;8:156–166. doi: 10.1161/CIRCHEARTFAILURE.114.001317. [DOI] [PMC free article] [PubMed] [Google Scholar]
- 20.Ye L, Chang YH, Xiong Q, Zhang P, Zhang L, Somasundaram P, Lepley M, Swingen C, Su L, Wendel JS, Guo J, Jang A, Rosenbush D, Greder L, Dutton JR, Zhang J, Kamp TJ, Kaufman DS, Ge Y, Zhang J. Cardiac repair in a porcine model of acute myocardial infarction with human induced pluripotent stem cell-derived cardiovascular cells. Cell stem cell. 2014;15:750–761. doi: 10.1016/j.stem.2014.11.009. [DOI] [PMC free article] [PubMed] [Google Scholar]
- 21.Xiong Q, Ye L, Zhang P, Lepley M, Tian J, Li J, Zhang L, Swingen C, Vaughan JT, Kaufman DS, Zhang J. Functional consequences of human induced pluripotent stem cell therapy: Myocardial atp turnover rate in the in vivo swine heart with postinfarction remodeling. Circulation. 2013;127:997–1008. doi: 10.1161/CIRCULATIONAHA.112.000641. [DOI] [PMC free article] [PubMed] [Google Scholar]
- 22.Yang L, Rudser KD, Higgins L, Rosen HR, Zaman A, Corless CL, David L, Gourley GR. Novel biomarker candidates to predict hepatic fibrosis in hepatitis c identified by serum proteomics. Dig Dis Sci. 2011;56:3305–3315. doi: 10.1007/s10620-011-1745-4. [DOI] [PMC free article] [PubMed] [Google Scholar]
- 23.Yang L, Rudser K, Golnik A, Wey A, Higgins LA, Gourley GR. Urine protein biomarker candidates for autism. J Proteomics Bioinform. 2016;S14:004. [Google Scholar]
- 24.Oikawa K, Iizuka K, Murakami T, Nagai T, Okita K, Yonezawa K, Kitabatake A, Kawaguchi H. Pure pressure stress increased monocarboxylate transporter in human aortic smooth muscle cell membrane. Mol Cell Biochem. 2004;259:151–156. doi: 10.1023/b:mcbi.0000021366.62189.9d. [DOI] [PubMed] [Google Scholar]
- 25.Kirat D, Matsuda Y, Yamashiki N, Hayashi H, Kato S. Expression, cellular localization, and functional role of monocarboxylate transporter 4 (mct4) in the gastrointestinal tract of ruminants. Gene. 2007;391:140–149. doi: 10.1016/j.gene.2006.12.020. [DOI] [PubMed] [Google Scholar]
- 26.Sonveaux P, Vegran F, Schroeder T, Wergin MC, Verrax J, Rabbani ZN, De Saedeleer CJ, Kennedy KM, Diepart C, Jordan BF, Kelley MJ, Gallez B, Wahl ML, Feron O, Dewhirst MW. Targeting lactate-fueled respiration selectively kills hypoxic tumor cells in mice. J Clin Invest. 2008;118:3930–3942. doi: 10.1172/JCI36843. [DOI] [PMC free article] [PubMed] [Google Scholar]
- 27.Lee DC, Sohn HA, Park ZY, Oh S, Kang YK, Lee KM, Kang M, Jang YJ, Yang SJ, Hong YK, Noh H, Kim JA, Kim DJ, Bae KH, Kim DM, Chung SJ, Yoo HS, Yu DY, Park KC, Yeom YI. A lactate-induced response to hypoxia. Cell. 2015;161:595–609. doi: 10.1016/j.cell.2015.03.011. [DOI] [PubMed] [Google Scholar]
- 28.Melotte V, Qu X, Ongenaert M, van Criekinge W, de Bruine AP, Baldwin HS, van Engeland M. The n-myc downstream regulated gene (ndrg) family: Diverse functions, multiple applications. FASEB J. 2010;24:4153–4166. doi: 10.1096/fj.09-151464. [DOI] [PubMed] [Google Scholar]
- 29.Gomez D, Owens GK. Smooth muscle cell phenotypic switching in atherosclerosis. Cardiovasc Res. 2012;95:156–164. doi: 10.1093/cvr/cvs115. [DOI] [PMC free article] [PubMed] [Google Scholar]
- 30.Chiong M, Morales P, Torres G, Gutierrez T, Garcia L, Ibacache M, Michea L. Influence of glucose metabolism on vascular smooth muscle cell proliferation. Vasa. 2013;42:8–16. doi: 10.1024/0301-1526/a000243. [DOI] [PubMed] [Google Scholar]
- 31.Suzuki LA, Poot M, Gerrity RG, Bornfeldt KE. Diabetes accelerates smooth muscle accumulation in lesions of atherosclerosis: Lack of direct growth-promoting effects of high glucose levels. Diabetes. 2001;50:851–860. doi: 10.2337/diabetes.50.4.851. [DOI] [PubMed] [Google Scholar]
- 32.Beamish JA, He P, Kottke-Marchant K, Marchant RE. Molecular regulation of contractile smooth muscle cell phenotype: Implications for vascular tissue engineering. Tissue Eng Part B Rev. 2010;16:467–491. doi: 10.1089/ten.teb.2009.0630. [DOI] [PMC free article] [PubMed] [Google Scholar]
- 33.San-Millan I, Brooks GA. Reexamining cancer metabolism: Lactate production for carcinogenesis could be the purpose and explanation of the warburg effect. Carcinogenesis. 2017;38:119–133. doi: 10.1093/carcin/bgw127. [DOI] [PMC free article] [PubMed] [Google Scholar]
- 34.Kelly B, O’Neill LA. Metabolic reprogramming in macrophages and dendritic cells in innate immunity. Cell research. 2015;25:771–784. doi: 10.1038/cr.2015.68. [DOI] [PMC free article] [PubMed] [Google Scholar]
- 35.Muto A, Fitzgerald TN, Pimiento JM, Maloney SP, Teso D, Paszkowiak JJ, Westvik TS, Kudo FA, Nishibe T, Dardik A. Smooth muscle cell signal transduction: Implications of vascular biology for vascular surgeons. J Vasc Surg. 2007;45(Suppl A):A15–24. doi: 10.1016/j.jvs.2007.02.06. [DOI] [PMC free article] [PubMed] [Google Scholar]
Associated Data
This section collects any data citations, data availability statements, or supplementary materials included in this article.