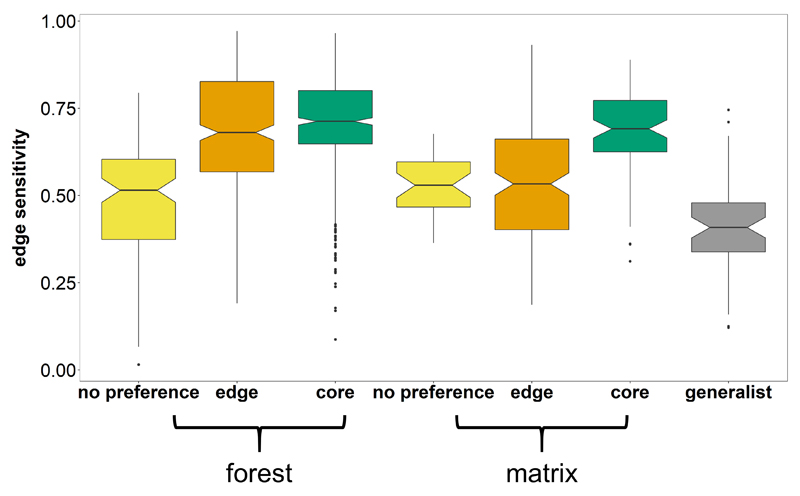
Extended Data, Fig. 2. Distribution of edge sensitivities for seven recognised edge response types.
Forest core species (n = 519) and matrix core species (n = 80) displayed significantly higher edge sensitivities compared to generalists (n = 56) and to forest (n = 112) and matrix species (n = 34) with no preference for either edge or core habitats (two-sided Pairwise Wilcoxon Signed-Rank Test with Bonferroni correction: P < 0.001). We excluded species that could not be classified (n = 113). Forest edge species (n = 338) had significantly higher edge sensitivities compared to forest no preference, matrix no preference, generalist and matrix edge species (P < 0.001). Matrix edge species (n = 165) also displayed significantly lower edge sensitivities compared to matrix core species and higher edge sensitivities compared to generalists (P < 0.001). Notched boxes show the median, 25th and 75th percentiles, error bars show 10th and 90th percentiles, and points show outliers. Notches display the 95% confidence interval around the median.

