Abstract
Purpose
To demonstrate imaging of radiofrequency ablation lesions with non-contrast-enhanced T1-weighted (T1w) MRI.
Methods
Fifteen swine underwent left ventricular ablation followed by MRI using different preparations: endocardial or epicardial ablation of naïve animal, or endocardial ablation of animal with myocardial infarction. Lesion imaging was performed using free-breathing, non-contrast-enhanced, T1w sequence with long inversion time (TI). Also acquired were T1 maps and delayed contrast-enhanced (DCE) imaging. Hearts were excised for ex vivo imaging, and sliced for gross pathology and histology.
Results
All ablations were visibly enhanced in non-contrast-enhanced T1w imaging using TI =700 ms. T1w enhancement agreed with regions of necrosis in gross pathology and histology. Enhanced lesion cores were surrounded by dark bands containing contraction band necrosis, hematoma, and edema. In animals with myocardial infarction, chronic scar was hypointense in T1w, whereas acute ablations were enhanced, allowing discrimination between chronic scar and acute lesions, unlike DCE. Contrast was sufficient to create 3D volume renderings of lesions after minor postprocessing.
Conclusions
Non-contrast-enhanced T1w imaging with long TI promises to be an effective method for visualizing necrosis within radiofrequency ablation lesions. Enhancement is more specific and stationary than that from DCE. The imaging can be repeated as needed, unlike DCE, and may be especially useful for assessing ablations during or after a procedure.
Keywords: cardiac MRI, lesion assessment, non-contrast-enhanced imaging, RF ablation, T1-weighted imaging
INTRODUCTION
A wide variety of cardiac arrhythmias are treated with radiofrequency ablation (RFA) administered by catheterization. The typical ablation catheter is instrumented with an ablation electrode at the tip and several proximal sensing electrodes to gather real-time electrogram waveforms. Other catheters instrumented with sensing electrodes are positioned for additional electrogram data. Ablation targets are typically chosen using a combination of anatomic context, electrogram characteristics, pace mapping, and electroanatomical mapping (EAM) in more complex cases. This information is used to identify locations of reentrant circuits or aberrant focal sources of triggers (1–3). These methods also indicate, in real time, any restorative effects of the ablation lesions to normal activation patterns.
However, lasting treatment requires the creation of necrotic tissue at the lesion sites, and such tissue characterization is not apparent under x-ray fluoroscopy. Incompletely ablated tissue can exhibit transient edema, which disrupts electrical conduction and gives the impression of necrotic tissue lesions. Furthermore, it is difficult to detect gaps in ablation lines or transmural extent of lesions. Any of these conditions can lead to incomplete RFA therapy, and as a result, recurrence of arrhythmia is common after certain procedures (4). Therefore, there is a need for more accurate assessment of tissue characteristics that indicate RFA lesion location and extent. Cardiac MRI presents an attractive option for the assessment of RFA therapy, as it provides excellent soft-tissue contrast that can be combined with high-resolution 3D imaging.
Earlier work attempted to visualize acute RFA lesions without T1-shortening gadolinium-based contrast agents (GBCA) (5). Delayed contrast-enhanced (DCE) imaging with GBCAs demonstrated higher contrast-to-noise ratio (CNR) between normal myocardium tissue and the lesion (6,7). However, the use of GBCAs for the evaluation of acute RFA lesions has significant disadvantages. The differences in the temporal kinetics of contrast-agent passage in various tissue states (e.g., normal myocardium, RFA lesion core and periphery, extracellular volume) resulted in clear depiction of lesions, but with a tendency to overestimate extent (8). Delayed contrast-enhanced imaging does not provide discrimination between acute RFA lesions (treatment) and chronic infarction (substrate), as both tissues accumulate contrast agent and exhibit enhancement. Edematous tissues can also become enhanced, making identification of gaps between lesions difficult. Finally, as observed in DCE viability imaging (9), the kinetics of GBCA concentration results in time-varying enhancement in and around the lesions (7), creating uncertainty in determination of lesion extent. The same temporal kinetics also limit scan duration and restrict achievable image resolution. Furthermore, the number of times DCE can be used in a single session is limited by clinical restrictions on GBCA dosage, as well as effects on imaging from accumulated contrast agent.
In methods without the use of GBCAs, the effects of RFA on native T1 and T2 decay times have been studied in canines (5) and swine (10,11). Although RFA was shown to cause changes in tissue T2 leading to image enhancement with T2-weighted (T2w) sequences, this also occurs in regions of transient edema, reducing specificity and accuracy in the determination of the extent of necrosis. However, contrast observed in T1-weighted (T1w) imaging exhibited greater specificity to necrotic tissues, although with lower CNR than DCE (5,10). It was also observed that a longer inversion time increased the relative enhancement in necrotic tissues (10); however, the imaging method used produced only 2D images and not of high enough image quality for reliable anatomic context. We propose to exploit the specificity of native T1 using a 3D inversion recovery technique with relatively long inversion time (TI) to increase contrast between normal myocardium and acute RFA lesions, allowing wholeheart acquisition with improved image quality for visualization of both lesions and anatomy (12,13). We apply this non-contrast-enhanced T1-weighted long-inversion-time (TWILITE) imaging technique in naive swine and those with previous myocardial infarction, after RFA lesions in both the left and right ventricles, and compare with DCE, ex vivo MRI, gross pathology, and histology.
METHODS
Pulse Sequence for Non-Contrast-Enhanced Lesion MRI
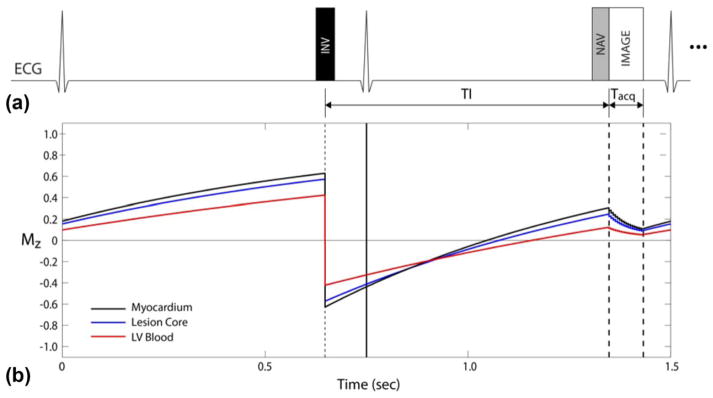
A schematic of the proposed sequence is shown in Figure 1a. From simulation, we expect signal from the three tissues of interest to behave as shown in Figure 1b. Lengthening the TI allows T1 contrast to increase between normal and ablated myocardium. A longer TI is achieved in higher heart rates using 2RR triggering as shown. The delay time before the inversion pulse is chosen to place the data acquisition window shortly before the atrial kick of the next cardiac cycle. Echocardiogram triggering and respiratory gating are used to allow free-breathing high-resolution 3D acquisitions. More detailed sequence parameters are given subsequently.
FIG. 1.
TWILITE pulse sequence. (a) Use of 2RR triggering to increase T1 contrast. (b) The Simulated signal evolution for three tissues of interest.
Simulations
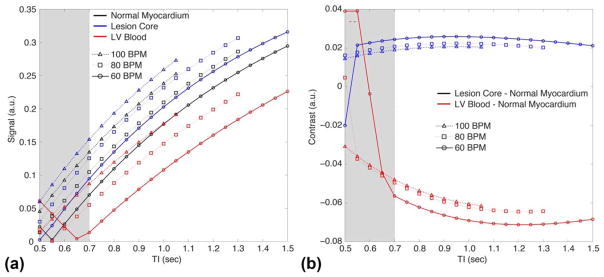
As part of sequence optimization, a Bloch equation simulator implemented in MATLAB (The MathWorks, Natick, MA) was used to estimate the signal evolution at 1.5 T in response to the proposed pulse sequence. For accurate simulation, the T1 values of the tissues were measured using the modified Look-Locker inversion recovery (MOLLI) (14), with more details provided subsequently. From these measurements, we used the following values of T1 in simulation for the normal myocardium, lesion core, and left ventricular (LV) blood, respectively: 950, 820, and 1450 ms. Other simulation parameters matched in vivo acquisitions except for the use of ideal radiofrequency (RF) pulses. The simulation predicted signal evolution as depicted in Figure 1b and signal contrast in Figure 2. Note that beyond a certain TI, the signal difference between normal myocardium and lesion core becomes relatively stable. This suggests that a range of TIs will produce similar contrast between these two tissues.
FIG. 2.
Signal (a) and contrast (b) obtained through simulation of the TWILITE sequence. For TI <700 ms (shaded region), the blood signal can be rectified in magnitude images, compromising the contrast with myocardium. Increasing TI above 700 ms slightly increases contrast between normal myocardium and lesion. LV blood suppression is strongest for lower TI values, and TI =700 ms was chosen as a good compromise.
Lesion Imaging Protocol
For in vivo non-contrast-enhanced imaging of RFA lesions, we acquired images on a Siemens 1.5T Avanto scanner (Siemens Medical Systems, Erlangen, Germany) using a standard torso phased-array surface coil placed on the chest, and table surface coils. Typical parameters for the 3D spoiled gradient-recalled echo sequence were TI =700–800 ms, 2RR triggering, flip angle =25 °, repetition time (TR)/echo time (TE) =5.4/2.7 ms, reconstructed pixel size 1.1×1.1×2.5 mm with 2× interpolation in the slice direction, segmented centric phase-encoding order with 16 segments per imaging window, GRAPPA acceleration factor (R) =2, field of view (FOV) =300 ×220 mm, matrix 272 ×200, bandwidth (BW) =200 Hz/pixel, and approximately 40 slices as required for whole-heart coverage. No changes were made to the default settings for navigator gated scans, and the typical acceptance rate was 50 to 60%. The larger than usual flip angle was used to increase T1 weighting, at the risk of slight high-frequency suppression in the phase-encode direction. The longer TI was achieved using 2RR triggering when necessary for higher heart rates. The imaging slab was prescribed on coronal, sagittal, or short-axis orientations. This protocol is usually completed in under 10 min, depending on the heart rate and respiratory navigator efficiency.
For higher-resolution scans, we reduced the slice thickness to 1.1 mm, still with 2× interpolation in the slice direction, and the segments per imaging window were reduced to 12. This protocol would be completed in approximately 15 to 20 min, again depending on heart rate and respiratory navigator efficiency.
For contrast-enhanced scans, we would use the same protocols but with TI =350–400 ms, and single RR triggering.
To verify the simulation results, additional scans were run in a subset of experiments to acquire image data with TI values of 500, 600, 700, 800, and 900 ms. Regions of interest were used to determine the signal-to-noise ratio and CNR for normal myocardium, the lesion core, and LV blood.
For the generation of T1 maps, a free-breathing, motion-compensated technique based on MOLLI was used (15). Typical imaging parameters were: 3(5)3(5)5(8) sampling pattern, pixel size 1.0×1.25×3.5 mm, flip angle =35°, TR/TE =5.6/1.3 ms with partial Fourier sampling in the readout direction, FOV =300×210–270 cm, GRAPPA R =2, BW =1028 Hz/pixel, averages 4–6.
For some hearts, T2w imaging was acquired for comparison. A 2D turbo spin-echo inversion recovery magnitude (TIRM) was used with the following parameters: TR/TE =2323/48 ms, TI =160 ms, pixel size 1.3 × 1.3 mm, FOV =340 × 265 cm, matrix 256 × 130, turbo factor 15, BW =849 Hz/pixel, GRAPPA R =2.
For ex vivo imaging, the typical imaging parameters were: 0.25 × 0.25 × 0.5 mm pixel size, flip =15 °, TR/TE =14/2.3 ms, FOV =120×120 mm, BW =1028 Hz/pixel, averages =2–4, scan duration =~30–60 min.
Ablation Protocol in Naïve Swine
All animal experiments were approved by the local Institutional Animal Care and Use Committee. Before any invasive procedure, swine were anesthetized using a combination of tiletamine, zolazepam, ketamine and xylazine, and maintained under sedation using 1–2% isoflurane. During ablation, swine were given lidocaine to reduce ventricular fibrillation. X-ray was used to guide the RF ablation catheter (NaviStar Thermocool, Biosense Webster Inc, Diamond Bar, CA) to targets in the LV. The typical ablation would last 45 s using 30 W of power (EPT-1000 XP, Boston Scientific, Marlborough, MA). Defibrillation was used as needed.
Eight naïve animals (35–50 kg) were ablated under fluoroscopy and transferred to MRI. For a subset of three animals, images of early lesion formation were obtained by performing an additional ablation in the magnet bore of the MR scanner using a custom-made catheter (16). Imaging of lesions was performed as soon as possible after ablation in sagittal, coronal, or short-axis orientations. For the subset of animals receiving an additional ablation in the magnet bore, imaging was repeated for 1 h to watch for changes in lesion appearance. For estimation of T1, a MOLLI sequence was run on slices where an ablation lesion was observed.
Three of the animals were then sacrificed without administration of contrast agent in preparation for high-resolution ex vivo imaging. The remainder were given a double dose of GBCA (Magnevist, Bayer Inc, Leverkusen, Germany), and DCE images were obtained to observe early and later phase enhancement. All but three of these animals were then sacrificed and prepared for ex vivo imaging. Those not sacrificed on ablation day were imaged over 3 weeks to observe changes in lesion visibility.
After sacrifice, hearts were excised for high-resolution ex vivo imaging. In preparation, hearts were filled with plastic epoxy to maintain end-diastolic configuration. They were placed in a plastic jar, suspended in a perfluorocarbon fluid to minimize susceptibility artifacts. After ex vivo imaging, hearts were sliced in a short-axis orientation, and select samples were sent to histology for staining with hematoxylin and eosin or Masson’s trichrome.
Ablation Protocol in Infracted Swine With Scarred Substrate
To visualize RFA lesions adjacent to preexisting chronic scar, four animals underwent left anterior descending coronary artery balloon occlusion for 120 min to create myocardial infarction (MI). After allowing 8 to 10 weeks for scar tissue to form, DCE images were acquired as a preprocedure “substrate map.” Two days later, they underwent LV ablation guided by EAM, using clinical-grade systems for catheter tracking and sensing (Ensite NavX Velocity, St. Jude Medical Inc, Saint Paul, MN). The EAM revealed healthy myocardium near scarred regions, and select locations were ablated. These MI animals were then imaged in the same manner as described previously.
Epicardial Ablation Procotol in Naïve Swine for Gap Visualization
To more precisely control the placement and distance between ablations, three animals were ablated epicardially, using the same equipment as described previously. After sternotomy, four to six RFA lesions were placed on the LV epicardium. The resulting lesions were photographed before closing the chest, then MR imaging was performed as described previously.
Measurement of T1
A free-breathing, motion-corrected MOLLI sequence was used to produce T1 maps of normal and ablated regions, in vivo. Conservative ROIs were drawn on the lesion core, lesion periphery, and normal myocardium. Mean values of multiple measurements were reported.
Because in vivo measurements remain susceptible to motion artifacts, even after motion correction, and resolution is limited, we also performed ex vivo T1 mapping on three of the animals. Regions peripheral to the lesions can contain significant edema, which dissipates after excision of the heart, thus shortening T1 values (17). To minimize the effect on T1 measurements, we performed the ex vivo imaging the same day as sacrifice, and minimized the preparation time.
RESULTS
Simulations
Simulation results show the signal available at the onset of the imaging window for three tissues of interest for three different heart rates: 60, 80, and 100 bpm (Fig. 2a). For TI <650 ms, the signal from LV blood and other tissues can have negative values and be rectified in magnitude images depending on heart rate, compromising the contrast between blood and myocardium. At TI ~ 700 ms, the signal from blood is close to its minimum value, and always positive for heart rates up to 120 bpm. The contrast between the lesion core and normal myocardium (Fig. 2b) does not change significantly with heart rate for TI >600 ms. Therefore, the simulation results suggest that TI ~ 700 ms would provide a good compromise between lesion enhancement and suppression of LV blood signal.
Non-Contrast-Enhanced Lesion Imaging
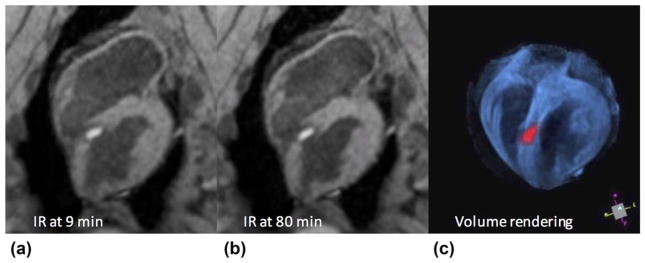
Ablation lesions in the LV are readily visible in the non-contrast-enhanced T1w images produced with the proposed sequence. Figure 3 shows a septal lesion created from ablation with the animal in the MR scanner. Figures 3a, b were acquired at 9 and 80 min after ablation, respectively. Enhancement of the lesion core develops soon after ablation, surrounded by a dark transition band, which gross pathology and histology suggest is a combination of edema, hematoma, and contraction band necrosis (CBN). No appreciable change in lesion size, shape, or band thickness was seen during the time between image acquisition at 9 and 80 min. The cavitary blood was suppressed because of its longer T1, facilitating discrimination between lesion and cavity. Figure 3c shows a volume rendering created from the original stack of inversion recovery images in Figure 3a, window/level/opacity chosen to suppress blood, and pseudo-colored in blue (VTK, Kitware, NY). The same source images were thresholded to isolate enhanced lesion core, pseudo-colored red, and co-displayed with the volume rendering. This demonstrates a 3D interactive display of anatomy and treatment, which may be useful for intraprocedural guidance.
FIG. 3.
Typical lesion appearance from the 3D TWILITE sequence (TI =700 ms, no contrast agent), acquired 9 min (a) and 80 min (b) after septal LV ablation. Lesion core is enhanced and surrounded by a dark transition band of edema, hematoma, and CBN. Anatomy and treatment may be rendered in 3D using simple thresholding and pseudo-coloring (c), which may be useful for treatment monitoring, targeting, or navigation.
Effect of Inversion Time
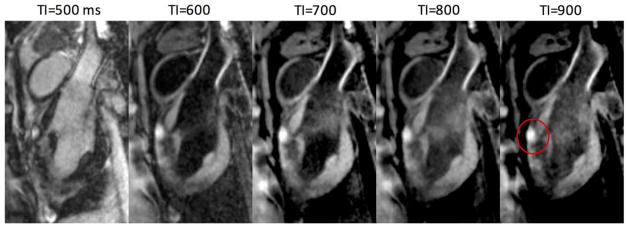
The effect of varying TI on tissue contrast was tested using the non-contrast-enhanced T1w sequence. The sequence was run with TI times of 500–900 ms, and a representative slice containing the center of an epicardial lesion is shown for each value of TI (Fig. 4). At TI =500 ms, the cavitary blood and some other tissues have negative values and are rectified in the magnitude images. The other images with longer TI show similar lesion contrast and decreasing LV blood suppression. The CNR was estimated among lesion core (peak value), normal myocardium, and cavitary blood near the apex. The root-mean-square (RMS) CNR numbers were estimated to indicate overall separation among the three tissues of interest (Table 1). The results suggest that a TI in the range of 700–800 ms is most effective, which agrees with the simulation. Based on this result, we chose TI =700 ms for increased blood suppression, and used this TI to produce the experimental results presented herein.
FIG. 4.
Images acquired using different inversion times show the effects on contrast. Lesion core enhancement is seen on anterior wall (red circle) in this sagittal view. Shorter TI results in greater LV blood suppression, unless rectified, whereas higher TI slightly increases contrast between normal myocardium and blood.
Table 1.
Values Recorded from Images With Varying TI
| TI | Lesion-myocardium CNR | Myocardium-blood CNR | Lesion-blood CNR | RMS CNR |
|---|---|---|---|---|
| T1w 500 | 44.7 | 40.9 | 85.6 | 60.6 |
| 600 | 61.2 | 44.6 | 105.8 | 75.1 |
| 700 | 70.8 | 65.0 | 135.8 | 96.1 |
| 800 | 71.8 | 60.9 | 132.7 | 93.9 |
| 900 | 73.9 | 44.1 | 118.0 | 84.3 |
| DCE 350 | 98.6 | ~46.2 | 52.5 | 69.8 |
Note: The CNR was estimated between lesion and myocardium, myocardium and blood, and lesion and blood. The RMS CNR was calculated to indicate the overall performance of the individual CNRs. Although the lesion-myocardium CNR continues to increase with TI, RMS CNR suggests that TI =700–800 ms is an effective range for separating the three tissues of interest. For comparison, the CNR values for DCE populate the bottom row, and show higher CNR for lesion-myocardium but lower for myocardium-blood and lesion-blood. T1w shows better overall separation than DCE.
For comparison, we show DCE numbers from this experiment in the bottom row of Table 1. The DCE imaging shows higher CNR for lesion-myocardium, but lower for myocardium-blood and lesion-blood. The RMS CNR numbers indicate that T1w achieves better overall separation than DCE.
Measurement of T1
For in vivo imaging in normal myocardium, the mean T1 was 1005 ms. Lesion core exhibited a shorter T1 as expected, with a mean of 935 ms. In the dark band surrounding the lesion core, T1 was estimated at 1229 ms. The T1 in LV blood was measured at 1404 ms.
For ex vivo imaging, the mean T1 in normal myocardium was slightly longer (1078 ms), whereas the T1 values were considerably shorter in lesion core (815 ms) and the dark surrounding band (994 ms). The disparity between in vivo and ex vivo measurements could be caused by partial-volume effects or motion artifact in the in vivo scan, or there may be T1 shortening caused by dissipation of edema during the ex vivo preparation (17).
Lesion Visualization in Thick and Thin Myocardial Walls
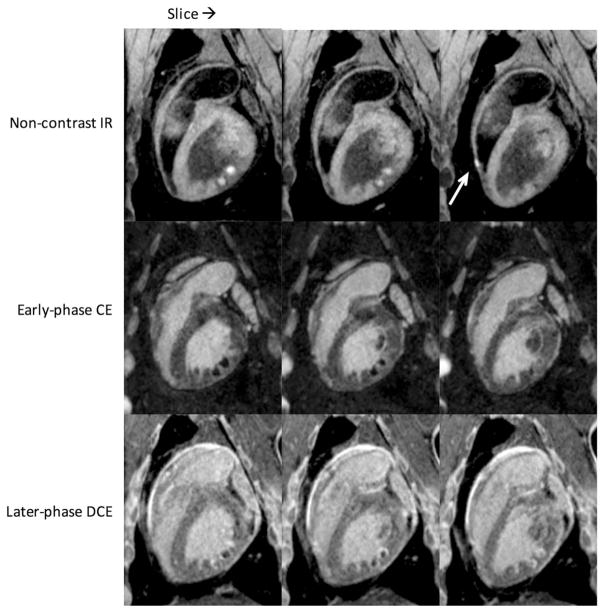
Figure 5 shows lesion images from an experiment in which multiple endocardial ablations were performed in the LV and one in the right ventricle (RV). The top row consists of adjacent slices using the proposed non-contrast-enhanced T1w technique; the middle and bottom rows show early and later-phase contrast-enhanced imaging, in which acquisition started 1 min and 20 min after injection, respectively. In non-contrast-enhanced images, bright lesion cores and dark surrounding bands are clearly visible. In the rightmost slice, the arrow points to an ablation in a thin-walled region of the RV. The combination of positive contrast and blood suppression allows detection of this lesion even in thin myocardial walls.
FIG. 5.
Consecutive slices from endocardial ablation study showing multiple lesions in the LV (opposite RV) and one in the RV (arrow). Native enhancement is visible even in thin RV wall. The top row is non-contrast-enhanced T1w with TI =700 ms; middle row is early-phase contrast enhancement with TI =300 ms, sequence starting 1 min after contrast injection; bottom row is the same 20 min later (DCE). Note the changing appearance of the lesions from early to later-phase contrast enhancement. A rotating 3D volume rendering of the T1w images from the top row is provided in Supporting Video S1.
The image contrast was sufficient to create a 3D volume rendering using the slices from the non-contrast-enhanced images (top row). A movie of this rendering being rotated is available in Supporting Video S1. This type of visualization may be useful for navigation, checking for gaps, or assessment of overall treatment progress. No segmentation was performed in the production of the rendering, only simple operations such as careful selection of window/level, translucency for darker pixels, and “scissor editing” for quick trimming around the heart (OsiriX, Pixmeo, Bernex, Switzerland). Ample image contrast is obtained as a result of the native differences in relaxation times among healthy myocardium, lesion core, and cavitary blood. Hypointense transition bands are readily apparent between the brighter lesion core and healthy myocardium.
The early-phase contrast-enhanced images show dark “no-flow” regions, which compare in size to the enhanced regions of the non-contrast images, with contrast agent accumulating at the edges. The later-phase DCE images show that contrast agent is entering the lesion cores, obscuring the borders in a time-evolving manner.
To compare lesion size seen in non-contrast-enhanced and contrast-enhanced images, identical multiplanar reformat was performed on the images from Figure 5 to avoid oblique measurements. Lesion core sizes measured along the myocardial wall were in accord between the non-contrast-enhanced and early contrast-enhanced images: 6.4 and 6.7 mm, respectively. The late-gadolinium-enhancement image exhibits characteristic shrinking of the hypointense core (7), measuring 4.7 mm. The thickness of the dark band surrounding the lesion core in the non-contrast-enhanced image was 2 mm on average.
Open Chest Experiments
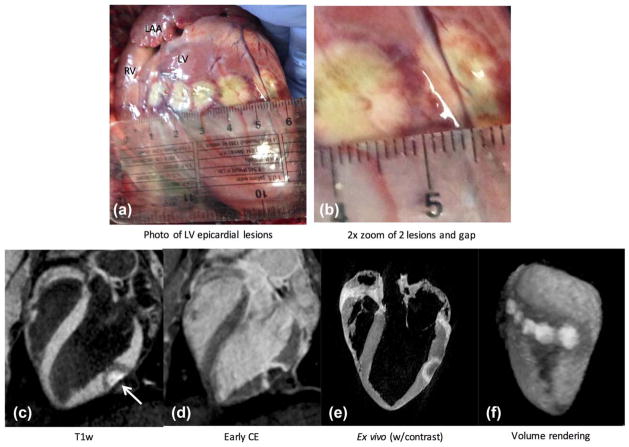
Open-chest experiments facilitated controlled placement and spacing of multiple lesions along the epicardium. In the following experiment, several colinear ablations were performed at different spacings, as shown in Figure 6. Lesion cores are evident in the photograph as nearly circular whitish regions. Each lesion core is surrounded by two thin transition bands, each approximately 1 mm thick. The inner band appears to be hemorrhagic with its splotchy dark red color, whereas the outer band appears more gray/blue and likely contains a combination of edema, hematoma, and CBN. Edematous regions extend beyond the transition bands, likely the result of manipulation or surface injury.
FIG. 6.
Epicardial lesions administered during an open-chest experiment. (a, b) Lesion core is identifiable with beige color, surrounded by a heterogeneous transition band tissue with dark red color, and a band of lighter grayish color, likely made up of CBN and edema. (c) Long-axis image from the proposed non-contrast-enhanced T1w technique shows enhanced lesion core and surrounding hypoin-tense band (arrow). LV blood is suppressed, facilitating identification of ablated tissue. (d) Contrast-enhanced image acquired on same slice. Animal was given a second dose of contrast agent and sacrificed shortly afterward. (e) Corresponding image from high-resolution ex vivo scan. (f) Volume rendering of the 3D slices gives good depiction of lesion cores and surrounding hypointense regions in anatomical context. A rotating view of this rendering is provided in Supporting Video S2.
A 3D T1w acquisition was performed, and the slice shown in Figure 6c intersects one of the ablations (far right one in the photograph). Enhanced lesion core on anterior epicardial surface and surrounding dark band, which spatially corresponds to those seen in the photograph, are clearly seen. Cavitary blood signal is suppressed, facilitating identification of lesion. For comparison, the same slice from early-phase contrast-enhancement (Fig. 6d) indicates that contrast agent has not reached the lesion core, even though this image is 25 min after injection, whereas accumulation of contrast agent is seen in a surrounding band. The animal was sacrificed shortly after the late-gadolinium-enhancement scans, and the heart was removed. After fixation, ex vivo imaging was performed (Fig. 6e) to obtain higher-resolution images for comparison. In a similar fashion, the T1w images were used to create a 3D volume rendering (Fig. 6f), which is shown rotating in Supporting Video S2.
The surface width of the lesion core compared favorably, measuring at 13.6 mm in the noncontrast image, 12.9 mm in the contrast-enhanced image, 12.2 mm in ex vivo, and 13.1 mm in the photograph. The surrounding band in the non-contrast-enhanced image is approximately 4.5 mm thick (average of multiple measurements), which is greater than we typically observe for endocardial ablations. Although the band was 3.2 mm thick in late gadolinium enhancement, and 3.0 mm in ex vivo, the two bands seen in the photograph have a total thickness of approximately 2 mm.
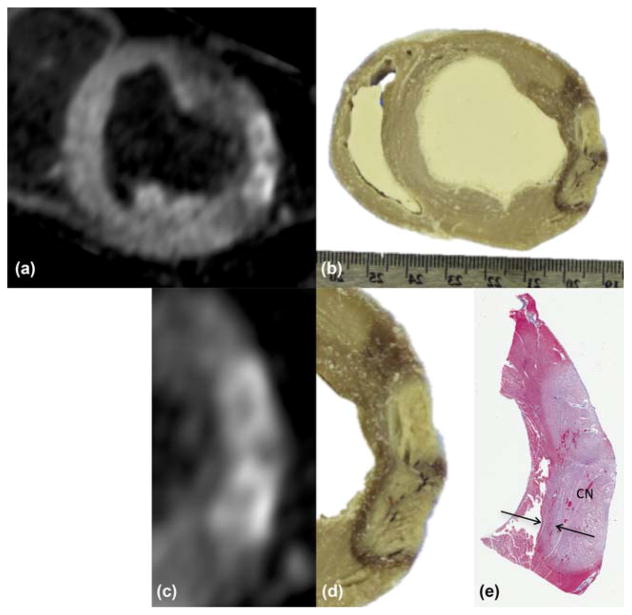
Comparison was performed by slicing the heart for gross pathology and histology. Starting from the non-contrast-enhanced 3D T1w images in Figure 6c, a multi-planar reformat was performed with the plane oriented visually to match that of the photograph (Figs. 7a and 7b). Two adjacent lesions are visible in this plane with overlapping transition bands. These subregions are zoomed and displayed (Figs. 7c and 7d) with the corresponding histological sample, stained using Masson’s trichrome (Fig. 7e). The enhanced regions in T1w images are similar in shape and size to the core regions in the photograph and histology. The hypointense bands surrounding lesions in the T1w images extend further than the transition bands seen in pathology, as they also contain edema, which would tend to dissipate after excision of the heart.
FIG. 7.
(a) Multiplanar reformat of images from previous figure, showing short-axis view through lesions in zoom inset of Figure 6b. (b) Photograph of tissue slice through same lesions, showing correspondence. (c, d) Zoom of subregion from (a) and (b). (e) Corresponding tissue slice after Masson’s trichrome stain. Lighter region indicates coagulation necrosis (CN) at lesion core; arrows denote transition band of CBN or hematoma.
The images in Figure 7 were used to compare measurements of lesion depth. The overall wall thickness decreased by approximately 25% in the stained sample, and was used as a correction factor. Lesion depth was measured through the middle of the enhancement region for each lesion. For the lower lesion in the figure, the depth was 7.9, 8.1, and 8.3 mm in MRI, gross pathology and histology, respectively. The same measure for the upper lesion was 7.5, 7.1 and 7.3 mm, respectively.
Persistence of Lesion Enhancement
As described, survival experiments were run to observe changes in lesion appearance over 3 weeks. These animals were recalled once per week for imaging and sacrificed on day 21. During this period, in all cases, lesions enhancement persisted without apparent change in core contrast, morphology or size, as shown for one of the animals in Figure 8. The dark band surrounding the lesion core tended to dissipate after the first imaging session. This result demonstrates that intrinsic T1 enhancement remains for weeks after the ablation lesions are created.
FIG. 8.
Survival experiment showing lesion enhancement over 21 days. Images were acquired weekly and animal was sacrificed on day 21. The image from day 0 appears more diastolic because of the lower heart rate. Lesion core enhancement, morphology, and size do not change appreciably during this period. The dark surrounding band dissipates during the first week. Similar results were obtained in all survival experiments.
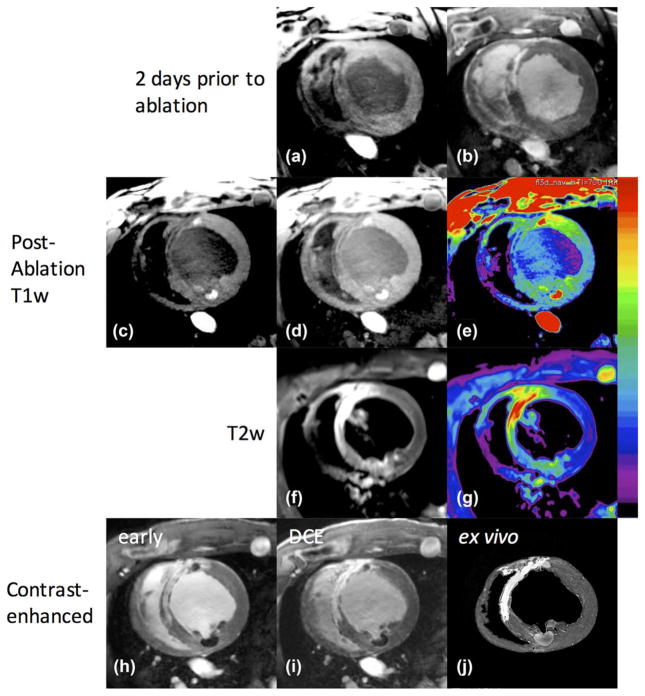
Lesion Visualization in Infarcted Hearts
Creating myocardial infarction allowed us to test the visualization of ablation lesions against a background of scarred myocardium. This creates a clinically relevant scenario for the typical patient population receiving RFA treatment for cardiac arrhythmias. A NavX velocity system was used to generate an EAM, which revealed patches of normally functioning endocardium embedded in or immediately adjacent to the scar. The ablation catheter was guided to this normal myocardium using the NavX and x-ray, and multiple ablations were performed. Figure 9 shows the MR images obtained from one animal, 2 days before ablation (Figs. 9a and 9b), and in the hours following the ablation (Figs. 9c–9i) and ex vivo (Fig. 9j). The slice orientations in the different sessions were not identical, as they were acquired on different days, but serve for illustration. The pre-ablation images show scar as hypointense in T1w images (Fig. 9a) and enhanced in DCE (Fig. 9b). After ablation, the acute lesions enhance (Fig. 9c) as shown previously, whereas the scar remains hypointense. The lesion at 11:00 was created immediately adjacent to the scar, whereas the lesion at 5:00 is in a normal region. Brightness is increased in Figure 9d for better visualization of scar regions, and the color map is applied in Figure 9e to visualize both scar in low dynamic range and lesion cores in high dynamic range. The acute lesion is readily distinguishable from the chronic scar. Note that the shape of the lesion core enhancement is influenced by the surrounding scar tissue. T2w images from the TIRM sequence (Fig. 9f) show enhancement in scarred regions and lower, less-selective enhancement of lesion core and surrounding edematous area. In early-phase contrast enhancement (Fig. 9h), scar is enhanced and the acute lesion cores are not, as we have shown previously. However, in delayed enhancement (Fig. 9i), the contrast agent has entered the acute lesion region and becomes less distinguishable from the chronic scar. High-resolution ex vivo images (Fig. 9j) corroborate scar and ablation locations.
FIG. 9.
Images of infarcted animal before and after endocardial ablation. Two days before ablation: scar is hypointense in T1w (a), and enhanced in DCE (b). After ablation: (c) T1w with window level adjusted for viewing of normal and ablated myocardium, lesion core enhancement seen at approximately 11:00 in a region containing scar, and 5:00 in a normal region; (d) brightness increased to show hypointense regions of scar; (e) color map applied for better visualization of scarred (low dynamic range), normal, and ablated regions (high dynamic range). (f) T2w images acquired with TIRM sequence; (g) color map applied for better visualization of T2 enhancement in scar (yellow/red), and lower, less-selective enhancement of lesion core and surrounding edematous area (green). (h) Early contrast enhancement showing scar regions enhanced and lesion cores unenhanced, whereas delayed imaging (i) shows contrast agent entering the lesion cores. (j) Ex vivo images corroborate scar and ablation locations.
Similar results were seen in other experiments. Chronic scar is hypointense in T1w images, whereas acute lesions are enhanced and visible against the scar. After injection of contrast agent, acute lesions are visible as hypointense regions only in early phase images; however, they soon fill with contrast agent and become less distinguishable from chronic scar.
DISCUSSION
Acute ablation lesions are well visualized using non-contrast-enhanced T1w MR imaging. Contrast between normal and ablated myocardium is increased using relatively long TI, while providing some suppression of blood. The enhanced lesion core and dark surrounding band of edema, hematoma, and CBN are clearly seen in both endocardial and epicardial walls, whether thick as in the LV, or thin as in the apical RV. Ready lesion identification, even in thin tissue walls, encourages further work in the left atrium.
In our results, a TI in the range of 700 to 800 ms produced the best contrast between normal and ablated myocardium and LV blood, which agreed with the TIs suggested in (10). For most heart rates encountered, 2RR triggering was used to allow lengthening of the TI. This could leave the sequence more vulnerable to arrhythmias, in which case saturation recovery with single RR triggering could produce better image quality than the 2RR technique.
The non-contrast-enhanced scan requires 10 to 15 min to complete, depending on resolution, heart rate, and respiratory navigator efficiency. If used during an MR-guided procedure, it is perhaps best suited for periodic use to visualize all acute ablation lesions created thus far. To monitor the progress of a single ablation in real time, MR thermography shows feasibility (18,19). Intrinsic contrast is sufficient to create 3D volume renderings of the lesions after minimal postprocessing, which may lead to better understanding of lesion topology within anatomical context, and perhaps improved navigational guidance. The dark bands surrounding the lesion cores increased conspicuity in the renderings by providing natural edge enhancement.
A non-contrast-enhanced protocol is advantageous since, unlike DCE, it can be repeated as often as needed, and the pattern of image contrast is relatively stable, appearing within minutes of ablation (20,21) and remaining for weeks. Because scar tissue appears dark in the non-contrast-enhanced images, it is possible to differentiate between acute RF ablations and chronic scar. A DCE scan performed in the days before the ablation procedure could provide a substrate map for procedure planning. With proper registration tools, the substrate map could be combined with EAM and other methods to guide the ablation catheter to treatment targets. Then it would be possible to render both substrate and treatment in one display.
Gross pathology and histology show correspondence between (a) the regions of enhancement in T1w MRI, (b) the blanched regions in gross pathology (photographs), and (c) the regions in Masson’s trichrome typically associated with coagulation necrosis. The results compare favorably, but more comprehensive measurements are needed to assert statistical correlation between the T1w MRI and pathology/histology; these are being performed in our lab and will be reported separately. The hypointense regions (dark bands) surrounding the enhanced lesion cores appear to include several tissue states, such as hematoma, contraction band necrosis, and edema. Future experiments will determine the role of the hypo-intense bands in conduction block, and whether omitting the dark bands from measurements of lesion size causes underestimation.
Survival experiments suggest that the intrinsic T1 enhancement remains for weeks after the ablation lesions are created. We note that this is in contradiction to the results reported previously (22). A limitation of the experiments reported herein is that the animals survived only 3 weeks. Other experiments are being conducted to extend this for several additional weeks, and observe the lesion transformation into fibrotic scar tissue. Because scar tissue appears dark in the T1w images, we would expect to see the lesion core to darken as it becomes fibrotic (23).
The proposed non-contrast-enhanced T1w MRI technique exhibited enhancement that appeared specific for lesion necrosis. By comparison, early-phase contrast-enhanced images exhibited hypointense regions of similar size and shape to lesion cores seen with native T1w enhancement, but with contrast agent accumulating at the edges where edema and hematoma are known to occur. However, this enhancement pattern continuously evolves as the contrast agent enters the lesion cores. The inclusion of edema/hematoma and the time-evolving nature of the contrast-enhancement pattern increases difficulty in making accurate estimates of necrotic extent, and is a possible cause of acute lesion size overestimation. T2w imaging shows a different enhancement pattern: relatively low-grade enhancement surrounding lesions where edema is expected, and stronger enhancement in regions of scar tissue. Further work will clarify the utility of the T2w enhancement pattern in the context of RF ablation.
CONCLUSIONS
A non-contrast-enhanced T1w pulse sequence with long TI was demonstrated to produce images of RFA lesions in swine with readily visible contrast between the lesion core and normal myocardium with suppression of LV blood signal. A surrounding hypointense band of hematoma/CBN/edema was also regularly evident in the T1w images. Comparison with gross pathology and histology showed agreement with enhanced regions in MRI. Lesion contrast was strong, regardless of time after ablation or heart rate, as predicted by simulations. Unlike contrast-enhanced imaging, in which the contrast distribution and enhancement pattern change substantially over time, the same TI could be used in all cases, and image contrast remained consistent and easily interpretable. Chronic scar tissue was hypointense in non-contrast-enhanced T1w imaging, allowing for specific visualization of acute ablations against a background of chronic scar tissue from preexisting MI. This imaging technique could be of benefit for the assessment of RFA therapy without relying on the use of contrast agents.
Acknowledgments
Grant sponsor: NIH; Grant numbers: R01HL094610, R01HL126092, and R21EB023515.
Footnotes
Henry Halperin is a founder of Imricor Inc. and receives royalties.
SUPPORTING INFORMATION
Additional Supporting Information may be found in the online version of this article.
Video S1. Non-contrast-enhanced T1w images from the experiment shown in Fig. 5 were used to create a volume rendering, which is rotated in the movie. Enhancement of multiple endocardial lesion cores are evident in both LV and RV. Lower intensities are displayed with lower opacity; thus, the dark regions surrounding the lesion cores appear translucent. An anterior portion of the heart was cut away to reveal the chambers.
Video S2. Non-contrast-enhanced T1w images from the epicardial lesion experiment shown in Fig. 6 are displayed in a volume rendering, which is rotated in the movie. Enhancement of all lesion cores are visible, as are the dark surrounding regions from edema, hemorrhage, and hematoma. A posterior portion of the heart is cut away to reveal the chambers.
References
- 1.Stevenson WG, Wilber DJ, Natale A, et al. Irrigated radiofrequency catheter ablation guided by electroanatomic mapping for recurrent ventricular tachycardia after myocardial infarction: the multicenter thermocool ventricular tachycardia ablation trial. Circulation. 2008;118:2773–2782. doi: 10.1161/CIRCULATIONAHA.108.788604. [DOI] [PubMed] [Google Scholar]
- 2.Earley MJ, Showkathali R, Alzetani M, Kistler PM, Gupta D, Abrams DJ, Horrocks JA, Harris SJ, Sporton SC, Schilling RJ. Radiofrequency ablation of arrhythmias guided by non-fluoroscopic catheter location: a prospective randomized trial. Eur Heart J. 2006;27:1223–1229. doi: 10.1093/eurheartj/ehi834. [DOI] [PubMed] [Google Scholar]
- 3.Nayyar S, Wilson L, Ganesan AN, et al. High-density mapping of ventricular scar: a comparison of ventricular tachycardia (VT) supporting channels with channels that do not support VT. Circ Arrhythm Electrophysiol. 2014;7:90–98. doi: 10.1161/CIRCEP.113.000882. [DOI] [PubMed] [Google Scholar]
- 4.Marchlinski FE, Haffajee CI, Beshai JF, et al. Long-term success of irrigated radiofrequency catheter ablation of sustained ventricular tachycardia: post-approval THERMOCOOL VT Trial. J Am Coll Cardiol. 2016;67:674–683. doi: 10.1016/j.jacc.2015.11.041. [DOI] [PubMed] [Google Scholar]
- 5.Dickfeld T, Kato R, Zviman M, Nazarian S, Dong J, Ashikaga H, Lardo AC, Berger RD, Calkins H, Halperin H. Characterization of acute and subacute radiofrequency ablation lesions with nonenhanced magnetic resonance imaging. Heart Rhythm. 2007;4:208–214. doi: 10.1016/j.hrthm.2006.10.019. [DOI] [PMC free article] [PubMed] [Google Scholar]
- 6.Lardo AC, McVeigh ER, Jumrussirikul P, Berger RD, Calkins H, Lima J, Halperin HR. Visualization and temporal/spatial characterization of cardiac radiofrequency ablation lesions using magnetic resonance imaging. Circulation. 2000;102:698–705. doi: 10.1161/01.cir.102.6.698. [DOI] [PubMed] [Google Scholar]
- 7.Dickfeld T, Kato R, Zviman M, et al. Characterization of radiofrequency ablation lesions with gadolinium-enhanced cardiovascular magnetic resonance imaging. J Am Coll Cardiol. 2006;47:370–378. doi: 10.1016/j.jacc.2005.07.070. [DOI] [PMC free article] [PubMed] [Google Scholar]
- 8.Oshinski JN, Yang Z, Jones JR, Mata JF, French BA. Imaging time after Gd-DTPA injection is critical in using delayed enhancement to determine infarct size accurately with magnetic resonance imaging. Circulation. 2001;104:2838–2842. doi: 10.1161/hc4801.100351. [DOI] [PubMed] [Google Scholar]
- 9.Thomson LE, Kim RJ, Judd RM. Magnetic resonance imaging for the assessment of myocardial viability. J Magn Reson Imaging. 2004;19:771–788. doi: 10.1002/jmri.20075. [DOI] [PubMed] [Google Scholar]
- 10.Celik H, Ramanan V, Barry J, et al. Intrinsic contrast for characterization of acute radiofrequency ablation lesions. Circ Arrhythm Electrophysiol. 2014;7:718–727. doi: 10.1161/CIRCEP.113.001163. [DOI] [PubMed] [Google Scholar]
- 11.Kholmovski EG, Ranjan R, Angel N, Marrouche N. Abstract 17376: novel non-contrast MRI technique for visualization of ablation lesions. Circulation. 2015;132:A17376. [Google Scholar]
- 12.Herzka D, Ding H, Pashakhanloo F, Schuleri K, Kolandaivelu A, Mcveigh ER, Halperin HR, Zviman M, Beinart R. Assessment of myocardial radiofrequency ablation lesions with 3D high resolution free-breathing T2 mapping. Proceedings of the 21st Annual Meeting of ISMRM; Salt Lake City, Utah, USA. 2013. Abstract 0259. [Google Scholar]
- 13.Guttman M, Tao S, Kolandaivelu A, Fink S, Halperin H, Herzka D. Non-contrast-enhanced imaging of radiofrequency ablation lesions in normal and infarcted myocardium. J Cardiovasc Magn Reson. 2017:19. [Google Scholar]
- 14.Messroghli DR, Radjenovic A, Kozerke S, Higgins DM, Sivananthan MU, Ridgway JP. Modified look-locker inversion recovery (MOLLI) for high-resolution T1 mapping of the heart. Magn Reson Med. 2004;52:141–146. doi: 10.1002/mrm.20110. [DOI] [PubMed] [Google Scholar]
- 15.Kellman P, Larson AC, Hsu LY, Chung YC, Simonetti OP, McVeigh ER, Arai AE. Motion-corrected free-breathing delayed enhancement imaging of myocardial infarction. Magn Reson Med. 2005;53:194–200. doi: 10.1002/mrm.20333. [DOI] [PMC free article] [PubMed] [Google Scholar]
- 16.Nazarian S, Kolandaivelu A, Zviman MM, et al. Feasibility of real-time magnetic resonance imaging for catheter guidance in electro-physiology studies. Circulation. 2008;118:223–229. doi: 10.1161/CIRCULATIONAHA.107.742452. [DOI] [PMC free article] [PubMed] [Google Scholar]
- 17.Thickman DI, Kundel HL, Wolf G. Nuclear magnetic resonance characteristics of fresh and fixed tissue: the effect of elapsed time. Radiology. 1983;148:183–185. doi: 10.1148/radiology.148.1.6856832. [DOI] [PubMed] [Google Scholar]
- 18.Kolandaivelu A, Zviman MM, Castro V, Lardo AC, Berger RD, Halperin HR. Noninvasive assessment of tissue heating during cardiac radiofrequency ablation using MRI thermography. Circ Arrhythmia Electrophysiol. 2010;3:521–529. doi: 10.1161/CIRCEP.110.942433. [DOI] [PMC free article] [PubMed] [Google Scholar]
- 19.Toupin S, Bour P, Lepetit-Coiffé M, et al. Feasibility of real-time MR thermal dose mapping for predicting radiofrequency ablation outcome in the myocardium in vivo. J Cardiovasc Magn Reson. 2017;19:14. doi: 10.1186/s12968-017-0323-0. [DOI] [PMC free article] [PubMed] [Google Scholar]
- 20.Guttman M, Kolandaivelu A, Fink S, Halperin H, Herzka DA. Towards MRI-guided cardiac ablation procedures with no contrast agent: safety and efficacy considerations. J Cardiovasc Magn Reson. 2016;18:P213. [Google Scholar]
- 21.Krahn P, Ramanan V, Biswas L, Xu R, Barry J, Yak N, Anderson K, Singh S, Pop M, Wright GA. Intrinsic MRI visualizes RF lesions within minutes after MR-guided ablation. J Cardiovasc Magn Reson. 2016;18:P206. doi: 10.1186/s12968-018-0437-z. [DOI] [PMC free article] [PubMed] [Google Scholar]
- 22.Kholmovski E, Ranjan R, Angel N, Vijayakumar S, Marrouche NF. Visibility of RF ablation lesions in native T1-weighted MRI reduces with time after ablation. J Cardiovasc Magn Reson. 2016;18:196. [Google Scholar]
- 23.Brown JJ, Peck WW, Gerber KH, Higgins CB, Strich G, Slutsky RA. Nuclear magnetic resonance analysis of acute and chronic myocardial infarction in dogs: alterations in spin-lattice relaxation times. Am Heart J. 1984;108:1292–1297. doi: 10.1016/0002-8703(84)90756-7. [DOI] [PubMed] [Google Scholar]


