

Abstract
The development of methods for in vivo detection of cerebral beta amyloid retention and tau accumulation have been increasingly useful in characterizing preclinical Alzheimer’s disease (AD). While the association between these biomarkers and eventual AD has been demonstrated among cognitively intact older adults, the link between biomarkers and neurocognitive ability remains unclear. We conducted a meta-analysis to test the hypothesis that cognitively intact older adults would show statistically discernable differences in neuropsychological performance by amyloid status (amyloid negative=A−, amyloid positive=A+). We secondarily hypothesized a third group characterized by either CSF tau pathology or neurodegeneration, in addition to amyloidosis (A+/N+ or Stage 2), would show lower neuropsychology scores than the amyloid positive group (A+/N− or Stage 1) when compared to the amyloid negative group. Pubmed, PsychINFO, and other sources were searched for relevant articles, yielding 775 total sources. After review for inclusion/exclusion criteria, duplicates, and risk of bias, 61 studies were utilized in the final meta-analysis. Results showed A+ was associated with poorer performance in the domains of global cognitive function, memory, language, visuospatial ability, processing speed, and attention/working memory/executive functions when compared to A−. A+/N+ showed lower performances on memory measures when compared to A+/N− in secondary analyses based on a smaller subset of studies. Results support the notion that neuropsychological measures are sensitive to different stages of preclinical AD among cognitively intact older adults. Further research is needed to determine what constitutes meaningful differences in neuropsychological performance among cognitively intact older adults.
Keywords: cognition, preclinical Alzheimer’s disease, biomarker, meta-analysis
INTRODUCTION
Alzheimer’s disease (AD) is an age-related condition clinically characterized by a progressive deterioration of episodic memory and other cognitive abilities, and pathologically characterized by beta amyloid plaque and tau pathology accumulation in the brain. Many recent advances have been made in detecting abnormal beta amyloid and tau pathology levels in vivo, and these coupled with an interest in early AD intervention and prevention have emphasized the importance of better characterizing the preclinical AD phase through the identification of biomarkers (Sperling et al., 2011). The identification of AD biomarkers has also yielded theoretically-informed models of the temporal sequence of biomarker presentation in the preclinical phase (e.g., Jack et al., 2010, Jack et al., 2013), and these have had a significant impact upon the field of AD research.
While the search for potential AD biomarkers has yielded numerous promising possibilities, in vivo assessments of the presence of amyloid plaque and tau pathology remain arguably some of the most salient and clinically-relevant biomarkers utilized in the preclinical phase. Previous work has reliably shown cognitively intact persons who are deemed amyloid positive as high risk for progressing to AD (Villegmagne et al., 2013; Andreasen et al., 2001). However, the link between AD biomarkers and cognitive abilities is less clear. Models of biomarker sequencing based on the amyloid cascade hypothesis (Hardy and Higgins, 1992; Hardy and Selkoe, 2002) suggest accumulation of AD pathology occurs prior to cognitive impairment or even subtle cognitive decline (Jack et al., 2010). However, recent work supports the notion that neuropsychological performance may inversely correlate with amyloid load among cognitively intact older adults (Hedden et al., 2013). If meaningful differences in neuropsychological performance can be observed according to AD biomarker status (positive versus negative), then this has significant implications for proposed biomarker sequence models of AD and may provide additional avenues for early intervention and prevention of AD.
The preclinical phase of AD has recently been operationalized to consist of distinct stages reflecting increasing progression of the AD pathological process (Sperling et al., 2011; Dubois et al., 2016), which can be described as a series of stages: Stage 1) asymptomatic amyloidosis, Stage 2) amyloidosis + neuronal injury, and Stage 3) amyloidosis + neuronal injury + subtle cognitive decline. Characterizing the degree of cognitive decline detectable in older adults who are biomarker positive but do not meet threshold for current operational definitions of mild cognitive impairment (i.e., “cognitively normal” older adults) will help further efforts to define subtle cognitive decline. Additionally, further investigation into cognitive function during earlier preclinical AD stages will inform whether subtle decline or impairment is restricted to individuals with both amyloidosis and neurodegeneration or whether these may be detectable at an even earlier stage (i.e., Stage 1 or 2).
To the authors’ knowledge, there has yet to be a systematic review of the literature to test whether differences in neuropsychological performance are perceivable at the biomarker positive and negative group level among those deemed cognitively intact by current standards. We therefore conducted a meta-analysis to test the hypothesis that cognitively intact older adults would show statistically discernable differences in neuropsychological performance by biomaker status. Specifically, we hypothesized older adults deemed amyloid positive would show poorer scores than those deemed amyloid negative across specific domains of cognition. We secondarily tested the hypothesis that amyloid positive older adults who additionally show evidence of neuronal injury based on tau pathology or neurodegeneration as defined by MRI (A+/N+ or Stage 2) would show poorer neuropsychology scores than the amyloid positive group without evidence of neuronal injury (A+/N− or Stage 1) with respect to the amyloid negative group (A− or Stage 0). These hypotheses challenge the null hypothesis that there are no discernable differences in neuropsychological performance among persons deemed cognitively intact who differ with respect to preclinical AD biomarker status.
METHODS
Literature Search
Guidelines from the Preferred Reporting Items for Systematic reviews and Meta-Analyses (PRISMA) were utilized for this research project (Liberati et al, 2009). In accordance with PRISMA guidelines, systematic review criteria were documented with the international prospective register of systematic reviews PROSPERO system (registration number: CRD42016046527). Literature search was conducted on August 28, 2016. The range of dates for articles was not restricted. The search term “amyloid and (control or normal) and (cognition or neuropsychology) and (PET or CSF or cerebrospinal fluid)” was applied to the PubMed and PsychINFO databases. PET was used as a common abbreviation for positron emission tomography, and CSF was used a common abbreviation for cerebrospinal fluid.
Inclusion/Exclusion Criteria
The following were used as inclusion criteria: (1) mean age greater than 50 years old, (2) human participant studies, (3) participants with cognition in the normal range (i.e., determined to be “cognitively normal” by not meeting criteria for dementia, mild cognitive impairment (MCI) or subtle cognitive impairment characterizing stage 3 preclinical AD, when the latter was defined within the study), and (4) report of at least one neuropsychological measure. We instituted an age cut point to exclude studies of younger groups that may not be directly relevant to AD (e.g., traumatic brain injury studies). The following were used as exclusion criteria: (1) studies focused on animal studies, (2) studies focused on another topic (e.g., traumatic brain injury, Parkinson’s disease, HIV), (3) duplicate studies, (4) data not grouped as biomarker positive and negative, (5) citations that were not empirical, peer-reviewed scientific articles (e.g., dissertations, books, abstract only, case studies), and (6) the absence of neuropsychological or cognitive data reported among cognitively normal participants.
Data Extraction and Risk of Bias
An author (CPN) independently reviewed all individual titles and abstracts of citations yielded from searches and other sources per the inclusion and exclusion criteria. These were also reviewed by a second author (SDH). A third author (DAN) served as a tie-breaker if there was disagreement regarding a particular citation. Full-text articles were downloaded and reviewed whenever there was a question as to one of the selection criteria. Risk of bias was assessed at the study level. Articles were assessed for selective reporting, incomplete outcome data, quality of experimental design, and undue influence of funding sources. Quality of experimental design entailed review of methods for parameters such as ensuring adequate numbers per biomarker group, consideration of basic demographic factors, and IRB approval for research procedures. Undue influence of funding sources was considered if a study’s findings were viewed to be potentially influenced by funding institutions or organizations. If an article was judged to indicate a potential risk of bias, it was excluded from the review. As in the case for inclusion and exclusion criteria, each article was reviewed by at least two authors (CPN and SDH) for potential risk of bias, and a third author (DAN or NHS) served as a tie-breaker for any disagreements.
Data Analysis
The outcomes for the present study were neuropsychological performance scores on any neuropsychological measure by biomarker group (e.g., amyloid positive vs. negative). Neuropsychological measure scores were grouped to assess for any specific effects by domain. The following seven domains were assessed: global cognitive function, memory, language, visuospatial, processing speed, attention/working memory/executive functions, and premorbid function. Table 1 lists the neuropsychological measures that were observed in the articles and used in the present review according to each measure’s corresponding cognitive domain. If more than one neuropsychological measure was reported in a single study for a given cognitive domain, outcomes were pooled across the study and the mean effect size was used as the study’s contribution per meta-analysis convention. The principle summary measures were standard differences in means (Hedges’ g; Hedges, 1981) as calculated by random effects models. Random effects models assume that the true effect size might differ from study to study. Thus, results are weighted, and inferences may be extended beyond the studies included in the meta-analysis (Hedges and Vevea, 1998). Heterogeneity refers to variability or diversity of studies included in a systematic review, and may be considered at multiple levels, including outcomes, study design, bias, and statistical inference. This is important to consider in a meta-analysis because heterogeneity may impact the robustness and generalizability of results. Heterogeneity was considered via statistical calculation of Q, Tau, Tau2, and I2. Q provides a measure of absolute heterogeneity of effects with a corresponding p-value (Cochran, 1954). Tau and Tau2 provide measures of the standard deviation and variance of true effects respectively (Borenstein et al., 2009). These provide a basis for comparison across studies. I2 refers to a ratio of true effect variance to observed error variance (Higgins et al., 2003). In two-group analyses (amyloid positive vs. negative) that yielded significant results, method of biomarker assessment (CSF vs. PET) was explored as a possible moderating variable in post-hoc analyses. We also explored the impact of age differences in post-hoc meta-regression analyses. In our secondary analyses that included studies that also characterized subjects as tau or neurodegeneration positive, analyses were conducted using the amyloid negative group (A−) as a control group to test effects between (1) amyloid positive and tau/neurodegeneration negative (A+/N− or stage 1) and (2) amyloid positive and tau/neurodegeneration positive (A+/N+ or stage 2) groups. If fewer than five studies were available for a particular analysis, the analysis was not conducted due to lack of adequate data as a quality control measure. Meta-analyses were conducted using Comprehensive Meta-Analysis (CMA) software, version 3.3.070 (Biostat, Englewood, NJ). Forest plots were visualized using CMA, and significance was determined using an alpha of p<0.05.
TABLE 1.
Neuropsychological Measures by Domain
| Domain | Abbreviation | Test |
|---|---|---|
| Global | ADAS-Cog | Alzheimer’s Disease Assessment Scale cognitive subscale |
| Cognitive composite | Calculated Z-score from cognitive domains (i.e. episodic, semantic, working, and visuospatial memory) | |
| Global | Composite Global Cognition Score | |
| MDRS | Mattis Dementia Rating Scale | |
| MMSE | Mini Mental State Examination | |
| Non-Memory | Composite Non-Memory Score | |
| WMS Mental Control | Wechsler Memory Scale – Mental Control | |
| STMS | Short Test of Mental Status | |
|
| ||
| Memory | AVLT Delayed Recall | Auditory Verbal Learning Test – Delayed Recall |
| AVLT Recall | Auditory Verbal Learning Test – Recall | |
| AVLT Recognition | Auditory Verbal Learning Test – Recognition | |
| BVRT Delayed | Benton Visual Retention Test – Delayed | |
| CVLT-II Delayed Recall | California Verbal Learning Test, second edition – Delayed Recall | |
| CVLT-II Immediate Recall | California Verbal Learning Test, second edition – Immediate Recall | |
| CVLT-II Learning | California Verbal Learning Test, second edition – Sum of Learning Trials | |
| CVLT-II Recognition | California Verbal Learning Test, second edition – Recognition | |
| Detail Accuracy | Detail Accuracy (per trial) | |
| Episodic Memory | Composite Episodic Memory Score | |
| FCSRT | Free and Cued Selective Reminding Test | |
| FCsrt | Free and Cued Selective Reminding Test—Cued Recall subtest | |
| FCSRT-L | Free and Cued Selective Reminding Test – Learning | |
| FCSRT-R | Free and Cued Selective Reminding Test – Recall | |
| FCSRT-TL | Free and Cued Selective Reminding Test – Total Learning | |
| FCSRT-TR | Free and Cued Selective Reminding Test – Total Recall | |
| F-Name letter | Rentz Face-Name Task | |
| FRsrt | Free and Cued Selective Reminding Test—Free Recall subtest | |
| Gist correct rejection rate | Gist Memory Task – correct rejection rate | |
| Gist hit rate | Gist Memory Task – items remembered | |
| Gist sensitivity d’ | Gist Memory Task – sensitivity d’ | |
| ISLT | International Shopping List Task | |
| M@T | Memory Alteration Test | |
| Mem Factor Score | Memory Factor Score | |
| Memory | Composite Memory Score | |
| One Card Learning Task | Cogstate One Card Learning task | |
| Rey-3′ Recall | Rey-Osterrieth Complex Figure 3-Minute Recall | |
| Rey-30′ Recall | Rey-Osterrieth Complex Figure 30-Minute Recall | |
| RCFT Immediate | Rey-Osterrieth Complex Figure – Immediate Recall | |
| RCFT Delayed | Rey-Osterrieth Complex Figure – Delayed Recall | |
| SRT (6-Trial Selective Reminding Test): total recall | 6-Trial Selective Reminding Test | |
| SRT: long delayed recall | Selective Reminding Test: Long Delayed Recall | |
| SRT: short delayed recall | Selective Reminding Test: Short Delayed Recall | |
| Verbal Memory | Verbal Episodic Memory (included CVLT-II long delay free recall and CVLT-II d’ recognition scores, and Logical Memory delayed recall) | |
| Visual Memory | Visual Episodic Memory (included Rey Complex Figure Test 30-minute delayed recall, Cogstate One Card Learning task, and Cogstate One Back task) | |
| WMS Associate Learning | Wechsler Memory Scale – Associate Learning | |
| WMS Delayed Recall | Wechsler Memory Scale – Delayed Recall Index Score | |
| WMS Immediate Recall | Wechsler Memory Scale – Immediate Recall Index Score | |
| WMS-R Logical Memory Delayed | Wechsler Memory Scale, Revised – Logical Memory Delayed | |
| WMS-R Logical Memory Immediate | Wechsler Memory Scale, Revised – Logical Memory Immediate | |
| WMS-R Mem | Wechsler Memory Scale, Revised – Logical Memory Story A | |
| WMS-R Paired Associates Immediate Recall | Wechsler Memory Scale, Revised – Paired Associates Immediate Recall | |
| WMS VR Delayed Recall | Wechsler Memory Scale – Visual Reproduction Delayed Recall | |
| WMS VR Immediate Recall | Wechsler Memory Scale – Visual Reproduction Immediate Recall | |
| Word List Delayed Recall score | Consortium to Establish a Registry for Alzheimer’s Disease Word List Learning – Delayed Recall Score | |
|
| ||
| Language | BNT | Boston Naming Test |
| CAT | Category Generation – Animals, Vegetables, and Fruits | |
| CF | Categorical Fluency | |
| FAS | Controlled Oral Word Fluency to the letters F-A-S | |
| Language | Composite Language Score | |
| LF | Letter Fluency | |
| Phonemic Fluency | Verbal Fluency – Phonemic | |
| Semantic Fluency | Verbal Fluency – Semantic | |
| SM | Composite Semantic Memory Score | |
| Verbal Fluency – Animals | Category Generation – Animals | |
| Verbal Fluency – Vegetables | Category Generation – Vegetables | |
| Vocabulary | Composite Vocabulary Score | |
| WAIS Information | Wechsler Adult Intelligence Scale | |
|
| ||
| Visuospatial | BPSO | Behavioral Pattern Separation-Object Task |
| GMLT composite | Groton Maze Learning Task – Composite score | |
| GMLT moves/s (MPS) | Groton Maze Learning Task – Moves Per Second | |
| GMLT Total Errors (TER) | Groton Maze Learning Task – Total Number of Errors | |
| Perceptual comparison, ms | Perceptual Comparison Task (milliseconds) | |
| PDT | Perceptual Digital Test | |
| RCFT Copy | Rey-Osterrieth Complex Figure – Copy | |
| Rey | Modified Rey Osterrieth Figure Recalls | |
| VFDT | Visual Form Discrimination Test | |
| Visuospatial | Composite Visuospatial Score | |
| VOSP Numbers | Visual Object and Space Perception Battery Number Location Task | |
| WAIS Block | Wechsler Adult Intelligence Scale – Modified Block Design Subtest | |
| WAIS-R Block | Wechsler Adult Intelligence Scale, Revised – Modified Block Design Subtest | |
|
| ||
| Processing Speed | DSST | Digit Symbol Substitution Test |
| Motor speed, tap/second, left hand | Basic motor speed | |
| Sensorimotor speed, ms | Sensorimotor speed mean (milliseconds) | |
| Speed | Composite Processing Speed/Attention Score | |
| WAIS-III Digital Symbol | Wechsler Adult Intelligence Scale, third edition – Digital Symbol | |
| WAIS-III Symbol Search | Wechsler Adult Intelligence Scale, third edition – Symbol Search | |
| WMS-R Digit Symbol Coding | Wechsler Memory Scale, Revised – Digit Symbol Coding | |
|
| ||
| Premorbid | AMNART | American National Adult Reading Test |
| WTAR IQ | Premorbid Intelligence Quotient – Wechsler Test of Adult Reading | |
| VIQ | Verbal Intelligence Quotient | |
|
| ||
| Attention/WM/EF | Attention | Composite Attention Score |
| CAT | Category Generation (60 seconds to 3 categories, animals, vegetables, and fruit) | |
| Clock Drawing | Spontaneous Clock Drawing | |
| Conceptual comparison, ms | Conceptual Comparison Task (milliseconds) | |
| Digit Span | Wechsler Adult Intelligence Scale, third edition – Digit Span | |
| DSB | Digit Span Backward | |
| DSF | Digit Span Forward | |
| Executive Function | Composite Executive Function Score | |
| Hayling incongruent- congruent conditions, ms | Hayling Test – incongruent-congruent conditions (milliseconds) | |
| Letter Sternberg Task RT | Letter Sternberg Task Response Time | |
| Letter Sternberg Task Accuracy | Letter Sternberg Task Proportion Correct | |
| Letter Sternberg Task d’ | Letter Sternberg Task d’ scores | |
| LNS | Wechsler Adult Intelligence Scale, third edition – Letter-Number Sequencing | |
| LS | Listening Span Task | |
| Matrix Reasoning | Wechsler Adult Intelligence Scale, third edition – Matrix Reasoning | |
| N-back | N-back Task Score | |
| One Back Task | Cogstate One Back Task | |
| RPM | Raven’s Progressive Matrices (range 0–36) | |
| Stroop Test incongruent-neutral conditions, ms | Stroop Color-Word Interference – incongruent-neutral conditions (milliseconds) | |
| Stroop Test no. of intrusions | Stroop Color-Word Interference – number of intrusions | |
| Stroop Test response time differences | Stroop Color-Word Interference – response time differences | |
| TMT A | Trail Making Test A | |
| TMT B | Trail Making Test B | |
| WMS-R DSB | Wechsler Memory Scale, Revised – Digit Span Backward | |
| WMS-R DSF | Wechsler Memory Scale, Revised – Digit Span Forward | |
| Working Memory | Composite Working Memory Score | |
RESULTS
Study Selection
Search of databases yielded 754 sources, and additional 21 articles were identified through other sources (e.g., articles known to co-authors). This yielded a total of 775 sources screened. Of these, 71 were identified as animal studies and 29 were identified as either an abstract only, review article, opinion article, case study, dissertation, or book. After exclusion of these, 675 sources remained. Of these, 252 were determined to be duplicates, 166 were determined to focus on another topic, 22 were found to have no cognitive data for a normal cognition group, and 164 did not have data grouped by biomarker group (positive or negative). After these exclusions, 71 articles remained in the qualitative synthesis. Further assessment of articles revealed 7 with data in a different format than could be used in the present study (e.g., cognitive data presented in median and IQR, or in regression models with multiple covariates). In an attempt to include these 7 articles, requests were sent via email to corresponding authors for data in the form needed to conduct meta-analyses, but data were not received by the date of preparation of this manuscript. Risk of bias was assessed for the remaining studies, and 2 studies were found to include persons with MCI in the reportedly cognitively normal group, and 1 study was found to have questionable data due to extremely low numbers of participants per group. After these exclusions, 61 studies remained for the quantitative meta-analysis. The flowchart for determination of the studies reviewed for this meta-analysis is presented in Figure 1.
Figure 1.

Meta-Analysis Flow Diagram
Amyloid Positive Versus Negative
Demographic data per study are presented in Table 2. Meta-analyses of neuropsychological measure data revealed a significant difference such that amyloid positive persons scored poorer than amyloid negative persons in global cognitive function (57 studies: Hg=−0.124, SEg=0.039, 95% Cl=−0.200 to −0.049, p=0.001), memory (34 studies: Hg=−0.171, SEg=0.041, 95% Cl=−0.252 to −0.090, p<0.001), language (25 studies: Hg=−0.152, SEg=0.039, 95% Cl=−0.229 to −0.075, p<0.001), visuospatial ability (16 studies: Hg=−0.132, SEg=0.045, 95% Cl=−0.221 to −0.043, p=0.004), processing speed (12 studies: Hg=−0.199, SEg=0.095, 95% Cl=−0.384 to −0.013, p=0.036), and attention/working memory/executive functions (22 studies: Hg=−0.122, SEg=0.040, 95% Cl=−0.200 to −0.044, p=0.002). Heterogeneity was found to be within the low to moderate range for global cognitive function (Q=95.664, p=0.001, I2=41.462, Tau=0.178, Tau2=0.032), memory (Q=48.154, p=0.043, I2=31.470, Tau=0.127, Tau2=0.016), processing speed (Q=18.439, p=0.072, I2=40.345, Tau=0.203, Tau2=0.041), language (Q=24.769, p=0.418, I2=3.105, Tau=0.035, Tau2=0.001), visuospatial ability (Q=14.999, p=0.451, I2<0.001, Tau<0.001, Tau2<0.001), and attention/working memory/executive functions (Q=16.992, p=0.712, I2<0.001, Tau<0.001, Tau2<0.001). Amyloid positive persons scored higher on measures of premorbid functioning than amyloid negative persons (11 studies: Hg=0.171, SEg=0.061, 95% Cl=0.051 to 0.291, p=0.005), and it should be noted that the heterogeneity for this analysis was found to be very low (Q=4.630, p=0.915, I2<0.001, Tau<0.001, Tau2<0.001). Forest plots are presented for the domains of global cognitive function (Figure 2), memory (Figure 3), language (Figure 4), visuospatial ability (Figure 5), processing speed (Figure 6), attention/working memory/executive functions (Figure 7), and premorbid functioning (Figure 8).
Table 2.
Demographic data for participants in amyloid positive versus amyloid negative analysis
| N | Age | Education | Sex | ||||||||||
|---|---|---|---|---|---|---|---|---|---|---|---|---|---|
|
|
|||||||||||||
| Study | Biomarker | Amyloid− | Amyloid+ | Amyloid− | Amyloid+ | Amyloid− | Amyloid+ | Amyloid− | Amyloid+ | ||||
| M | SD | M | SD | M | SD | M | SD | %F | %F | ||||
| Aizenstein et al. (2008) | PET | 29 | 9 | 73.4 | 6 | 74.2 | 5.4 | 14.9 | 2.6 | 14.3 | 2.8 | 69 | 56 |
| Alcolea et al. (2015) | CSF | 203 | 26 | 57.3 | 6.5 | 60.6 | 7.9 | – | – | – | – | 59.1 | 69.2 |
| Amariglio et al. (2012) | PET | 97 | 34 | 72.7 | 5.9 | 75.5 | 6 | 16.3 | 2.9 | 15.6 | 1 | 51.5 | 57.1 |
| Amariglio et al. (2015) | PET | 122 | 32 | 71.6 | 5.7 | 73.1 | 5 | 15.9 | 3 | 16.4 | 2.7 | 63.1 | 59.4 |
| Besson et al. (2015) | CSF | 46 | 8 | 64.5 | 8 | 73.1 | 6.9 | 11.9 | 3.7 | 11 | 3.7 | 46 | 75 |
| Besson et al. (2015) | PET | 42 | 12 | 66 | 8.7 | 65 | 7.3 | 11.8 | 3.8 | 11.4 | 3.5 | 52 | 42 |
| Buckley et al. (2016) | PET | 230 | 58 | 69 | 5.9 | 72 | 7.2 | – | – | – | – | 54 | 50 |
| Chen et al. (2015) | PET | 88 | 26 | 77.7 | 6.5 | 77.2 | 4.6 | 16.6 | 3 | 16 | 2.5 | 45 | 38 |
| Chetelat et al. (2010) | PET | 31 | 13 | 73.1 | 7.1 | 78.8 | 5.5 | 14 | 3.3 | 14.3 | 3 | 65 | 31 |
| Chetelat et al. (2012) | PET | 54 | 20 | 72.7 | 7.3 | 76.6 | 6.4 | 14.2 | 3.2 | 14.1 | 3.4 | 52 | 40 |
| Donohue et al. (2014) | PET | 60 | 37 | 74.8 | 5.4 | 77.5 | 4.7 | 15.2 | 2.9 | 15.5 | 3.2 | 50 | 32 |
| Doraiswamy et al. (2012) | PET | 59 | 10 | 68.5 | 11.3 | 77.3 | 8 | 15.2 | 2.4 | 15.9 | 0.7 | 62.7 | 40 |
| Doraiswamy et al. (2014) | PET | 57 | 10 | 68.7 | 11.3 | 77.3 | 8 | 15.2 | 2.4 | 15.9 | 0.7 | 63.2 | 40 |
| Edmonds et al. (2015) | CSF | 142 | 48 | 72.3 | 6.8 | 71.8 | 6.7 | 16.2 | 2.6 | 16.1 | 3 | 48.6 | 54.2 |
| Elman et al. (2014) | PET | 33 | 16 | 76.8 | 5.3 | 75.6 | 4.7 | 16.7 | 1.7 | 16.4 | 2.3 | 61 | 56 |
| Fortea et al. (2011) | CSF | 18 | 15 | 68.3 | 6.4 | 72.7 | 7.9 | 10.4 | 4.6 | 9.7 | 3.9 | 56 | 53 |
| Fripp et al. (2008) | PET | 10 | 5 | 70.3 | 8.2 | 76 | 2.7 | – | – | – | – | 40 | 80 |
| Gidicsin et al. (2015) | PET | 140 | 46 | 73.7 | 5.9 | 76.6 | 6.1 | 16.2 | 2.7 | 16.3 | 2.8 | 53 | 61 |
| Gietl et al. (2015) | PET | 74 | 11 | 67.7 | 5.5 | 72.1 | 5.7 | 15.1 | 2.8 | 14.6 | 2.4 | – | – |
| Gu et al. (2015) | PET | 75 | 41 | 83.8 | 4.4 | 85.9 | 4.7 | 12.6 | 3.5 | 12.8 | 4.1 | 60 | 71 |
| Harrington et al. (2016) | PET | 278 | 81 | 68.7 | 6.1 | 73.5 | 7.3 | – | – | – | – | 53 | 53 |
| Hassenstab et al. (2016) | PET | 177 | 87 | 71.6 | 5 | 73.1 | 6.2 | 15.3 | 2.6 | 15.9 | 3 | 58.2 | 40.2 |
| Hatashita et al. (2010) | PET | 74 | 17 | 64.2 | 8.9 | 69.2 | 7.9 | – | – | – | – | 48 | 53 |
| Holland et al. (2012) | CSF | 58 | 39 | 75.5 | 5.3 | 77 | 5.3 | – | – | – | – | 52 | 46 |
| Hsu et al. (2014) | PET | 56 | 18 | 67.4 | 5.7 | 69.6 | 7.4 | 15.5 | 2.6 | 16.7 | 1.8 | 73 | 61 |
| Huijbers et al. (2014) | PET | 24 | 24 | 74.4 | 1.2 | 76.8 | 1.3 | 16.8 | 0.6 | 16.9 | 0.5 | 58 | 42 |
| Jack et al. (2012) | PET | 193 | 70 | 77 | 5 | 79 | 5 | 14 | 3 | 14 | 3 | 49 | 50 |
| Jack et al. (2013) | PET | 67 | 80 | 78 | 5 | 80 | 5 | 14 | 3 | 14 | 3 | 45 | 37 |
| Jack et al. (2014) | PET | 503 | 213 | 69 | 9 | 75 | 7 | 15 | 3 | 15 | 3 | 47 | 53 |
| Knopman et al. (2012) | PET | 127 | 44 | 77 | 4 | 79 | 5 | 14 | 3 | 14 | 2 | 49 | 45 |
| Lim et al. (2014) | PET | 29 | 27 | 75.3 | 6.4 | 76.3 | 5.8 | 14.8 | 2.4 | 14.3 | 2.4 | 69 | 63 |
| Lim et al. (2015) | PET | 48 | 15 | 63.9 | 6.3 | 62.8 | 5.4 | 17.5 | 3.5 | 17.2 | 2.8 | 58.3 | 73.3 |
| Lim et al. (2016) | PET | 326 | 33 | 68.3 | 6 | 73.1 | 7.1 | – | – | – | – | 54.9 | 66.7 |
| Llado-Saz et al. (2015) | CSF | 60 | 60 | 68.4 | 3.4 | 69.3 | 4 | 11 | 4.6 | 11.1 | 4.7 | 40 | 52 |
| Marchant et al. (2013) | PET | 32 | 29 | 76.6 | 7.5 | 79 | 6.3 | 13.8 | 2.9 | 14.1 | 2.5 | 41 | 17 |
| Mathis et al. (2013) | PET | 74 | 78 | 85.5 | 2.6 | 85.4 | 3.1 | 14.8 | 2.7 | 14.8 | 2.6 | 40.5 | 43.6 |
| Molinuevo et al. (2014) | CSF | 19 | 19 | 69.2 | 5.6 | 69.9 | 7.6 | 9.9 | 4 | 10.3 | 4.4 | 63.1 | 68.4 |
| Mormino et al. (2012) | PET | 49 | 11 | 75.1 | 6.6 | 79.2 | 8 | 17.2 | 2 | 16.5 | 2.1 | 59 | 73 |
| Oh et al. (2010) | PET | 33 | 19 | 73.9 | 5.7 | 74.4 | 6.6 | 17.5 | 1.8 | 16.8 | 2.1 | 61 | 74 |
| Oh et al. (2012) | PET | 34 | 18 | 73.8 | 5.8 | 74.8 | 6.6 | 17.5 | 1.9 | 16.7 | 2 | 59 | 78 |
| Oh et al. (2015) | PET | 41 | 12 | 64.7 | 2.9 | 64.2 | 3.4 | 16.7 | 2.5 | 16.8 | 2.2 | 54 | 57 |
| Oh et al. (2016) | PET | 50 | 12 | 64.7 | 2.9 | 64.2 | 3.5 | 16.9 | 2.4 | 16.8 | 2.3 | 54 | 50 |
| Ossenkoppele et al. (2014) | PET | 53 | 15 | 74.8 | 6.2 | 78.1 | 7 | 17.2 | 1.8 | 16.5 | 1.8 | 64 | 67 |
| Petersen et al. (2016) | PET | 385 | 179 | 78 | 5 | 80 | 5 | 14 | 3 | 14 | 3 | 45 | 42 |
| Pike et al. (2011) | PET | 119 | 58 | 69.8 | 7 | 75.2 | 7.1 | – | – | – | – | 50 | 50 |
| Rentz et al. (2010) | PET | 28 | 55 | 73.6 | 9.6 | 71.7 | 9.1 | 15.8 | 3.1 | 15.9 | 2.5 | 61 | 62 |
| Schott et al. (2010) | CSF | 40 | 65 | 76.3 | 5.1 | 74.9 | 5.1 | – | – | – | – | 45 | 49.2 |
| Snitz et al. (2013) | PET | 87 | 107 | 85.2 | 2.5 | 85.7 | 3 | 14.7 | 2.8 | 14.7 | 2.5 | 36.8 | 44.9 |
| Soldan et al. (2016) | CSF | 102 | 46 | 54.8 | 10.3 | 56.8 | 8.1 | 17.2 | 2.4 | 16.9 | 2.4 | 60.8 | 58.7 |
| Sperling et al. (2013) | PET | 67 | 11 | 68.4 | 11.1 | 75.6 | 9.4 | 15.2 | 2.4 | 15.5 | 1.4 | 58.2 | 45.5 |
| Stark et al. (2013) | PET | 101 | 18 | 74.4 | 5.9 | 74.4 | 4.5 | 15.5 | 2.7 | 15.3 | 2.7 | 64.4 | 66.7 |
| Susanto et al. (2014) – ADNI-1 cohort | CSF | 66 | 37 | 75.1 | 5.3 | 76.1 | 5 | 15.6 | 2.7 | 16 | 3.2 | 52 | 43 |
| Susanto et al. (2014) – ADNI-2 cohort | CSF | 37 | 41 | 75.8 | 5.1 | 77.1 | 6.2 | 16.6 | 2.8 | 16.4 | 2.6 | ||
| Thai et al. (2015) | PET | 182 | 31 | 68.8 | 6 | 76 | 7.2 | – | – | – | – | 51.1 | 54.8 |
| Vemuri et al. (2015) | PET | 178 | 81 | 77 | 5 | 78 | 4 | 14 | 3 | 15 | 3 | 48 | 41 |
| Villemagne et al. (2013) | PET | 33 | 112 | 72 | 6.7 | 71.2 | 7.2 | 14 | 3.5 | 13.6 | 3.8 | 52 | 48 |
| Villeneuve et al. (2014) | CSF | 45 | 22 | 77.5 | 6.9 | 80.1 | 5.9 | 14.8 | 3 | 15 | 2.8 | 36 | 14 |
| Vlassenko et al. (2016) | PET | 123 | 21 | 63.1 | 9.4 | 69.5 | 5.6 | 16 | 2.4 | 16.1 | 2.3 | 65 | 61.9 |
| Voevodskaya et al. (2016) | CSF | 156 | 59 | 72.6 | 4.7 | 72.7 | 4.7 | 12.1 | 3.7 | 11.7 | 3.8 | 61 | 61 |
| Vos et al. (2013) | CSF | 129 | 47 | 70.6 | 4.6 | 73.8 | 6.9 | 15.2 | 2.6 | 16.9 | 3.2 | 57 | 49 |
| Vos et al. (2016) | CSF | 127 | 26 | 63.4 | 9 | 68.1 | 9.6 | 15.9 | 2.5 | 14.8 | 3 | 63 | 58 |
| Vos et al. (2016) | PET | 114 | 42 | 64 | 9.4 | 70.6 | 5.9 | 16 | 2.4 | 16.4 | 2.6 | 68 | 45 |
| Wirth et al. (2013a) | PET | 25 | 13 | 74.2 | 7 | 71.5 | 6.9 | 17.6 | 2.1 | 16.3 | 2.1 | 56 | 77 |
| Wirth et al. (2013b) | PET | 47 | 25 | 74.9 | 5.5 | 75 | 6.1 | 17.3 | 1.7 | 16.4 | 2.1 | 66 | 68 |
Figure 2. Forrest plot for global cognitive function for amyloid positive and negative.

Difference in means reflects amyloid positive minus amyloid negative. Rhombus midpoint is the standard difference in means and the left and right points span the lower and upper limit.
Figure 3. Forrest plot for memory for amyloid positive and negative.

Difference in means reflects amyloid positive minus amyloid negative. Rhombus midpoint is the standard difference in means and the left and right points span the lower and upper limit.
Figure 4. Forrest plot for language for amyloid positive and negative.

Difference in means reflects amyloid positive minus amyloid negative. Rhombus midpoint is the standard difference in means and the left and right points span the lower and upper limit.
Figure 5. Forrest plot for visuospatial for amyloid positive and negative.

Difference in means reflects amyloid positive minus amyloid negative. Rhombus midpoint is the standard difference in means and the left and right points span the lower and upper limit.
Figure 6. Forrest plot for processing speed for amyloid positive and negative.

Difference in means reflects amyloid positive minus amyloid negative. Rhombus midpoint is the standard difference in means and the left and right points span the lower and upper limit.
Figure 7. Forrest plot for attention/working memory/executive functions for amyloid positive and negative.

Difference in means reflects amyloid positive minus amyloid negative. Rhombus midpoint is the standard difference in means and the left and right points span the lower and upper limit.
Figure 8. Forrest plot for premorbid functioning for amyloid positive and negative.

Difference in means reflects amyloid positive minus amyloid negative. Rhombus midpoint is the standard difference in means and the left and right points span the lower and upper limit.
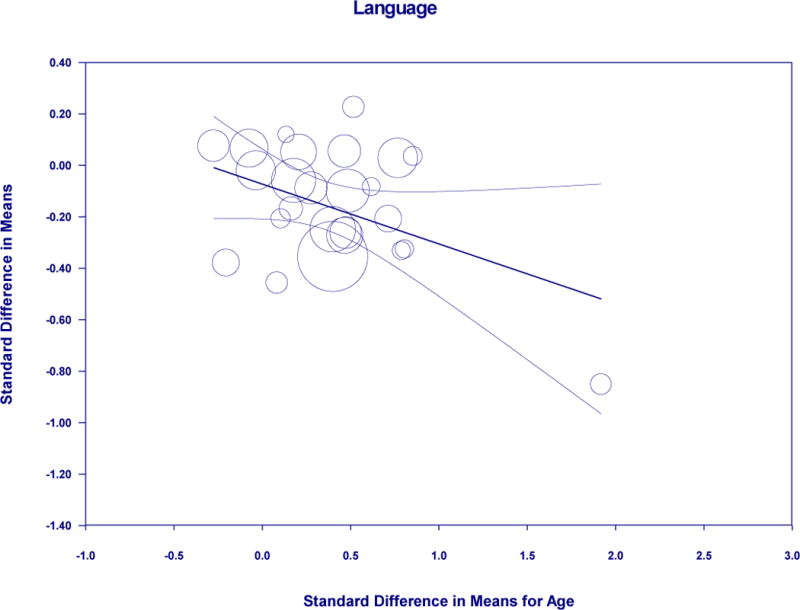
In a set of post-hoc analyses, we considered the method of amyloid grouping, specifically cerebrospinal fluid (CSF) and positron emission tomography (PET), as a potential moderator for results. For the language domain, there was a difference (Q=4.304, p=0.038) such that PET (20 studies: Hg=−0.188, SEg=0.043, 95% Cl=−0.272 to −0.103, p<0.001) was significant over CSF (5 studies: ns). For global cognitive functioning, memory, visuospatial ability, and processing speed, there was no significant difference between method of amyloid grouping. All studies included in the premorbid functioning analysis were conducted using PET, therefore this consideration was not pursued. In another set of post-hoc analyses, we used a meta-regression approach to consider whether standardized difference in means of age between biomarker groups might explain the perceived differences in cognitive performance. Using this approach, results were non-significant for global cognitive function, visuospatial ability, premorbid functioning, and attention/working memory/executive functions. Results were significant for memory (Coef=−0.2279, SE=0.1081, 95% Cl=−0.4397 to −0.0161, z=−2.11, p=0.0350), which accounted for 28% of the variance; language (Coef=−0.2327, SE=0.1139, 95% Cl=−0.4560 to −0.0093, z=−2.04, p=0.0412), which accounted for 100% of the variance; and processing speed (Coef=−0.7111, SE=0.2938, 95% Cl=−1.2869 to−0.1352, z=−2.42, p=0.0155), which accounted for 67% of the variance.
Amyloid Positive Versus Tau/Neurodegeneration Positive
Only 9 studies had sufficient data to investigate differences between amyloid positive (A+/N− or Stage 1) and tau/neurodegeneration positive (A+/N+ or Stage 2) groups. Because of the low number of studies, results from this analysis are presented with caution. One study (Vos et al., 2016), presented data separately for amyloid determined via CSF and PET, so this study was considered as two separate studies for this analysis, yielding a total of 10 studies. Demographic data per dataset is presented in Table 3. Only global cognitive function and memory were considered due to lack of sufficient datasets (less than 5) to pursue analyses in other cognitive domains. Considering global cognitive function, Stage 2 groups were lower than amyloid negative (A− or Stage 0) groups (Hg=−0.348, SEg=0.076, 95% Cl=−0.497 to −0.199, p<0.001; Figure 10), but not Stage 1 groups (ns). Heterogeneity was found to be within the very low range (Q=3.700, p=0.717, I2<0.001, Tau<0.001, Tau2<0.001) for the Stage 2 vs. Stage 0 meta-analysis. Using amyloid negative participants (A−) as a control group, the overall model was significant for global cognitive function and showed that amyloid positive (A+/N−) and tau/neurodegeneration positive (A+/N+) performed lower (Hg=−0.284, SEg=0.052, 95% Cl=−0.386 to −0.182, p<0.001) relative to amyloid negative; however, there was no significant difference between these biomarker positive groups. This is visualized in the forest plot in Figure 11. Considering memory, Stage 2 groups were lower than amyloid negative (A− or Stage 0) groups (Hg=−0.469, SEg=0.104, 95% Cl=−0.673 to −0.264, p<0.001; Figure 12), and also Stage 1 groups (Hg=−0.459, SEg=0.070, 95% Cl=−0.596 to −0.322, p<0.001; Figure 13). Heterogeneity was found to be within the moderate range (Q=19.084, p=0.004, I2=68.560, Tau=0.223, Tau2=0.050) for the Stage 2 vs. Stage 0 meta-analysis, and within the low range (Q= 6.343, p=0.386, I2=5.413, Tau=0.044, Tau2=0.002) for the Stage 2 vs. Stage 1 meta-analysis. Using amyloid negative (A−) participants as a control group, the overall model was significant for memory (Hg=−0.173, SEg=0.047, 95% Cl=−0.265 to −0.080, p<0.001), and there was a significant difference (Q=10.146, df=1, p=0.001) between biomarker positive groups such that the tau/neurodegeneration positive group (A+/N+) showed significantly lower performances (7 datasets: Hg=−0.469, SEg=0.104, 95% Cl=−0.673 to −0.264, p<0.001) than the amyloid positive group (A+/N−; ns) when compared to the amyloid negative group. This is visualized in the forest plot in Figure 14. Only 4 studies had sufficient data for consideration of Stage 3 participants. Because of this low number, Stage 3 meta-analyses were not conducted and these participants were not included in these analyses.
Table 3.
Demographic data for participants in three group amyloid positive (A− or Stage 0), amyloid positive (A+/N− or Stage 1), and tau/neurodegeneration positive (A+/N+ or Stage 2) analysis
| N | Age | Education | Sex | |||||||||||||||
|---|---|---|---|---|---|---|---|---|---|---|---|---|---|---|---|---|---|---|
|
|
||||||||||||||||||
| Study | A− | A+/N− | A+/N+ | A− | A+/N− | A+/N+ | A− | A+/N− | A+/N+ | A− | A+/N− | A+/N+ | ||||||
| M | SD | M | SD | M | SD | M | SD | M | SD | M | SD | %F | %F | %F | ||||
| Alcolea et al. (2015) | 203 | 26 | 10 | 57.3 | 6.5 | 60.6 | 7.9 | 66.3 | 6.7 | – | – | – | – | – | – | 59.1 | 69.2 | 40 |
| Amariglio et al. (2015) | 122 | 32 | 36 | 71.6 | 5.7 | 73.1 | 5 | 77.1 | 6.4 | 15.9 | 3 | 16.4 | 2.7 | 16.2 | 2.8 | 63.1 | 59.4 | 61.1 |
| Edmonds et al. (2015) | 142 | 48 | 173 | 72.3 | 6.8 | 71.8 | 6.7 | 74.6 | 6.9 | 16.2 | 2.6 | 16.1 | 3 | 16.2 | 2.5 | 48.6 | 54.2 | 46.8 |
| Jack et al. (2012) | 193 | 70 | 56 | 77 | 5 | 79 | 5 | 80 | 4 | 14 | 3 | 14 | 3 | 15 | 3 | 49 | 50 | 34 |
| Jack et al. (2014) | 503 | 213 | 139 | 69 | 9 | 75 | 7 | 80 | 5 | 15 | 3 | 15 | 3 | 15 | 3 | 47 | 53 | 35 |
| Knopman et al. (2012) | 127 | 44 | 39 | 77 | 4 | 79 | 5 | 80 | 4 | 14 | 3 | 14 | 2 | 15 | 3 | 49 | 45 | 8 |
| Soldan et al. (2016) | 102 | 46 | 28 | 54.8 | 10.3 | 56.8 | 8.1 | 63.6 | 9.9 | 17.2 | 2.4 | 16.9 | 2.4 | 17.1 | 2.1 | 60.8 | 58.7 | 57.1 |
| Vos et al. (2013) | 129 | 47 | 36 | 70.6 | 4.6 | 73.8 | 6.9 | 74.4 | 5.8 | 15.2 | 2.6 | 16.9 | 3.2 | 15.3 | 2.7 | 57 | 49 | 64 |
| Vos et al. (2016) | 127 | 26 | 19 | 63.4 | 9 | 68.1 | 9.6 | 73.5 | 5.6 | 15.9 | 2.5 | 14.8 | 3 | 16.5 | 2.5 | 63 | 58 | 47 |
| Vos et al. (2016) | 114 | 42 | 16 | 64 | 9.4 | 70.6 | 5.9 | 74 | 6.9 | 16 | 2.4 | 16.4 | 2.6 | 14.1 | 3.4 | 68 | 45 | 69 |
Figure 10.

Meta-regression of standardized mean difference in age and memory in amyloid positive and negative
Figure 11.
Meta-regression of standardized mean difference in age and language in amyloid positive and negative
Figure 12.

Meta-regression of standardized mean difference in age and processing speed in amyloid positive and negative
Figure 13. Forrest plot for global cognitive function amyloid negative (A− or Stage 0) versus tau/neurodegeneration positive (A+/N+ or Stage 2).
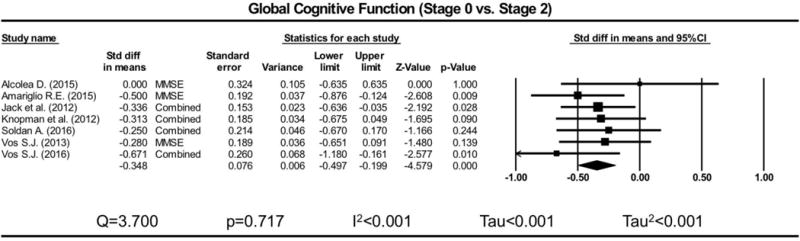
Difference in means reflects tau/neurodegeneration minus amyloid negative. Rhombus midpoint is the standard difference in means and the left and right points span the lower and upper limit.
Figure 14. Forrest plot for global cognitive function amyloid positive (A+/N− or Stage 1) versus tau/neurodegeneration positive (A+/N+ or Stage 2) using amyloid negative (A− or Stage 0) as a control group.

Difference in means reflects tau/neurodegeneration minus amyloid positive using amyloid negative as a control group. Rhombus midpoint is the standard difference in means and the left and right points span the lower and upper limit.
DISCUSSION
Using a standardized meta-analytic approach, we examined whether differences in neuropsychological performance could be detected according to specific cognitive domains among cognitively intact older adults who are considered positive for amyloidosis and those considered negative. Our findings suggest that small but significant differences are observable in neuropsychological measures of global cognitive function, memory, language, visuospatial ability, processing speed, and attention/working memory/executive functions. Furthermore, in a second set of meta-analyses where amyloid negative persons served as a reference group, cognitively normal older adults who are positive for tau pathology or neurodegeneration (A+/N+) showed lower performances on memory measures versus those who are only amyloid positive (A+/N−). Altogether these results suggest that neuropsychological measures are sensitive to different stages in preclinical AD among older adults considered to be in the normal cognitive range.
Previous models of biomarker sequencing suggest accumulation of AD pathology and neuroimaging structural and functional changes occur prior to cognitive impairment or significant cognitive decline (e.g., Jack et al., 2010). This understanding suggests that cognitively normal persons who differ with respect to preclinical AD biomarker status would not differ with respect to performances on neuropsychological measures, and some have supported this notion in previous empirical work (Goldman et al., 2001). This was the null hypothesis against which we tested our hypotheses, and the results of our meta-analysis study rejected this null. Our study thus adds to the growing cannon of literature (e.g., Hedden et al., 2012) that suggests detectable cognitive differences may occur earlier in the course of AD than previously considered, and these may be associated with increasing cerebral amyloid retention and tau accumulation. Widely used criteria for staging preclinical AD were used as the basis of the current study (Sperling et al., 2011), and these criteria are predicated on the amyloid cascade hypothesis (Hardy and Higgins, 1992; Hardy and Selkoe, 2002) that require the presence of amyloidosis to define the preclinical AD state. The results of our primary analyses may therefore be viewed as consistent with the amyloid hypothesis. More recently, an “A/T/N” (amyloid/tau/neurodegeneration) system was proposed to serve as an unbiased descriptive classification scheme that may better serve population-based studies of cognitive aging (Jack et al., 2013b). This was not proposed to be used to define any specific diagnostic system (e.g., Alzheimer’s disease), although this may better capture neuropathological models of AD that are not centered around amyloid as the fundamentally initiating pathological event. The A/T/N system also provides a mechanism for characterizing individuals who may show a neurodegeneration-first pathway to AD, such as individuals with suspected non-Alzheimer’s pathology (SNAP, or A−N+) who were not included in the current meta-analysis. Studies using CSF biomarkers included in our secondary analyses looking at preclinical AD subgroups considered measures of CSF total tau (t-tau) and/or CSF phosphorylated tau (p-tau) as indicative of neuronal dysfunction or neurodegeneration (e.g., N+), but these were not considered separately in a way that would allow further examination of those meeting criteria for tau pathology (T+) as defined in the recent A/T/N system (p-tau or tau PET).
The results of our analyses that show that cognitive differences are detectable in biomarker positive cognitively normal individuals even when specifically excluding evidence of MCI. Given these results, we propose consideration of “cognition positive” (C+) as an additional important biomarker (in this case, a cognitive marker) that may capture important functional brain changes that may predate biomarker changes or occur outside of the sequence laid forth by the amyloid cascade hypothesis. Recent evidence indicates that AD-related neuropathological changes may occur well in advance of changes in CSF and PET markers, particularly for pre-tangle (Braak & Del Tradici, 2015) and beta amyloid oligomer (Viola & Klein, 2015) pathologies. Thus, cognitive markers may be of value in identifying the earliest changes in brain function related to pathophysiological events predating a change in amyloid or tau in vivo biomarker signal. The potential importance of defining individuals as cognition positive (C+) is further supported by studies showing memory decline may predate the emergence of in vivo markers of either tau or amyloid biomarkers (Jedynak et al., 2012; Iturria-Medina et al., 2016). The implications of our results are significant in that neuropsychological measures, which are of lower cost and are less invasive than CSF acquisition or PET scanning procedures, may be utilized to reliably detect AD pathological changes in the preclinical phase. Since all of the participants in our study were deemed to be within normal cognitive limits per standardized norms or other norming procedures, further research is needed to determine what may be considered a clinically significant difference in neuropsychological performance within what is commonly considered the normal range. To this end, longitudinal considerations may be particularly sensitive to changes in the preclinical AD phase, as changes over time may reflect growing neuropathology. The absence of practice effects may also serve as a potential preclinical marker of subtle cognitive impairment (Hassenstab et al., 2015; Machulda et al., in press; Duff et al., 2014), although baseline age of participants may be an important factor to consider (Lamar et al., 2003). Composite cognitive measure approaches may additionally yield promising psychometric properties for this purpose as these have been found to minimize potential Type I error (Langbaum et al., 2015) and have improved power to detect decline (Langbaum et al., 2014). Cognitive composites have been shown to be sensitive to cognitive decline in preclinical AD and will be used as primary outcome measures in secondary prevention trials (Ayutayonant et al., 2014; Donahue et al., 2014). It should be noted that the C+ conceptualization also presents challenges which are not readily addressable, and thus this remains more aspirational rather than practical. It would be most advantageous to have a clinical cut-off score for cognitive measures with established sensitivity and specificity established for AD biomarkers. However, the values for these are likely to be low and there are a number of reasons other than AD that may result in low scores. More research is needed to determine if specific patterns of performances might be sensitive to biomarker status.
The subtle cognitive decline characterizing preclinical AD Stage 3 was not initially operationalized by the work group that defined preclinical AD stages by biomarker status, but was described as approaching the border zone of MCI (Sperling et al., 2011). Several groups have attempted to characterize this subtle cognitive impairment using various approaches, including use of a global cognitive domain score cut-off at the 10th percentile (Jack et al., 2012), a memory composite score cut-off at the 10th percentile (Vos et al., 2013), and having two out of six scores greater than one standard deviation below published normative data in two separate cognitive domains or a subtle decline in functional abilities defined as a Functional Assessment Questionnaire score of 6-8 (Edmonds et al., 2016). Only four of the ten studies divided A+N+ individuals into Stages 2 and 3 based upon the presence or absence of subtle cognitive impairment (Edmonds et al., 2016; Jack et al., 2012; Knopman et al., 2012; Vos et al., 2013). Thus, we believed we had an insufficient number of studies to adequately compare Stage 3 preclinical AD to earlier stages using meta-analytic approaches. Because of our goal to exclude all subjects with identified cognitive impairment (even subtle), we did not include participants identified as Stage 3 in the current study. This approach was selected to more robustly test our hypotheses, as it could be argued that any perceived differences may be driven by those who are found to have MCI, which would have been more represented in the biomarker positive groups. However, it should be acknowledged this approach may have attenuated the effect sizes observed. The remaining studies in these analyses did not operationally define subtle cognitive impairment and thus theoretically can be considered to include potentially both Stage 2 and Stage 3 individuals. Future work will need to link the subtle cognitive changes observed in Stage 3 with the cognitive differences observed in Stage 2 and Stage 1 in the present study.
Of the different cognitive domains considered, memory measures were most sensitive to preclinical AD biomarker stages. These showed differences not only between amyloid positive and negative groups, but also between amyloid positive and tau/neurodegeneration positive groups. Tau neuropathology has consistently shown associations with memory measures (Nelson et al., 2012), and memory measures have long been associated with clinically-relevant progression of AD. For these reasons, it is not surprising these measures may be most sensitive to preclinical AD stages. Future research is also needed to determine what specific components of memory might be most sensitive to accumulating neuropathology in preclinical AD, as these may be different than in clinically early AD. One potentially important consideration is subjective memory decline, as there seems to be some suggestion that subjective complaints may occur prior to objective memory impairment in the course of AD (Jessen et al., 2014). Efforts are currently underway to operationalize and quantify subjective memory decline for the goal of assessing its utility in preclinical AD. Despite the importance of our findings regarding memory as a key early domain of decline, the fact that all cognitive domains showed significant differences is also important. Memory is a particularly vulnerable domain in early AD, but it is increasingly recognized that many cases of AD may initially present with other nonamnestic forms of cognitive impairment (Knopman et al., 2015). Thus, future studies should aim for comprehensive characterization of cognitive decline while still emphasizing the importance of memory.
We also made other observations that merit some further discussion. Our investigation of premorbid intellectual ability revealed that amyloid positive persons may have higher scores than amyloid negative persons. Although the significance of this perceived difference is unclear, a recent large meta-analytic study of cerebral amyloidosis has shown an association between higher educational attainment and cerebral amyloid levels (Jansen et al., 2015). This may be viewed as consistent with the cognitive reserve hypothesis since more highly educated individuals (who arguably have higher cognitive reserve, and by extension, higher premorbid intellectual functioning) can sustain greater amyloid pathology before developing signs of dementia. Thus, the higher premorbid intellectual functioning observed in biomarker positive non-cognitively impaired older adults may reflect greater cognitive reserve. We also observed in post-hoc analyses that PET was differentially and more strongly associated with language performance differences between amyloid positive and amyloid negative groups than CSF markers. While this finding might be driven in part by the low numbers of CSF studies relative to PET studies, the possibility that amyloid positivity as measured by PET may be more sensitive to language differences by biomarker status needs further exploration. Finally, we observed that the standard difference in means for age explained a portion of the variance for memory (28%), processing speed (67%), and language (100%) among amyloid positive and negative groups. Given that amyloid accumulation is strongly associated with age, it is difficult to determine the significance of these results. However, it is notable that with the exception of language abilities, age only explained a portion of the difference if at all among multiple cognitive domains considered.
The present study has a number of limitations which need to be acknowledged. First, the approach of grouping neuropsychological measures by broad cognitive domains may reduce sensitivity of specific measures over those that are not as sensitive. The approach we employed was chosen because it maximized incorporation of all neuropsychological data available; however, if sufficient data were provided to focus on episodic memory specifically, for example, this might have yielded more significant findings. Second, our strict exclusion criteria may have prevented the inclusion of some studies that may have been relevant to the hypotheses addressed. We attempted to obtain data in the form needed for meta-analysis by directly contacting authors, but attempts to obtain these data for some studies were unsuccessful. Third, our analyses could not fully account for factors that might explain neuropsychological performance differences between groups. Although we considered certain factors in our approach, we cannot account for other factors that might explain differences in cognition, such as cardiovascular risk and socioeconomic status. Fourth, some cognitive domain analyses (language, visuospatial, processing speed, premorbid functioning) had fewer studies included in analyses than others (global cognitive functioning, memory, attention/working memory/executive functions), and the analyses considering amyloid positive and tau/neurodegeneration positive groups had only very few studies. For these reasons, results for these specific analyses should be interpreted with caution. Fifth, it should be noted that our goal of including participants without cognitive impairment was dependent on appropriate characterization of cognitive abilities by investigators. There is variability in how cognitive abilities are measured and what is deemed cognitive impairment among research groups, therefore this variability may impact the generalizability of our results. Sixth, we acknowledge that studies that were not published but may have had an impact upon our results were not included in the present study. Seventh, we note that the reviewers were not blinded to the institution or authors of studies. We do not believe this impacted study selection; however, we acknowledge this as a possible limitation. Eighth, while we attempted to contact some study authors to obtain reported cognitive data in the form necessarily for our analyses, we did not contact all study authors of rejected studies to determine if cognitive data were available in studies that did not originally include cognition as an outcome. This might have significantly increased our numbers for analysis. Finally, relatively few AD research laboratories and centers have the means to characterize preclinical AD biomarkers. For this reason, multiple studies may use data from the same research cohorts. The degree to which individual studies used the same participants could not be determined, and this may have had an impact on the effects observed in these studies. More specifically, if multiple studies were drawn from the same participant pool, then this would have the effect of overgeneralizing our findings.
Despite these limitations, the implications of the present study are consequential. Our meta-analytic review of the literature supports the notion that neuropsychological measures are sensitive to different stages of preclinical AD among older adults considered cognitively intact. It is striking that these differences are perceived across multiple different research sites, groups, and cohorts. It is also striking that these differences occurred despite the exclusion of participants identified as having subtle cognitive declines (Stage 3). Further research is needed to determine what constitutes meaningful differences in neuropsychological performance among cognitively intact older adults and how these may correlate with preclinical AD biomarkers.
Figure 9. Forest plot for language with CSF/PET as moderator for amyloid positive and negative.

Difference in means reflects amyloid positive minus amyloid negative. Rhombus midpoint is the standard difference in means and the left and right points span the lower and upper limit.
Figure 15. Forrest plot for memory amyloid negative (A− or Stage 0) versus tau/neurodegeneration positive (A+/N+ or Stage 2).

Difference in means reflects tau/neurodegeneration minus amyloid negative. Rhombus midpoint is the standard difference in means and the left and right points span the lower and upper limit.
Figure 16. Forrest plot for memory amyloid positive (A+/N− or Stage 1) versus tau/neurodegeneration positive (A+/N+ or Stage 2).

Difference in means reflects tau/neurodegeneration minus amyloid positive. Rhombus midpoint is the standard difference in means and the left and right points span the lower and upper limit.
Figure 17. Forest plot for memory amyloid positive (A+/N− or Stage 1) versus tau/neurodegeneration positive (A+/N+ or Stage 2) using amyloid negative (A− or Stage 0) as a control group.

Difference in means reflects tau/neurodegeneration minus amyloid positive using amyloid negative as a control group. Rhombus midpoint is the standard difference in means and the left and right points span the lower and upper limit.
Acknowledgments
SDH is supported by National Institute on Aging grant K23AG040625, and the American Federation for Aging Research (AFAR). NHS serves as a consultant to Biogen. The funding agencies had no role in this study.
References
- Aizenstein HJ, Nebes RD, Saxton JA, et al. Frequent amyloid deposition without significant cognitive impairment among the elderly. Archives of Neurology. 2008;65(11):1509–1517. doi: 10.1001/archneur.65.11.1509. [DOI] [PMC free article] [PubMed] [Google Scholar]
- Alcolea D, Martínez-Lage P, Sánchez-Juan P, et al. Amyloid precursor protein metabolism and inflammation markers in preclinical Alzheimer disease. Neurology. 2015;85(7):626–33. doi: 10.1212/WNL.0000000000001859. [DOI] [PubMed] [Google Scholar]
- Amariglio RE, Becker JA, Carmasin J, et al. Subjective cognitive complaints and amyloid burden in cognitively normal older individuals. Neuropsychologia. 2012;50:2880–2886. doi: 10.1016/j.neuropsychologia.2012.08.011. [DOI] [PMC free article] [PubMed] [Google Scholar]
- Amariglio RE, Mormino EC, Pietras AC, et al. Subjective cognitive concerns, amyloid-β, and neurodegeneration in clinically normal elderly. Neurology. 2015;85(1):56–62. doi: 10.1212/WNL.0000000000001712. [DOI] [PMC free article] [PubMed] [Google Scholar]
- Andreasen N, Minthon L, Davidsson P, et al. Evaluation of CSF-tau and CSF-Aβ42 as Diagnostic Markers for Alzheimer Disease in Clinical Practice. Archives of Neurology. 2001;58:373–379. doi: 10.1001/archneur.58.3.373. [DOI] [PubMed] [Google Scholar]
- Ayutyanont N, Langbaum JB, Hendrix SB, et al. The Alzheimer’s Precention Initiative composite cognitive test score: Sample size estimates for the evaluation of preclinical Alzheimer’s disease treatments in presenilin 1 E280A mutation carriers. J Clin Psychiatry. 2014;75:652–660. doi: 10.4088/JCP.13m08927. [DOI] [PMC free article] [PubMed] [Google Scholar]
- Besson FL, La Joie R, Doeuvre L, et al. Cognitive and Brain Profiles Associated with Current Neuroimaging Biomarkers of Preclinical Alzheimer’s Disease. The Journal of Neuroscience. 2015;35(29):10402–11. doi: 10.1523/JNEUROSCI.0150-15.2015. [DOI] [PMC free article] [PubMed] [Google Scholar]
- Borenstein M, Hedges LV, Higgins JPT, Rothstein HR. Introduction to Meta-Analysis. John Wiley & Sons, Ltd; West Sussex: UK: 2009. [Google Scholar]
- Braak H, Del Tredici K. The preclinical phase of the pathological process underlying sporadic Alzheimer’s disease. Brain. 2015;138:2814–2833. doi: 10.1093/brain/awv236. [DOI] [PubMed] [Google Scholar]
- Buckley RF, Maruff P, Ames D, et al. Subjective memory decline predicts greater rates of clinical progression in preclinical Alzheimer’s disease. Alzheimer’s & Dementia. 2016;12(7):796–804. doi: 10.1016/j.jalz.2015.12.013. [DOI] [PubMed] [Google Scholar]
- Chen K, Roontiva A, Thiyyagura P, et al. Improved power for characterizing longitudinal amyloid-β PET changes and evaluating amyloid-modifying treatments with a cerebral white matter reference region. The Journal of Nuclear Medicine. 2015;56(4):560–566. doi: 10.2967/jnumed.114.149732. [DOI] [PubMed] [Google Scholar]
- Chételat G, Villemagne VL, Pike KE, et al. Larger temporal volume in elderly with high versus low beta-amyloid deposition. Brain. 2010;133(11):3349–3358. doi: 10.1093/brain/awq187. [DOI] [PubMed] [Google Scholar]
- Chételat G, Villemagne VL, Villain N, et al. Accelerated cortical atrophy in cognitively normal elderly with high β-amyloid deposition. Neurology. 2012;78(7):477–484. doi: 10.1212/WNL.0b013e318246d67a. [DOI] [PubMed] [Google Scholar]
- Cochran WG. The combination of estimates from different experiments. Biometrics. 1954;1:101–129. [Google Scholar]
- Donohue MC, Sperling RA, Salmon DP, et al. The preclinical Alzheimer cognitive composite: measuring amyloid-related decline. JAMA Neurology. 2014;71(8):961–970. doi: 10.1001/jamaneurol.2014.803. [DOI] [PMC free article] [PubMed] [Google Scholar]
- Doraiswamy PM, Sperling RA, Coleman RE, et al. Amyloid-β assessed by florbetapir F 18 PET and 18-month cognitive decline: a multicenter study. Neurology. 2012;79(16):1636–1644. doi: 10.1212/WNL.0b013e3182661f74. [DOI] [PMC free article] [PubMed] [Google Scholar]
- Doraiswamy PM, Sperling RA, Johnson K, et al. Florbetapir F 18 amyloid PET and 36-month cognitive decline: a prospective multicenter study. Molecular Psychiatry. 2014;19(9):1044–1051. doi: 10.1038/mp.2014.9. [DOI] [PMC free article] [PubMed] [Google Scholar]
- Duff K, Norman NL, Hoffman JM. Practice effects and amyloid deposition: preliminary data on a method for enriching samples in clinical trials. Alzheimer’s Dis Assoc Disord. 2014;28:247–252. doi: 10.1097/WAD.0000000000000021. [DOI] [PMC free article] [PubMed] [Google Scholar]
- Edmonds EC, Delano-Wood L, Galasko DR, et al. Subtle Cognitive Decline and Biomarker Staging in Preclinical Alzheimer’s Disease. Journal of Alzheimer’s Disease. 2015;47:231–242. doi: 10.3233/JAD-150128. [DOI] [PMC free article] [PubMed] [Google Scholar]
- Elman JA, Oh H, Madison CM, et al. Neural compensation in older people with brain amyloid-β deposition. Nature Neuroscience. 2014;17(10):1316–1318. doi: 10.1038/nn.3806. [DOI] [PMC free article] [PubMed] [Google Scholar]
- Fortea J, Sala-Llonch R, Bartrés-Faz D, et al. Cognitively preserved subjects with transitional cerebrospinal fluid ß-amyloid 1-42 values have thicker cortex in Alzheimer’s disease vulnerable areas. Biological Psychiatry. 2011;70(2):183–190. doi: 10.1016/j.biopsych.2011.02.017. [DOI] [PubMed] [Google Scholar]
- Fripp J, Bourgeat P, Acosta O, et al. Appearance modeling of 11C PiB PET images: characterizing amyloid deposition in Alzheimer’s disease, mild cognitive impairment and healthy aging. NeuroImage. 2008;43(3):430–439. doi: 10.1016/j.neuroimage.2008.07.053. [DOI] [PubMed] [Google Scholar]
- Gidicsin CM, Maye JE, Locascio JJ, et al. Cognitive activity relates to cognitive performance but not to Alzheimer disease biomarkers. Neurology. 2015;85(1):48–55. doi: 10.1212/WNL.0000000000001704. [DOI] [PMC free article] [PubMed] [Google Scholar]
- Gietl AF, Warnock G, Riese F, et al. Regional cerebral blood flow estimated by early PiB uptake is reduced in mild cognitive impairment and associated with age in an amyloid-dependent manner. Neurobiology of Aging. 2015;36(4):1619–1628. doi: 10.1016/j.neurobiolaging.2014.12.036. [DOI] [PubMed] [Google Scholar]
- Goldman WP, Price JL, Storandt M, et al. Absence of cognitive impairment or decline in preclinical Alzheimer’s disease. Neurology. 2001;56:361–367. doi: 10.1212/wnl.56.3.361. [DOI] [PubMed] [Google Scholar]
- Gu Y, Razlighi QR, Zahodne LB, et al. Brain Amyloid Deposition and Longitudinal Cognitive Decline in Nondemented Older Subjects: Results from a Multi-Ethnic Population. PLoS One. 2015;10(7) doi: 10.1371/journal.pone.0123743. [DOI] [PMC free article] [PubMed] [Google Scholar]
- Hardy JA, Higgins GA. Alzheimer’s disease: The amyloid cascade hypothesis. Science. 1992;256:184–185. doi: 10.1126/science.1566067. [DOI] [PubMed] [Google Scholar]
- Hardy J, Selkoe DJ. The amyloid hypothesis of Alzheimer’s disease: Progress and problems on the road to therapeutics. Science. 2002;297:353–356. doi: 10.1126/science.1072994. [DOI] [PubMed] [Google Scholar]
- Harrington KD, Gould E, Lim YY, et al. Amyloid burden and incident depressive symptoms in cognitively normal older adults. International Journal of Geriatric Psychiatry. 2016 doi: 10.1002/gps.4489. Advance online publication. [DOI] [PubMed] [Google Scholar]
- Hassenstab J, Chasse R, Grabow P, et al. Certified normal: Alzheimer’s disease biomarkers and normative estimates of cognitive functioning. Neurobiology of Aging. 2016;43:23–33. doi: 10.1016/j.neurobiolaging.2016.03.014. [DOI] [PMC free article] [PubMed] [Google Scholar]
- Hassenstab J, Monsell SE, Mock C, et al. Neuropsychological markers of cognitive decline in persons with Alzheimer Disease neuropathology. J Neuropath Exp Neurol. 2015;74:1086–1092. doi: 10.1097/NEN.0000000000000254. [DOI] [PMC free article] [PubMed] [Google Scholar]
- Hatashita S, Yamasaki H. Clinically different stages of Alzheimer’s disease associated by amyloid deposition with [11C]-PIB PET imaging. Journal of Alzheimer’s Disease. 2010;21(3):995–1003. doi: 10.3233/JAD-2010-100222. [DOI] [PubMed] [Google Scholar]
- Hedden T, Oh H, Younger AP, Patel TA. Meta-analysis of amyloid-cognition relations in cognitively normal older adults. Neurology. 2013;80(14):1341–8. doi: 10.1212/WNL.0b013e31828ab35d. [DOI] [PMC free article] [PubMed] [Google Scholar]
- Hedges LV. Distribution theory for Glass’s estimator of effect size and related estimators. Journal of Educational Statistics. 1981;6(2):107–128. [Google Scholar]
- Hedges LV, Vevea JL. Fixed- and random-effects models in meta-analysis. Psychological Methods. 1998;4:486–504. [Google Scholar]
- Higgins JPT, Thompson SG, Deeks JJ, Altman DG. Measuring inconsistency in meta-analysis. BMJ. 2003;327:557–560. doi: 10.1136/bmj.327.7414.557. [DOI] [PMC free article] [PubMed] [Google Scholar]
- Holland D, McEvoy LK, Desikan RS, et al. Enrichment and Stratification for Predementia Alzheimer Disease Clinical Trials. PLoS One. 2012;7(10) doi: 10.1371/journal.pone.0047739. [DOI] [PMC free article] [PubMed] [Google Scholar]
- Hsu PJ, Shou H, Benzinger T, et al. Amyloid Burden in Cognitively Normal Elderly is Associated with Preferential Hippocampal Subfield Volume Loss. Journal of Alzheimer’s Disease. 2014;45(1):27–33. doi: 10.3233/JAD-141743. [DOI] [PMC free article] [PubMed] [Google Scholar]
- Huijbers W, Mormino EC, Wigman SE, et al. Amyloid deposition is linked to aberrant entorhinal activity among cognitively normal older adults. The Journal of Neuroscience. 2014;34(15):5200–5210. doi: 10.1523/JNEUROSCI.3579-13.2014. [DOI] [PMC free article] [PubMed] [Google Scholar]
- Iturria-Medina Y, Sotero RC, Toussaint PJ. Early role of vascular dysregulation on late-onset Alzheimer’s disease based on multifactorial data-driven analysis. Nature Communications. 2016;7 doi: 10.1038/ncomms11934. Article number: 11934. [DOI] [PMC free article] [PubMed] [Google Scholar]
- Jack CR, Jr, Knopman DS, Jagust WJ, et al. Hypothetical model of dynamic biomarkers of the Alzheimer’s pathological cascade. Lancet Neurology. 2010;9(1):119–28. doi: 10.1016/S1474-4422(09)70299-6. [DOI] [PMC free article] [PubMed] [Google Scholar]
- Jack CR, Jr, Knopman DS, Weigand SD, et al. An operational approach to National Institute on Aging-Alzheimer’s Association criteria for preclinical Alzheimer disease. Annals of Neurology. 2012;71:765–775. doi: 10.1002/ana.22628. [DOI] [PMC free article] [PubMed] [Google Scholar]
- Jack CR, Jr, Knopman DS, Jagust WJ, et al. Update on hypothetical model of Alzheimer’s disease biomarkers. Lancet Neurology. 2013a;12(2):207–216. doi: 10.1016/S1474-4422(12)70291-0. [DOI] [PMC free article] [PubMed] [Google Scholar]
- Jack CR, Jr, Wiste HJ, Weigand SD, et al. Amyloid-first and neurodegeneration-first profiles characterize incident amyloid PET positivity. Neurology. 2013b;81(20):1732–1740. doi: 10.1212/01.wnl.0000435556.21319.e4. [DOI] [PMC free article] [PubMed] [Google Scholar]
- Jack CR, Jr, Wiste HJ, Weigand SD, et al. Age-specific population frequencies of cerebral β-amyloidosis and neurodegeneration among people with normal cognitive function aged 50–89 years: a cross-sectional study. Lancet Neurology. 2014;13(10):997–1005. doi: 10.1016/S1474-4422(14)70194-2. [DOI] [PMC free article] [PubMed] [Google Scholar]
- Jansen WJ, Ossenkoppele R, Knol DL, Tijms BM, Scheltens P, Verhey FRJ, Visser PJ, Amyloid Biomarker Study Group Prevalence of Cerebral Amyloid Pathology in Persons Without Dementia: A Meta-analysis. JAMA. 2015;313(19):1924–1938. doi: 10.1001/jama.2015.4668. [DOI] [PMC free article] [PubMed] [Google Scholar]
- Jedynak BM, Lang A, Liu B, et al. A computational neurodegenerative diease progression score: Method and results with the Alzheimer’s Disease Neuroimaging Initiative cohort. NeuroImage. 2012;63:1478–1486. doi: 10.1016/j.neuroimage.2012.07.059. [DOI] [PMC free article] [PubMed] [Google Scholar]
- Jessen F, Amariglio RE, van Boxtel M, et al. A conceptual framework for research on subjective cognitive decline in preclinical Alzheimer’s disease. Alzheimer’s & Dementia. 2014;10:844–852. doi: 10.1016/j.jalz.2014.01.001. [DOI] [PMC free article] [PubMed] [Google Scholar]
- Knopman DS, Beiser A, Machulda MM, et al. Spectrum of cognition short of dementia: Framingham Heart Study and Mayo Clinic Study of Aging. Neurology. 2015;85:1712–1721. doi: 10.1212/WNL.0000000000002100. [DOI] [PMC free article] [PubMed] [Google Scholar]
- Knopman DS, Jack CR, Jr, Wiste HJ, et al. Short-term clinical outcomes for stages of NIA-AA preclinical Alzheimer disease. Neurology. 2012;78(20):1576–1582. doi: 10.1212/WNL.0b013e3182563bbe. [DOI] [PMC free article] [PubMed] [Google Scholar]
- Lamar M, Resnick SM, Zonderman AB. Longitudinal changes in verbal memory in older adults. Neurology. 2003;60:82–86. doi: 10.1212/wnl.60.1.82. [DOI] [PubMed] [Google Scholar]
- Langbaum JB, Hendrix SB, Ayutyanont N, et al. An empirically derived composite cognitive test score with improved power to track and evaluate treatments for preclinical Alzheimer’s disease. Alzheimer’s & Dementia. 2014;10:666–674. doi: 10.1016/j.jalz.2014.02.002. [DOI] [PMC free article] [PubMed] [Google Scholar]
- Langbaum JB, Hendrix SB, Ayutyanont N, et al. Establishing composite cognitive endpoints for use in preclinical Alzheimer’s disease trials. The Journal of Prevention of Alzheimer’s Disease. 2015;2(1):2–3. doi: 10.14283/jpad.2015.46. [DOI] [PMC free article] [PubMed] [Google Scholar]
- Lim HK, Nebes R, Snitz B, et al. Regional amyloid burden and intrinsic connectivity networks in cognitively normal elderly subjects. Brain. 2014;137:3327–38. doi: 10.1093/brain/awu271. [DOI] [PMC free article] [PubMed] [Google Scholar]
- Lim YY, Maruff P, Schindler R, et al. Disruption of cholinergic neurotransmission exacerbates Aβ-related cognitive impairment in preclinical Alzheimer’s disease. Neurobiology of Aging. 2015;36:2709–2715. doi: 10.1016/j.neurobiolaging.2015.07.009. [DOI] [PubMed] [Google Scholar]
- Lim YY, Snyder PJ, Pietrzak RH, et al. Sensitivity of composite scores to amyloid burden in preclinical Alzheimer’s disease: Introducing the Z-scores of Attention, Verbal fluency, and Episodic memory for Nondemented older adults composite score. Alzheimer’s & Dementia. 2016;2:19–26. doi: 10.1016/j.dadm.2015.11.003. [DOI] [PMC free article] [PubMed] [Google Scholar]
- Llado-Saz S, Atienzam M, Cantero JL. Increased levels of plasma amyloid-beta are related to cortical thinning and cognitive decline in cognitively normal elderly subjects. Neurobiology of Aging. 2015;36(10):2791–2797. doi: 10.1016/j.neurobiolaging.2015.06.023. [DOI] [PubMed] [Google Scholar]
- Marchant NL, Reed BR, Sanossian N, et al. The aging brain and cognition: contribution of vascular injury and aβ to mild cognitive dysfunction. JAMA Neurology. 2013;70(4):488–495. doi: 10.1001/2013.jamaneurol.405. [DOI] [PMC free article] [PubMed] [Google Scholar]
- Machulda MM, Hagen CE, Wiste HJ, et al. Practice effects and longitudinal cognitive change in clinically normal older adutls differ by Alzheimer imaging biomarker status. The Clinical Neuropsychologist. doi: 10.1080/13854046.2016.1241303. (in press) http://dx.doi.org/10.1080/13854046.2016.1241303. [DOI] [PMC free article] [PubMed]
- Mathis CA, Kuller LH, Klunk WE, et al. In vivo assessment of amyloid-β deposition in nondemented very elderly subjects. Annals of Neurology. 2013;73:751–761. doi: 10.1002/ana.23797. [DOI] [PMC free article] [PubMed] [Google Scholar]
- Molinuevo JL, Ripolles P, Simó M, et al. White matter changes in preclinical Alzheimer’s disease: a magnetic resonance imaging-diffusion tensor imaging study on cognitively normal older people with positive amyloid β protein 42 levels. Neurobiology of Aging. 2014;35(12):2671–2680. doi: 10.1016/j.neurobiolaging.2014.05.027. [DOI] [PubMed] [Google Scholar]
- Mormino EC, Brandel MG, Madison CM, et al. Not quite PIB-positive, not quite PIB-negative: Slight PIB elevations in elderly normal control subjects are biologically relevant. NeuroImage. 2012;59:1152–1160. doi: 10.1016/j.neuroimage.2011.07.098. [DOI] [PMC free article] [PubMed] [Google Scholar]
- Nelson PT, Alafuzoff I, Bigio EH, Bouras C, Braak H, Cairns NJ, et al. Correlation of Alzheimer Disease neuropathologic changes with cognitive status: A review of the literature. Journal of Neuropathology & Experimental Neurology. 2012;71:362–381. doi: 10.1097/NEN.0b013e31825018f7. [DOI] [PMC free article] [PubMed] [Google Scholar]
- Oh H, Mormino EC, Madison C, et al. β-Amyloid affects frontal and posterior brain networks in normal aging. NeuroImage. 2010;54:1887–1895. doi: 10.1016/j.neuroimage.2010.10.027. [DOI] [PMC free article] [PubMed] [Google Scholar]
- Oh H, Madison C, Haight TJ, et al. Effects of age and β-amyloid on cognitive changes in normal elderly people. Neurobiology of Aging. 2012;33(12):2746–2755. doi: 10.1016/j.neurobiolaging.2012.02.008. [DOI] [PMC free article] [PubMed] [Google Scholar]
- Oh H, Steffener J, Razlighi QR, et al. Aβ-related hyperactivation in frontoparietal control regions in cognitively normal elderly. Neurobiology of Aging. 2015;36(12):3247–54. doi: 10.1016/j.neurobiolaging.2015.08.016. [DOI] [PMC free article] [PubMed] [Google Scholar]
- Oh H, Steffener J, Razlighi QR, et al. β-Amyloid deposition is associated with decreased right prefrontal activation during task switching among cognitively normal elderly. Journal of Neuroscience. 2016;36(6):1962–70. doi: 10.1523/JNEUROSCI.3266-15.2016. [DOI] [PMC free article] [PubMed] [Google Scholar]
- Ossenkoppele R, Madison C, Oh H, et al. Is verbal episodic memory in elderly with amyloid deposits preserved through altered neuronal function? Cerebral Cortex. 2014;24(8):2210–2218. doi: 10.1093/cercor/bht076. [DOI] [PMC free article] [PubMed] [Google Scholar]
- Petersen RC, Wiste HJ, Weigand SD, et al. Association of Elevated Amyloid Levels With Cognition and Biomarkers in Cognitively Normal People From the Community. JAMA Neurology. 2016;73(1):85–92. doi: 10.1001/jamaneurol.2015.3098. [DOI] [PMC free article] [PubMed] [Google Scholar]
- Pike KE, Ellis KA, Villemagne VL, et al. Cognition and beta-amyloid in preclinical Alzheimer’s disease: data from the AIBL study. Neuropsychologia. 2011;49(9):2384–2390. doi: 10.1016/j.neuropsychologia.2011.04.012. [DOI] [PubMed] [Google Scholar]
- Rentz DM, Locascio JJ, Becker JA, et al. Cognition, reserve, and amyloid deposition in normal aging. Annals of Neurology. 2010;67:353–364. doi: 10.1002/ana.21904. [DOI] [PMC free article] [PubMed] [Google Scholar]
- Schott JM, Bartlett JW, Fox NC, Barnes J. Increased brain atrophy rates in cognitively normal older adults with low cerebrospinal fluid Aβ1-42. Annals of Neurology. 2010;68(6):825–834. doi: 10.1002/ana.22315. [DOI] [PubMed] [Google Scholar]
- Snitz BE, Weissfeld LA, Lopez OL, et al. Cognitive trajectories associated with β-amyloid deposition in the oldest-old without dementia. Neurology. 2013;80(15):1378–1384. doi: 10.1212/WNL.0b013e31828c2fc8. [DOI] [PMC free article] [PubMed] [Google Scholar]
- Soldan A, Pettigrew C, Cai Q, et al. Hypothetical preclinical Alzheimer disease groups and longitudinal cognitive change. JAMA Neurology. 2016;73(6):698–705. doi: 10.1001/jamaneurol.2016.0194. [DOI] [PMC free article] [PubMed] [Google Scholar]
- Sperling RA, Aisen PS, Beckett LA, et al. Toward defining the preclinical stages of Alzheimer’s disease: Recommendations from the National Institute on Aging-Alzheimer’s Association workgroups on diagnostic guidelines for Alzheimer’s disease. Alzheimer’s & Dementia. 2011;7(3):280–292. doi: 10.1016/j.jalz.2011.03.003. [DOI] [PMC free article] [PubMed] [Google Scholar]
- Sperling RA, Johnson KA, Doraiswamy PM, et al. Amyloid deposition detected with florbetapir F 18 ((18)F-AV-45) is related to lower episodic memory performance in clinically normal older individuals. Neurobiology of Aging. 2013;34(3):822–831. doi: 10.1016/j.neurobiolaging.2012.06.014. [DOI] [PMC free article] [PubMed] [Google Scholar]
- Stark SL, Roe CM, Grant EA, et al. Preclinical Alzheimer disease and risk of falls. Neurology. 2013;81:437–443. doi: 10.1212/WNL.0b013e31829d8599. [DOI] [PMC free article] [PubMed] [Google Scholar]
- Susanto TA, Pua EP, Zhou J. Cognition, brain atrophy, and cerebrospinal fluid biomarkers changes from preclinical to dementia stage of Alzheimer’s disease and the influence of apolipoprotein e. Journal of Alzheimer’s Disease. 2015;45(1):253–268. doi: 10.3233/JAD-142451. [DOI] [PubMed] [Google Scholar]
- Thai C, Lim YY, Villemagne VL, et al. Amyloid-Related Memory Decline in Preclinical Alzheimer’s Disease Is Dependent on APOE ε4 and Is Detectable over 18-Months. PLoS One. 2015;10(10) doi: 10.1371/journal.pone.0139082. [DOI] [PMC free article] [PubMed] [Google Scholar]
- Vemuri P, Lesnick TG, Przybelski SA, et al. Vascular and amyloid pathologies are independent predictors of cognitive decline in normal elderly. Brain. 2015;138:761–771. doi: 10.1093/brain/awu393. [DOI] [PMC free article] [PubMed] [Google Scholar]
- Villemagne VL, Burnham S, Bourgeat P, et al. Amyloid β deposition, neurodegeneration, and cognitive decline in sporadic Alzheimer’s disease: a prospective cohort study. Lancet Neurology. 2013;12(4):357–67. doi: 10.1016/S1474-4422(13)70044-9. [DOI] [PubMed] [Google Scholar]
- Villeneuve S, Reed BR, Wirth M, et al. Cortical thickness mediates the effect of β-amyloid on episodic memory. Neurology. 2014;82(9):761–767. doi: 10.1212/WNL.0000000000000170. [DOI] [PMC free article] [PubMed] [Google Scholar]
- Viola KL, Klein WL. Amyloid B oligomers in Alzheimer’s disease pathogenesis, treatment, and diagnosis. Acta Neuropathol. 2015;129:183–206. doi: 10.1007/s00401-015-1386-3. [DOI] [PMC free article] [PubMed] [Google Scholar]
- Vlassenko AG, McCue L, Jasielec MS, et al. Imaging and cerebrospinal fluid biomarkers in early preclinical alzheimer disease. Annals of Neurology. 2016;80(3):379–87. doi: 10.1002/ana.24719. [DOI] [PMC free article] [PubMed] [Google Scholar]
- Voevodskaya O, Sundgren PC, Strandberg O, et al. Myo-inositol changes precede amyloid pathology and relate to APOE genotype in Alzheimer disease. Neurology. 2016;86(19):1754–61. doi: 10.1212/WNL.0000000000002672. [DOI] [PMC free article] [PubMed] [Google Scholar]
- Vos SJ, Xiong C, Visser PJ, et al. Preclinical Alzheimer’s disease and its outcome: a longitudinal cohort study. Lancet Neurology. 2013;12(10):957–65. doi: 10.1016/S1474-4422(13)70194-7. [DOI] [PMC free article] [PubMed] [Google Scholar]
- Vos SJ, Gordon BA, Su Y, et al. NIA-AA staging of preclinical Alzheimer disease: discordance and concordance of CSF and imaging biomarkers. Neurobiology of Aging. 2016;44:1–8. doi: 10.1016/j.neurobiolaging.2016.03.025. [DOI] [PMC free article] [PubMed] [Google Scholar]
- Wirth M, Madison CM, Rabinovici GD, et al. Alzheimer’s disease neurodegenerative biomarkers are associated with decreased cognitive function but not β-amyloid in cognitively normal older individuals. Neurobiology of Disease. 2013;33(13):5553–5563. doi: 10.1523/JNEUROSCI.4409-12.2013. [DOI] [PMC free article] [PubMed] [Google Scholar]
- Wirth M, Oh H, Mormino EC, et al. The effect of amyloid β on cognitive decline is modulated by neural integrity in cognitively normal elderly. Alzheimer’s & Dementia. 2013;9(6):687–698. doi: 10.1016/j.jalz.2012.10.012. [DOI] [PMC free article] [PubMed] [Google Scholar]