

Abstract
Previous studies have revealed inconsistent correlations between fungal diversity and plant/soil properties from local to global scales. Here, we investigated the internal relationships between soil fungal diversity and plant/soil properties on the Loess Plateau following vegetation restoration, using Illumina sequencing of the internal transcribed spacer 2 (ITS2) region for fungal identification. We found significant effects of land use types (Af, Artificial forest; Ns, Natural shrub; Ag, Artificial grassland; Ng, Natural grassland; Sc, slope cropland) on soil fungal communities composition, and the dominant phyla were Ascomycota, Basidiomycota, and Zygomycota, which transitioned from Basidiomycota-dominant to Ascomycota-dominant community due to vegetation restoration. The Chao1 richness, Shannon’s diversity and ACE indices were significantly influenced by land use types with the order of Ns > Af > Ng > Ag > Sc, and the total number of OTUs varied widely. In contrast, Good’s coverage and Simpson’s diversity indicated no significant difference among land use types (p > 0.05). Correlation analysis showed that plant and soil properties were closely related to fungal diversity regardless of land use types. In addition, soil organic carbon (SOC) and Hplant (plant richness, Shannon-Wiener index) were strong driving factors that explained fungal diversity. As revealed by the structural equation model (SEM) and generalized additive models (GAMs), fungal diversity was directly and indirectly affected by soil and plant properties, respectively, providing evidence for strong links between soil fungal diversity and plant and soil properties on the Loess Plateau.
Keywords: soil fungal diversity, soil properties, plant properties, land use types, Loess Plateau
Introduction
Soil fungi play a crucial role in determining decomposition and nutrient cycling in terrestrial ecosystems (Bender et al., 2014; Rudgers et al., 2014; Tedersoo et al., 2014). Soil fungal community forms mutualistic symbiotic associations with plant and soil to improve absorption of nutrients (Voøíšková and Baldrian, 2013). Until recently, studies of fungal ecology (community composition and diversity) have been greatly limited by the problems of morphological identification (Montesinos-Navarro et al., 2016; Tedersoo et al., 2016). High throughput sequencing have provided a new perspective to study soil fungal ecology in ecosystems (Mueller et al., 2014; Horn et al., 2017).
Depending on the concept that “the environment selects and adaption” from Baas-Becking, the composition of soil fungal community are likely to be influenced by environmental variables (Aguilar-Trigueros et al., 2015; Filker et al., 2016). At a local scale, previous studies found that soil fungal diversity had an important influence on plant and soil properties (Rousk et al., 2010; Duchicela et al., 2013; Bender et al., 2014; van der Heijden et al., 2016). On one hand, higher fungal diversity and complex community composition enhance the decomposition rate of soil nutrients, which promote nutrients absorption and nutrient cycling (Kivlin et al., 2014; Hiscox et al., 2015; Yao et al., 2017a). On the other hand, plant provides a large amount of photosynthetic carbon for soil fungi growth, which affects soil fungal diversity via the obtained energy resources (Requena et al., 1997; Van Bruggen and Semenov, 2000; Vázquez et al., 2000; Sláviková et al., 2002; Ponge, 2013). For example, a larger number of studies reported that increasing plant richness resulted in the more richness of soil fungal diversity in rainforest ecosystems (Peay et al., 2013) and grassland (Brodie et al., 2003; Johnson et al., 2004). Besides, plant biomass (one plant property) has been reported to have positive (Van der Heijden et al., 1998), negative (Klironomos, 2002) or no (van der Heijden et al., 2016) effects on soil fungal diversity in different regions. Specifically, there have been strong interactions among soil fungal diversity, plant properties and soil properties in ecosystems, and little attention has been paid to soil fungal ecology in affecting plant and soil properties (Mueller et al., 2014; Urbanová et al., 2015; Sun et al., 2016; Ding et al., 2017). Thus, determining the links between soil fungal diversity and plant and soil properties could explore the microbiological mechanisms that how fungal diversity manipulated by plant and soil properties (Kivlin et al., 2014; García-Palacios et al., 2016; Schappe et al., 2017).
China’s Loess Plateau is one of the most deepest loess deposit and eroded area in the world (Fu et al., 2017). Last century, increasing population pressure and environmental damage issues resulted in ecological degradation in this region. To prevent the deterioration of the ecosystem, the government launched a series of ecological restoration engineering projects starting in 1980s (Deng et al., 2014; Feng et al., 2016). The “Grain for Green” vegetation restoration project or land use changes aim to rebuild the heavily damaged ecosystems. Now the Loess Plateau has become the most successful ecological restoration zone (Fu et al., 2017). Following the practice of vegetation restoration, croplands were converted into artificial forests (Caragana korshinskii and Robinia pseudoacacia) and grassland (artificial vegetation restoration), also converted into natural grassland and shrubs (natural vegetation restoration) by natural succession. In recent years, the responses of soil fungal diversity to vegetation restoration are only beginning to be explored, and responsiveness has been shown in some cases (Zeng et al., 2016; Zhang et al., 2016). Despite the fact that a large amount of literature have separately reported that fungal diversity, plant properties and soil properties changed following vegetation restoration (Feng et al., 2013; Deng et al., 2014; Zeng et al., 2016; Zhang et al., 2016), knowledge of the links between fungal diversity and plant and soil properties is still unclear in this region.
In this study, five land use types (artificial forest, Af; natural shrub, Ns; artificial grassland, Ag; natural grassland, Ng; and slop cropland, Sc) were selected on the Loess Plateau. The objectives are to test the links of plant and soil properties to fungal diversity regardless of land use type. There are three scientific questions: (i) how fungal diversity abundance, composition, and diversity altered by land use types; (ii) whether soil fungal diversity is linked to plant and soil properties, and (iii) if links do exist, what the relative contributions of plant and soil properties to soil fungal diversity are. To answer these questions, we postulated the following hypotheses: (1) soil fungal diversity and plant and soil properties affected by land use type; (2) plant and soil properties are associated with soil fungal diversity, and (3) plant and soil properties contribute to the fungal diversity on the Loess Plateau.
Materials and Methods
Sampling Areas
We carried out this study in a small watershed of the Yanhe catchment (36°23′-37°17′N, 108°45-110°28E) on the Loess Plateau located in the middle of the Yellow river. The study area occupies a total area of approximately 7,687 km2 with a semi-arid climate that has a heavy seasonal rainfall and periodic flooding. Hills cover 90% of the region (7,687 km2 in total area) with steep slopes (40%) by cliffs. Only 7% of this area is suitable for agriculture. The average annual rainfall from 1970 to 2000 was approximately 497 mm, and there are distinct rainy and dry seasons. The rainy season is from July to October, with the August rainfalls amounting for more than 20% of the annual total. The average annual temperature is from 5°C to 9°C along the elevation gradient. Most of the area lies at the altitude between 900 and 1500 m with loessal soil according to the Chinese Soil Taxonomy (Fu et al., 2000, 2011; An et al., 2013; Chen et al., 2013).
We selected 45 sites including five land use types: artificial forest, Af; artificial grassland, Ag; natural shrub, Ns; natural grassland, Ng; and slope cropland, Sc. These land use types initially developed from the similar parental material and the same climate but were changed by the different long-term land-use regimes. In addition, there were no signs of fire and natural disaster in this area during the past several decades according to historical sources. The loess is perfectly arable due to its fine grains, loose texture, and high content of mineral nutrients. In fact, it is the cradle of the ancient Chinese civilization with a long agricultural history (more than 6,000 years) in this area. The types of vegetation restoration in this area include artificial restoration (Af, Ag) due to the Grain for Green Project from 1999 and natural restoration (Ns, Ng) since 1938.
Plant Sampling Design
This work was conducted during the peak of the growing season (September 2016). Sampling sites were located at least 1 km apart from each other. Each land use type had nine replicates, and we established a homogeneous 100 × 100 m plot (five replicate plots in the center of and around each site) (Figure 1). Samples of 15 × 15 m, 5 × 5 m, and 1 × 1 m were set in forest, shrub land, grassland and slope cropland. In the forest samples, we surveyed plant height (H) and all trees with >5 cm diameter at breast height (DBH) in each plot. We estimated the dry biomass by using the allometric model (Jackson et al., 2002). In addition, the dead trees and shrubs were also sampled initially, although they were not considered in the final calculations. Further, a total of 587 trees were measured across all of the plots. We established an allometric model equation with H and DBH. The allometric model to estimate the individual tree aboveground dry biomass (AGB) used the following equation:
FIGURE 1.

Location of the study area and layout of the plots among the different land use types. The pictures were generated by ArcMap Version 10.2 (http://www.esri.com/). These pictures were photographed by the authors in the Yanhe catchment during July 2016. Af, Artificial forest; Ns, Natural shrub; Ag, Artificial grassland; Ng, Natural grassland; Sc, Slop cropland.
| (1) |
where DBH refers to the diameter at breast height (cm), and BA refers to the basal area (cm2) calculated as π∗(DBH/2)2.
In shrub land, grassland, and slope cropland, we harvested all of the aboveground biomass. All of the litter was quantified after most of the aboveground parts had fallen. The litter was collected singly after all of the plant material accumulated on the ground surface within each plot. The aboveground biomass was oven-dried at 75°C for 48 h and then weighed.
In addition, the number of species, plant coverage, and individual plant H were investigated in each plot. The Patrick index (Splant) and Shannon-Wiener index (Hplant) were calculated based on the plant community groups (Tilman et al., 1996; Keylock, 2005):
| (2) |
| (3) |
S represents the number of plant species, and plant species dominance (Pi) in each plot was calculated with the formula Pi = (relative abundance + relative height + relative plant cover)/3 (Tilman et al., 1996). The vegetation characteristics are summarized in Supplementary Table 1.
Soil Sampling Design
Similarly, five replicates along an S-shape were sampled with a soil corer (10 cm in diameter), and after the visible roots, litter, and stones were removed, mixed five samples to obtain one composite one sample (0–20 cm). Each soil sample was divided into three parts: one part was immediately stored at -80 °C using liquid nitrogen for DNA analysis; one part was used to measure soil water content (SW, %) by oven drying in aluminum containers, and the last part was sieved through a 2-mm mesh, air-dried, and then analyzed for soil properties. Soil bulk density (BD, g⋅cm-3) was measured with a stainless-steel cylinder, and oven-dried at 105∘C for 48 h. In addition, a global positioning system (GPS) was used to obtain the basal gradient information, such as latitude, longitude, and altitude.
Soil Property Analyses
Soil pH was measured in a 1:2.5 (v/v) soil:water:aqueous extract. Soil organic carbon (SOC, g kg-1) was measured by the K2Cr2O7-H2SO4 oxidation method (Nelson and Sommers, 1982). Soil total nitrogen (TN, g kg-1) was measured by the Kjeldahl procedure (UDK 140 Automatic Steam Distilling Unit, Italy) (Bremner and Mulvaney, 1982). Soil total phosphorus (TP, g⋅kg-1) was measured by the molybdenum antimony colorimetric method, and soil available phosphorus (AP, mg⋅kg-1) was extracted with 0.5 mol L-1 NaHCO3 and determined using the molybdenum-blue method (Olsen et al., 1982). Soil NH4+-N was measured using a Seal Auto Analyzer. Soil microbial biomass C and N (MBC and MBN, mg⋅kg-1) were measured by the fumigation-extraction method and calculated by using correction factors of 0.35 (kC) and 0.4 (kN), respectively (Brookes et al., 1985). Finally, each of the soil sample was performed in duplicate. The plant and soil properties among land use types are summarized in Supplementary Table 2.
Soil Fungi Analyses
Soil DNA Extraction
First, DNA was extracted from 0.5 g freeze-dried soil samples using a MoBio Power Soil DNA Isolation Kit (MoBio Laboratories, Carlsbad, CA, United States) based on the manufacturer’s instructions. Second, we used a spectrophotometer (NanoDrop ND-1000, Wilmington, DE, United States) to purify the DNA in 260/280 nm and 260/230 nm absorbance ratios. Finally, we used a FLUOstar Optima (BMG Labtech, Jena, Germany) to concentrate the DNA, which was then stored at -80°C for further molecular analysis.
Quantitative PCR (qPCR) Analysis and Illumina MiSeq Sequencing
A quantitative PCR (qPCR) assay specific for the fungal internal transcribed spacer (ITS) region was used, as were ITS1F/ITS2F (ITS1F: 5′-GGAAGTAAAAGTCGTAACAAGG-3′, ITS2F: 5′-GCTGCGTTCTTCATCGATGC-3′) as primers (Fujita et al., 2001; Lau et al., 2007), which are considered to be the universal DNA barcode marker to identify fungal diversity (Blaalid et al., 2013). Quantification of the fungal ITS gene was performed using a PCR detection system (Applied Biosystems, Waltham, MA, United States), and the reaction mixture (20 μL) contained 2× FastFire qPCR PreMix (FastFire qPCR PreMix, Tiangen Biotech, China), 1× ROX Reference Dye, 1 μL of 1/10 diluted DNA, and 10 nM of each primer. The qPCR cycling conditions were 95°C for 5 min and 35 cycles of 95°C for 30 s, 50°C for 30 s, and then 75°C for 30 s, followed by the melting curve analysis. PCR amplicons were pooled in equimolar concentrations, and the primers and their dimers were separated by electrophoresis on a 1% agarose gel. The standard curve was generated using 10-fold serial dilutions of a plasmid containing the ITS gene insert. Illumina libraries were established using the MiSeq Reagent Kit v3 (Takara, China) based on the manufacturer’s instructions. Additionally, all of the soil samples were amplified in triplicate. The high-throughput sequencing data are available at the Shanghai Majorbio BioPharm Technology Company in the Sequence Read Achieve (SRA) database under accession number P20170119.
Processing of Sequencing Data
Raw sequences were built with various software tools1 (Obi et al., 2017). Paired-end reads were assigned according to the unique barcodes that were removed together with the primers and then calculated using QIIME software package2 (Quantitative Insights Into fungal Ecology, version 1.8.0). Subsequently, soil fungal diversity was analyzed with in-house Perl scripts. The abundance-based coverage estimator (ACE) and Chao1 estimator were calculated, and then, the rarefaction curves were plotted using MOTHUR.3 Phylogenetic diversity (PD) was estimated using Chao1 (Chao, 1984) and Faith’s indices (Faith, 1992; Turnbaugh et al., 2009). The weighted unifrac distance was measured with a unifrac metric. High quality sequences were clustered into operational taxonomic units (OTUs) based on 97% sequence similarity with UCLUST, which were analyzed with the National Center for Biotechnology Information (NCBI) BLAST against GenBank. Those with a minimum of 80% sequence similarity were preserved (Caporaso et al., 2010). Finally, a representative sequence from these OTUs was chosen on the 18S rRNA Silva reference database using the RDP classifier for phylogenetic information and taxonomic information (DeSantis et al., 2006)4.
Statistical Analysis
Matrices of the pairwise taxonomic distance (Bray-Curtis) and the Euclidean distance among land use types were constructed using R package vegan (Version v.3.2.0).5 Based on the calculated Bray-Curtis distance, fitting of soil samples onto the NMDS graph and canonical correspondence analysis (CCA) were used to analyze the distribution of fungal community. Then, ANOSIM was performed using vegan in R (Ihrmark et al., 2012). The relationships between fungal diversity and plant and soil properties were evaluated by regression analyses performed at a 95% confidence interval (CI) in SPSS 21.0 for Windows (IBM Corporation, Armonk, NY, United States). The ternary sequence diagram of Hfungi (Shannon’s diversity index) and the Venn diagrams among land use types were plotted in Origin (Version 8.5).
To identify the contribution of plant and soil properties to fungal diversity, multivariate regression was applied (Ódor et al., 2006; Tedersoo et al., 2014). Additionally, generalized additive models (GAMs) were constructed with the ‘gam’ package in R. Prior to this analysis, soil properties (pH, SOC, TN, TP, AP, NH4+, MBC, and MBN) and plant properties (AGB, Coverage, Hplant, and Splant) were treated as independent variables in the final model to explain the variation for fungal diversity. In addition, structural equation models (SEMs) were constructed in AMOS (Version 20.0), using Mantel R values as the input variation. Adequate model were determined by Fisher tests with a higher goodness-of-fit index (GFI) and lower Akaike information criteria (AIC) and root square mean errors of approximation (RSMEAs) (p < 0.05). Finally, based on theoretical knowledge, we attempted to construct a conceptual model to explore the links among soil fungal diversity and plant and soil properties.
Results
Fungal Community Structure and Diversity
In our findings, Shannon diversity index (Hplant) and plant species richness (Splant) significantly affected by land use types. Hplant and Splant in natural restoration (Ng, Ns) and artificial restoration (Af, Ag) were significantly higher than slope cropland (Sc) in terms of vegetation restoration (Supplementary Table 2).
In total, 155,127 quality sequences were obtained from soil samples (Supplementary Table 3). Of all these sequences, 95.12% could be classified as fungal sequences from the NCBI database by BLAST hits, and 29,254-32,789 sequences were obtained per soil sample, belonging to 18 phyla, 111 classes, 223 orders, and 975 families. There were 582-927 phylotypes for all of the soil samples, with a mean of 767 phylotypes when grouped at the 97% similarity level. The dominant fungal phyla and their relative abundances were Ascomycota (36∼48%), Basidiomycota (31∼46%), and Zygomycota (10∼18%) among land use types. In addition, Chytridiomycota and Glomeromycota were minor phyla with lower relative abundances ranging from 2.13 to 5.27% and from 1.08 to 6.35%, respectively (Figures 2A,B). Although the relative abundance of fungal phyla fluctuated, the relative abundance of Ascomycota increased and the relative abundance of Basidiomycota decreased by land use types.
FIGURE 2.

The number of OTUs and relative abundances (%) of fungal phyla among different land use types (A,B). The ternary sequence diagram of Hfungi (Shannon’s diversity index) among the different land use types (C,D). The gray circles represent Hfungi with no significant differences among the different land use types; the blue circles represent Hfungi with a significantly higher relative abundance, and the red circles represent Hfungi with a significantly lower relative abundance.
In addition, we found that the numbers of phylotypes and the calculated diversity, such as the Chao1 richness, Shannon’s diversity and ACE indices, were significantly affected by land use types (Supplementary Table 3). The Chao1, ACE and Shannon indices gradually increased in terms of vegetation restoration which showed natural restoration (Ng, Ns) and artificial restoration (Af, Ag) were significantly higher than Sc (p < 0.05), and the lower of Chao1, ACE and Shannon indices were observed in Sc with the order of Ns > Af > Ng > Ag > Sc, and the total number of OTUs varied widely. In contrast, Good’s coverage and Simpson’s diversity indicated no significant difference among land use types (p > 0.05). In addition, ternary plots showed that the distribution of the Shannon index differed among land use types (Figures 2C,D). Intriguingly, the Shannon index was significantly abundant in natural restoration (Ns, Ng) and artificial restoration (Af, Ag) compared to the Sc. Further taxonomical classification at the genus level revealed that more than 300 fungal genera were detected. Among them, 16 genera (with relative abundances greater than 1%) were detected in all of soil samples, and these genera in total accounted for more than 69% of the fungal sequences (Supplementary Table 4). Besides, Mortierella, Fusarium and Guehomyces were dominant genera, and their relative abundance varied from 15.16 to 20.43%, 6.05 to 14.74%, and 10.85 to 22.44%, respectively.
Effect of Plant and Soil Properties on Fungal Diversity
Fungal community composition varied among land use types in NMDS plot based on the Bray-Curtis distance dissimilarity (Figure 3A). The NMDS plot showed that three randomly collected replicates from each land use type were usually closely located. The plot also indicated that the dominant of relative abundance of soil fungal community gradually decreased along the NMDS1 axis. Besides, soil fungal community among land use types were clearly separated from each other along the NMDS2 axis.
FIGURE 3.
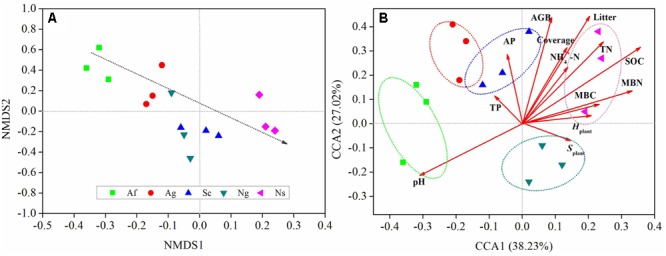
Non-metric multidimensional scaling plot (NMS) based on the calculated Bray-Curtis distance (A). The distance between symbols is inversely proportional to the degree of similarity between the communities. Canonical correspondence analysis (CCA) of fungal diversity with plant and soil properties (B). pH, soil pH value; SOC, soil organic carbon; TN,: soil total nitrogen; TP, soil total phosphorus; AP, soil available phosphorus; NH4+-N, soil NH4-N; MBC, soil microbial biomass C; MBN, soil microbial biomass N; AGB, aboveground biomass; Hplant, Shannon-Wiener index; Splant, Patrick index.
Changes in soil fungal diversity were further depicted in the two-dimensional canonical correspondence analysis (CCA) plot by using Bray-Curtis distance (Figure 3B). Based on the result of the Mantel test and Spearman’s correlation coefficients (Supplementary Table 5), plant and soil properties were strongly related to fungal diversity and community structure by CCA. Fungal diversity affected by land use types along CCA1. The first two axes explained 65.25% of the total variation for fungal diversity, and the ordination of CCA showed significant differences among land use types. Among all of soil properties tested, soil pH and SOC were relatively near CCA1 axis, which explained 38.23% of the total variation, indicating that these two properties play an important role in shifting fungal diversity. In addition, MBC and MBN had an effect on fungal diversity along the CCA2 axis. Among all of plant properties tested, litter and AGB were relatively near the CCA1 axis. In addition, plant coverage had an effect on fungal diversity along the CCA2 axis. The analysis of similarities (ANOSIM) (Figure 4) showed that R value in artificial restoration (Af, Ag) and natural restoration (Ns, Ng) was significantly higher than Sc, suggesting that soil fungal diversity was significantly altered by land use types due to vegetation restoration.
FIGURE 4.

The Bray-Curtis dissimilarity of fungal diversity among different land use types. ∗Indicates that the fungal diversities were significantly different among land use types as detected by analysis of similarities (ANOSIM) using the Bray-Curtis distance. The R-values of the ANOSIM results, which were calculated based on 999 permutations, can be observed under the dissimilarity value.
Structural Equation Model of Plant and Soil Properties for Fungal Diversity
Most of plant and soil properties are the key driving factors to explain the change of fungal diversity. Thus, variation partition analysis, stepwise regression, and GAMs were conducted to examine the relative contribution of plant and soil properties to fungal diversity (Figure 5). The combined stepwise regression and GAMs demonstrated that plant and soil properties were strongly related to fungal diversity. The variation of all the selected explanatory factors were 83.1%; soil properties variation were 29.3%, and plant properties variation were 16.7%. In addition, the variation in fungal diversity was primarily associated with plant and soil properties. Plant properties explained 16.7% of the variation, leaving 16.9% unexplained. Of all the selected soil properties, pH, SOC, TN, NH4+, AP, TP, MBC and MBN individually explained 61.4, 51.2, 62.3, 73.2, 42.5, 75.6, 69.8, and 71.5% of the variation observed, respectively.
FIGURE 5.

Structural equation model (SEM) among the plant and soil properties and fungal diversity. The standardized coefficient is given for the SEM. Values in rectangular frames denote the measurable properties. Values in ellipsoidal frames denote plant properties, soil properties and fungal diversity. The goodness of fit was greater than 0.8 for the SEM and the results of the generalized additive models (GAMs). The GAM analyses led to the following fractions: pure effect of soil properties (X1); pure effect of plant properties (X2); pure effect of fungal diversity (X3) (including the main phyla with relative abundance higher than 4%); and explained variation. The path coefficients and the explained variability were calculated after 999 bootstraps. Models with different structures were assessed using the goodness of fit statistic, a measure of the overall prediction performance.
Based on these analyses, the final SEM was fitted in order to describe the pathways of interaction among plant properties, soil properties, and fungal diversity (F = 35.26, df = 30, p < 0.01, GFI = 0.087, AIC = 116.35, RSMEA = 0.024). The final model explained 64.32% of the variation in fungal diversity (Supplementary Table 6). Further, fungal diversity was directly affected by soil properties (direct pathway effect was 0.651, and indirect pathway effect was 0.229, respectively) and directly affected by plant properties (direct pathway effect was 0.238, and indirect pathway effect was 0.539, respectively). In these direct and indirect pathway effects, SOC and Hplant had the higher direct or indirect pathway effects (0.283 and 0.280, respectively).
Discussion
Fungal Community Structure and Diversity
In this study, the Chao1 richness, Shannon’s diversity and ACE indices were significantly influenced by land use types with the order of Ns > Af > Ng > Ag > Sc, and the total number of OTUs varied widely. In contrast, Good’s coverage and Simpson’s diversity indicated no significant difference among land use types (p > 0.05). Thus, we can conclude that soil fungal diversity was strongly affected by land use types, supporting our first hypothesis. With Leguminous plants (Robinia pseudoacacia, Caragana korshinskii, and Sophora viciifolia) in terms of vegetation restoration, it (vegetation restoration) formed the dense root and consistently released amount of nutrients to improve the activity of soil fungi (Tiedje et al., 1999; Strickland and Rousk, 2010; Delgado-Baquerizo et al., 2013), resulting in the large changes of fungal diversity by land use types on the Loess Plateau.
Besides, large differences were observed in soil fungal community composition among land use types (Figures 2A,B, 4). The relative abundance of Ascomycota increased and the relative abundance of Basidiomycota decreased due to vegetation restoration, and the dominant phyla among land use types were Ascomycota, Basidiomycota, Zygomycota, which transitioned from Basidiomycota-dominant to Ascomycota-dominant community, indicating that fungal community transitioned from slow-growing oligotrophic fungi groups to fast-growing copiotrophic fungi groups. In addition, there was a higher Chao1, ACE and Shannon indices in artificial restoration (Af, Ag) and natural restoration (Ng, Ns) compared to slope cropland (Sc) (Supplementary Table 3). Similarly, plant and soil properties exhibited the same tendency with fungal diversity (Supplementary Table 2). These findings emphasize the importance of soil fungal diversity on plant and soil properties. Generally, soil fungal taxa occupied specific ecological niches according to available resources (Liggenstoffer et al., 2010; Barnard et al., 2013; Hartmann et al., 2015), and soil nutrients provided a suitable habitat for the activity of fungi (Landeras et al., 2005; Baldrian et al., 2012; Sun et al., 2015). In turn, soil fungal diversity greatly contributed to the process of nutrient decomposition (Vázquez et al., 2000; Schimel et al., 2007; Ponge, 2013; van der Heijden and Wagg, 2013). For example, higher fungal diversity and complex community composition enhanced the decomposition rate of soil nutrients (Kivlin et al., 2014; Hiscox et al., 2015; Yao et al., 2017b), which promoted to the nutrients absorption for plant (Dighton, 2006; Güsewell and Gessner, 2009; Dumbrell et al., 2010; Kembel et al., 2012; Bowles et al., 2014), leading to the same tendency of plant and soil properties with fungal diversity regardless of land use types.
Plant and Soil Properties Affecting Fungal Diversity
In fact, our data clearly showed that plant and soil properties played an important role in soil fungal diversity, which supported our second hypothesis. In canonical correspondence analysis (CCA), fungal diversity was influenced by plant and soil properties regardless of land use types. This results do agree with previous studies in northeast China (Wang et al., 2015; Sun et al., 2016), while differ from the study conducted on the Loess Plateau (Zeng et al., 2016). Generally, soil fungal community on a large scale is determined by the latitudinal or latitudinal transect along with geographic distances, climatic conditions, mean annual precipitation (MAP), and mean annual temperature (MAT). However, our study conducted in unified climate and environmental conditions (even the uniform soil type), but with different land use types, which is credible for analyses of plant and soil properties affecting soil fungal diversity.
Among all the soil properties tested in affecting fungal diversity, soil pH and SOC play an important role in fungal diversity (Figure 3), which is in agreement with most previous studies (Wang et al., 2015; Sun et al., 2016; Zeng et al., 2016; Yao et al., 2017a,b). While there was no significant difference between fungal diversity and TP, AP (p > 0.05). Because P is primarily derived from the mechanical weathering of rock (Vitousek et al., 2010; Xiong et al., 2012), and thus we can conclude that there was little impact of soil fungal diversity on the P recycling in this region. Besides, NH4+-N was closely correlated with fungal diversity, while TN had no strong correlation with fungal diversity, which indicated that not all of N (TN and NH4+-N) contributed to fungal diversity. One route is that soil fungi enhance N availability by transforming N to more mobile forms, such as NH4+-N, which is easily dissipated by the activity of soil fungi, and in turn, these mobile N provide large energy to the activity of soil fungi, which contribute to increase soil fungal diversity (Dumbrell et al., 2010; Kembel et al., 2012; Maestre et al., 2013; Bowles et al., 2014).
Among all the plant properties tested, soil fungal diversity was significantly related to plant richness (Supplementary Table 5), supporting the findings from Peay et al. (2013), who found a significant correlation between plant richness and fungal diversity in tropical forests. Besides, Hooper et al. (2005) also found that there was a positive correlation between plant richness and fungal diversity. In this study, strong effect of plant richness on fungal diversity was found, and some feedback mechanisms are likely to be found at the plant species level (Veum et al., 2014; Hartmann et al., 2015; Riggs et al., 2015). One suggestion is that soil fungi form mutualistic symbioses with many plant species and are regarded as key organisms involved in nutrient cycling due to vegetation restoration. For instance, fast-growing plant species produce large amounts of litter and root exudates, which promote nutrient cycling and enhance fungal diversity. In contrast, slow-growing plant species produce lower amounts of litter and root exudates, which are typically related to nutrient cycling (Dumbrell et al., 2010; Kembel et al., 2012). Overall, this feedback mechanisms provide a form of mutualism between plant properties and fungal diversity.
In addition, plant and soil properties explained most variation of fungal diversity by GAMs and SEM (Figure 5 and Supplementary Table 6), which supported our third hypothesis. There is a reasonable assumption that structural and compositional variations in plant and soil properties would be synchronous, but the following question remained: Do soil properties play a greater role than plant properties in fungal diversity? So SEM provide evidence that plant and soil properties were highly related to fungal diversity. No surprising, we found that soil properties were related to fungal diversity as direct effects, while plant properties had an indirect effect on fungal diversity. In these direct and indirect pathway effects, SOC and Hplant had higher direct or indirect pathway effects (0.283 and 0.280) on fungal diversity. Giving the reasonable explanation, fungal diversity was indirectly influenced by plant properties via the resource partitioning and the rates of nutrient supply (Pérez-de-Mora et al., 2006; Peiffer et al., 2013; Osakabe et al., 2014; Zechmeister-Boltenstern et al., 2015). In contrast, soil properties directly contributed to the decomposition of organic matter (Cullen, 2008; Rousk et al., 2010; Aguilar-Trigueros et al., 2015; Mueller et al., 2016), and then resulted in the increase of soil fungal diversity (Waring et al., 2013; Zhu et al., 2014; Zuppinger-Dingley et al., 2014). Although our results demonstrate that plant and soil properties were the main driving factors that explained soil fungal diversity, the influence of human disturbance and harvesting needs to be considered and investigated more thoroughly. Therefore, the improvement of plant and soil quality may provide some management measures for on soil fungal diversity the Loess Plateau.
Conceptual Model of Plant-Soil-Fungal Progress
Our data emphasized the importance of plant and soil properties and their effects on fungal diversity on the Loess Plateau. Although we cannot rule out the mechanisms proposed in the field site, the underlying links between fungal diversity and plant and soil properties have been analyzed by the conceptual model (Figure 6). In this section, the possible explanations and the progress are discussed, resulting in three potential scenarios:
FIGURE 6.

Conceptual model of the expected causal relationships among fungal diversity composition and soil and plant properties.
Plant progress: Land use type/changes alter plant properties. Subsequently, litter is always considered to be the main pathway of nutrient input from the turnover of fine roots and the surface soil layer, which is decomposed into organic and inorganic nutrients. This progress can clearly be explained by the changes in land use types, plant diversity, and plant productivity, which contribute to the increases of nutrients, and these increasing nutrients would provide natural resources for the growth of fungal community.
Fungal progress: Due to a mount of litter and plant productivity, the turnover rates of nutrients increased, resulting in the higher fungal diversity. In this progress, two main mechanisms can be introduced: one is the direct effects on plants, which form mutualistic relationship via root-associated organisms through fungal community, while the other is the indirect effects that occurred from the alteration of nutrient supply rates by the free-living fungal community.
Soil progress: A wide range of fungal community form intimate symbiotic associations with plant roots. Once established, the links between fungal diversity and plant and soil properties resulted in a common construction and relatively stable mycorrhizal network from the large abundance of fungi. In this network, fungal symbionts from leguminous plants contribute to N absorption (N-fixing progress) and even promote nutrient cycling in plant-soil-fungal system. Overall, the ecological processes suggest the strong interaction among soil fungal diversity, soil properties and plant properties on the Loess Plateau.
Conclusion
In summary, we examined the links between fungal diversity and plant and soil properties on the Loess Plateau. Our findings revealed that land use types have a large influence on plant and soil properties and the relative abundances of dominant fungal groups. Plant and soil properties, such as SOC and Hplant, were closely related to fungal diversity, which can be regard as the primary factors explaining soil fungal diversity regardless of land use types. This highlights the importance of plant and soil properties to soil fungal diversity. In addition, soil properties have a direct effect on fungal diversity, and plant properties have an indirect effect on fungal diversity according to the SEM and GAMs. Finally, the possible explanations and the progress regarding the links between fungal diversity and plant and soil properties were discussed in conceptual model. Thus the future research should focus more on the inner mechanisms such as the role of functional genes in the plant-soil-fungal system on the Loess Plateau.
Author Contributions
YY, YD, YH, and SA conceived and designed this study. YY and YD performed the field trip, sample analysis and data analysis. YY drafted the original manuscript. SA provided very constructive suggestions for revisions. All the authors approved for publication.
Conflict of Interest Statement
The authors declare that the research was conducted in the absence of any commercial or financial relationships that could be construed as a potential conflict of interest.
Acknowledgments
This study was funded by the National Natural Sciences Foundation of China (41671280), Special-Funds of Scientific Research Programs of State Key Laboratory of Soil Erosion and Dryland Farming on the Loess Plateau (A314021403-C6) and Key cultivation project of the Chinese Academy of Sciences.
Footnotes
Supplementary Material
The Supplementary Material for this article can be found online at: https://www.frontiersin.org/articles/10.3389/fmicb.2017.02198/full#supplementary-material
References
- Aguilar-Trigueros C. A., Hempel S., Powell J. R., Anderson I. C., Antonovics J., Bergmann J., et al. (2015). Branching out: towards a trait-based understanding of fungal ecology. Fungal Biol. Rev. 29 34–41. 10.1016/j.fbr.2015.03.001 [DOI] [Google Scholar]
- An S. S., Darboux F., Cheng M. (2013). Revegetation as an efficient means of increasing soil aggregate stability on the Loess Plateau (China). Geoderma 209 75–85. 10.1016/j.geoderma.2013.05.020 [DOI] [Google Scholar]
- Baldrian P., Kolařík M., Štursová M., Kopecký J., Valášková V., Vìtrovský T., et al. (2012). Active and total microbial communities in forest soil are largely different and highly stratified during decomposition. ISME J. 6 248–258. 10.1038/ismej.2011.95 [DOI] [PMC free article] [PubMed] [Google Scholar]
- Barnard R. L., Osborne C. A., Firestone M. K. (2013). Responses of soil bacterial and fungal communities to extreme desiccation and rewetting. ISME J. 7 2229–2241. 10.1038/ismej.2013.104 [DOI] [PMC free article] [PubMed] [Google Scholar]
- Bender S. F., Plantenga F., Neftel A., Jocher M., Oberholzer H. R., Köhl L., et al. (2014). Symbiotic relationships between soil fungi and plants reduce N2O emissions from soil. ISME J. 8 1336–1345. 10.1038/ismej.2013.224 [DOI] [PMC free article] [PubMed] [Google Scholar]
- Blaalid R., Kumar S., Nilsson R. H., Abarenkov K., Kirk P. M., Kauserud H. (2013). ITS1 versus ITS2 as DNA metabarcodes for fungi. Mol. Ecol. Resour. 13 218–224. 10.1111/1755-0998.12065 [DOI] [PubMed] [Google Scholar]
- Bowles T. M., Acosta-Martínez V., Calderón F., Jackson L. E. (2014). Soil enzyme activities, microbial communities, and carbon and nitrogen availability in organic agroecosystems across an intensively-managed agricultural landscape. Soil Biol. Biochem. 68 252–262. 10.1016/j.soilbio.2013.10.004 [DOI] [Google Scholar]
- Bremner J. M., Mulvaney C. S. (1982). “Nitrogen—total,” in Methods of Soil Analysis. Part 2. Chemical and Microbiological Properties (Methods of Soil) ed. Page A. L. (Madison, WI: American Society of Agronomy; ) 595–624. 10.1016/0304-4238(95)90023-3 [DOI] [Google Scholar]
- Brodie E., Edwards S., Clipson N. (2003). Soil fungal diversity structure in a temperate upland grassland soil. FEMS Microbiol. Ecol. 45 105–114. 10.1016/S0168-6496(03)00126-0 [DOI] [PubMed] [Google Scholar]
- Brookes P. C., Landman A., Pruden G., Jenkinson D. S. (1985). Chloroform fumigation and the release of soil nitrogen: a rapid direct extraction method to measure bacterial biomass nitrogen in soil. Soil Biol. Biochem. 17 837–842. 10.1016/0038-0717(85)90144-0 [DOI] [Google Scholar]
- Caporaso J. G., Kuczynski J., Stombaugh J., Bittinger K., Bushman F. D., Costello E. K., et al. (2010). QIIME allows analysis of high-throughput communities sequencing data. Nat. Methods 7 335–336. 10.1038/nmeth.f.303 [DOI] [PMC free article] [PubMed] [Google Scholar]
- Chao A. (1984). Nonparametric estimation of the number of classes in a population. Scand. J. Stat. 11 265–270. 10.1214/aoms/1177729949 [DOI] [Google Scholar]
- Chen J., Liu X., Zheng J., Zhang B., Lu H., Chi Z., et al. (2013). Biochar soil amendment increased bacterial but decreased fungal gene abundance with shifts in community structure in a slightly acid rice paddy from Southwest China. Appl. Soil Ecol. 71 33–44. 10.1016/j.apsoil.2013.05.003 [DOI] [Google Scholar]
- Cullen D. (2008). Genomics: fungal symbiosis unearthed. Nature 452 42–43. 10.1038/452042a [DOI] [PubMed] [Google Scholar]
- Delgado-Baquerizo M., Maestre F. T., Gallardo A., Bowker M. A., Wallenstein M. D., Quero J. L., et al. (2013). Decoupling of soil nutrient cycles as a function of aridity in global drylands. Nature 502 672–676. 10.1038/nature12670 [DOI] [PubMed] [Google Scholar]
- Deng L., Liu G. B., Shangguan Z. P. (2014). Land-use conversion and changing soil carbon stocks in China’s ‘Grain-for-Green’ Program: a synthesis. Glob. Change Biol. 20 3544–3556. 10.1111/gcb.12508 [DOI] [PubMed] [Google Scholar]
- DeSantis T. Z., Hugenholtz P., Larsen N., Rojas M., Brodie E. L., Keller K., et al. (2006). Greengenes, a chimera-checked 16S rRNA gene database and workbench compatible with ARB. Appl. Environ. Microbiol. 72 5069–5072. [DOI] [PMC free article] [PubMed] [Google Scholar]
- Dighton J. (2006). Fungi in Ecosystem Processes Vol. 31 Boca Raton, FL: CRC Press; 10.1201/9780203911440 [DOI] [Google Scholar]
- Ding J., Jiang X., Guan D., Zhao B., Ma M., Zhou B., et al. (2017). Influence of inorganic fertilizer and organic manure application on fungal communities in a long-term field experiment of Chinese Mollisols. Appl. Soil Ecol. 111 114–122. [Google Scholar]
- Duchicela J., Sullivan T. S., Bontti E., Bever J. D. (2013). Soil aggregate stability increase is strongly related to fungal diversity succession along an abandoned agricultural field chronosequence in the Bolivian Altiplano. Appl. Environ. Microbiol. 50 1266–1273. 10.1111/1365-2664.12130 [DOI] [Google Scholar]
- Dumbrell A. J., Nelson M., Helgason T., Dytham C., Fitter A. H. (2010). Relative roles of niche and neutral processes in structuring a soil microbial community. ISME J. 4 337–345. 10.1038/ismej.2010.48 [DOI] [PubMed] [Google Scholar]
- Faith D. P. (1992). Conservation evaluation and phylogenetic diversity. Biol. Consserv. 61 1–10. 10.1016/0006-3207(92)91201-3 [DOI] [Google Scholar]
- Feng X., Fu B., Lu N., Zeng Y., Wu B. (2013). How ecological restoration alters ecosystem services: an analysis of carbon sequestration in China’s Loess Plateau. Sci. Rep. 3:2846. 10.1038/srep02846 [DOI] [PMC free article] [PubMed] [Google Scholar]
- Feng X., Fu B., Piao S., Wang S., Ciais P., Zeng Z., et al. (2016). Revegetation in China Loess Plateau is approaching sustainable water resource limits. Nat. Clim. Change 6 1019–1022. 10.1038/nclimate3092 [DOI] [Google Scholar]
- Filker S., Sommaruga R., Vila I., Stoeck T. (2016). Microbial eukaryote plankton communities of high-mountain lakes from three continents exhibit strong biogeographic patterns. Mol. Ecol. Resour. 25 2286–2301. 10.1111/mec.13633 [DOI] [PMC free article] [PubMed] [Google Scholar]
- Fu B. J., Chen L., Ma K., Zhou H., Wang J. (2000). The relationships between land use and soil conditions in the hilly area of the loess plateau in northern Shaanxi, China. Catena 39 69–78. 10.1016/S0341-8162(99)00084-3 [DOI] [Google Scholar]
- Fu B. J., Liu Y., Lü Y., He C., Zeng Y., Wu B. (2011). Assessing the soil erosion control service of ecosystems change in the Loess Plateau of China. Ecol. Complex. 8 284–293. 10.1016/j.ecocom.2011.07.003 [DOI] [Google Scholar]
- Fu B. J., Wang S., Liu Y., Liu J., Liang W., Miao C. (2017). Hydrogeomorphic ecosystem responses to natural and anthropogenic changes in the Loess Plateau of China. Annu. Rev. Earth. Plant. Sci. 45 223–243. 10.1146/annurev-earth-063016-020552 [DOI] [Google Scholar]
- Fujita S. I., Senda Y., Nakaguchi S., Hashimoto T. (2001). Multiplex PCR using internal transcribed spacer 1 and 2 regions for rapid detection and identification of yeast strains. J. Clin. Microbiol. 39 3617–3622. 10.1128/JCM.39.10.3617-3622.2001 [DOI] [PMC free article] [PubMed] [Google Scholar]
- García-Palacios P., Shaw E. A., Wall D. H., Hättenschwiler S. (2016). Temporal dynamics of biotic and abiotic drivers of litter decomposition. Ecol. Lett. 19 554–559. 10.1111/ele.12590 [DOI] [PubMed] [Google Scholar]
- Güsewell S., Gessner M. O. (2009). N: P ratios influence litter decomposition and colonization by fungi and bacteria in microcosms. Funct. Ecol. 23 211–219. 10.1111/j.1365-2435.2008.01478.x [DOI] [Google Scholar]
- Hartmann M., Frey B., Mayer J., Mäder P., Widmer F. (2015). Distinct soil microbial diversity under long-term organic and conventional farming. ISME J. 9 1177–1194. 10.1038/ismej.2014.210 [DOI] [PMC free article] [PubMed] [Google Scholar]
- Hiscox J., Savoury M., Müller C. T., Lindahl B. D., Rogers H. J., Boddy L. (2015). Priority effects during fungal diversity establishment in beech wood. ISME J. 9 2246–2260. 10.1038/ismej.2015.38 [DOI] [PMC free article] [PubMed] [Google Scholar]
- Hooper D. U., Chapin F. S., III., Ewel J. J., Hector A., Inchausti P., Lavorel S., et al. (2005). Effects of biodiversity on ecosystem functioning: a consensus of current knowledge. Ecol. Monogr. 75 3–35. 10.1890/04-0922 24774563 [DOI] [Google Scholar]
- Horn S., Hempel S., Verbruggen E., Rillig M. C., Caruso T. (2017). Linking the community structure of arbuscular mycorrhizal fungi and plants: a story of interdependence? ISME J. 9 2210–2217. 10.1038/ismej.2017.5 [DOI] [PMC free article] [PubMed] [Google Scholar]
- Ihrmark K., Bödeker I. T., Cruz-Martinez K., Friberg H., Kubartova A., Schenck J., et al. (2012). New primers to amplify the fungal ITS2 region–evaluation by 454-sequencing of artificial and natural communities. FEMS Microbiol. Ecol. 82 666–677. 10.1111/j.1574-6941.2012.01437.x [DOI] [PubMed] [Google Scholar]
- Jackson R. B., Banner J. L., Jobbágy E. G., Pockman W. T., Wall D. H. (2002). Ecosystem carbon loss with woody plant invasion of grasslands. Nature 418 623–626. 10.1038/nature00910 [DOI] [PubMed] [Google Scholar]
- Johnson D., Vandenkoornhuyse P. J., Leake J. R., Gilbert L., Booth R. E., Grime J. P., et al. (2004). Plant communities affect arbuscular mycorrhizal fungal diversity and community composition in grassland microcosms. New Phytol. 161 503–515. 10.1046/j.1469-8137.2003.00938.x [DOI] [PubMed] [Google Scholar]
- Kembel S. W., Jones E., Kline J., Northcutt D., Stenson J., Womack A. M., et al. (2012). Architectural design influences the diversity and structure of the built environment microbiome. ISME J. 6 1469–1479. 10.1038/ismej.2011.211 [DOI] [PMC free article] [PubMed] [Google Scholar]
- Keylock C. J. (2005). Simpson diversity and the Shannon–Wiener index as special cases of a generalized entropy. Oikos 109 203–207. 10.1111/j.0030-1299.2005.13735.x [DOI] [Google Scholar]
- Kivlin S. N., Winston G. C., Goulden M. L., Treseder K. K. (2014). Environmental filtering affects soil fungal diversity composition more than dispersal limitation at regional scales. Fungal Ecol. 12 14–25. 10.1016/j.funeco.2014.04.004 [DOI] [Google Scholar]
- Klironomos J. N. (2002). Feedback with soil biota contributes to plant rarity and invasiveness in communities. Nature 417 67–70. 10.1038/417067a [DOI] [PubMed] [Google Scholar]
- Landeras E., García P., Fernández Y., Braña M., Fernández-Alonso O., Méndez-Lodos S., et al. (2005). Outbreak of pitch canker caused by Fusarium circinatum on Pinus spp. in northern Spain. Plant Dis. 89 1015–1015. 10.1094/PD-89-1015A [DOI] [PubMed] [Google Scholar]
- Lau A., Chen S., Sorrell T., Carter D., Malik R., Martin P., et al. (2007). Development and clinical application of a panfungal PCR assay to detect and identify fungal DNA in tissue specimens. J. Clin. Microbiol. 45 380–385. 10.1128/JCM.01862-06 [DOI] [PMC free article] [PubMed] [Google Scholar]
- Liggenstoffer A. S., Youssef N. H., Couger M. B., Elshahed M. S. (2010). Phylogenetic diversity and community structure of anaerobic gut fungi (phylum Neocallimastigomycota) in ruminant and non-ruminant herbivores. ISME J. 4 1225–1235. 10.1038/ismej.2010.49 [DOI] [PubMed] [Google Scholar]
- Maestre F. T., Escolar C., Guevara M. L., Quero J. L., Lázaro R., Delgado-Baquerizo M., et al. (2013). Changes in biocrust cover drive carbon cycle responses to climate change in drylands. Glob. Change Biol. 19 3835–3847. 10.1111/gcb.12306 [DOI] [PMC free article] [PubMed] [Google Scholar]
- Montesinos-Navarro A., Verdú M., Querejeta J. I., Sortibrán L., Valiente-Banuet A. (2016). Soil fungi promote nitrogen transfer among plants involved in long-lasting facilitative interactions. Perspect. Plant Ecol. 18 45–51. 10.1016/j.ppees.2016.01.004 [DOI] [Google Scholar]
- Mueller P., Jensen K., Megonigal J. P. (2016). Plants mediate soil organic matter decomposition in response to sea level rise. Glob. Change Biol. 22 404–414. 10.1111/gcb.13082 [DOI] [PubMed] [Google Scholar]
- Mueller R. C., Paula F. S., Mirza B. S., Rodrigues J. L., Nüsslein K., Bohannan B. J. (2014). Links between plant and fungal communities across a deforestation chronosequence in the Amazon rainforest. ISME J. 8 1548–1550. 10.1038/ismej.2013.253 [DOI] [PMC free article] [PubMed] [Google Scholar]
- Nelson D. W., Sommers L. E. (1982). Dry combustion method using medium temperature resistance furnace. Methods Soil Anal. 2 539–579. [Google Scholar]
- Obi C. C., Adebusoye S. A., Amund O. O., Ugoji E. O., Ilori M. O., Hedman C. J., et al. (2017). Structural dynamics of bacterial communities in polycyclic aromatic hydrocarbon-contaminated tropical estuarine sediments undergoing simulated aerobic biotreatment. Appl. Microbiol. Biot. 6 1–16. 10.1007/s00253-017-8151-6 [DOI] [PubMed] [Google Scholar]
- Ódor P., Heilmann-Clausen J., Christensen M., Aude E., Van Dort K. W., Piltaver A., et al. (2006). Diversity of dead wood inhabiting fungi and bryophytes in semi-natural beech forests in Europe. Biol. Conserv. 131 58–71. 10.1016/j.biocon.2006.02.004 [DOI] [Google Scholar]
- Olsen S. R., Sommers L. E., Page A. L. (1982). Methods of soil analysis. Part 2. Chemical and microbiological properties of Phosphorus. ASA Monogr. 9 403–430. [Google Scholar]
- Osakabe Y., Yamaguchi-Shinozaki K., Shinozaki K., Tran L. S. P. (2014). ABA control of plant macroelement membrane transport systems in response to water deficit and high salinity. New Phytol. 202 35–49. 10.1111/nph.12613 [DOI] [PubMed] [Google Scholar]
- Peay K. G., Baraloto C., Fine P. V. (2013). Strong coupling of plant and fungal diversity structure across western Amazonian rainforests. ISME J. 7 1852–1861. 10.1038/ismej.2013.66 [DOI] [PMC free article] [PubMed] [Google Scholar]
- Peiffer J. A., Spor A., Koren O., Jin Z., Tringe S. G., Dangl J. L., et al. (2013). Diversity and heritability of the maize rhizosphere microbiome under field conditions. Proc. Natl. Acad. Sci. U.S.A. 110 6548–6553. 10.1073/pnas.1302837110 [DOI] [PMC free article] [PubMed] [Google Scholar]
- Pérez-de-Mora A., Burgos P., Madejón E., Cabrera F., Jaeckel P., Schloter M. (2006). Microbial community structure and function in a soil contaminated by heavy metals: effects of plant growth and different amendments. Soil Biol. Biochem. 38 327–341. 10.1016/j.soilbio.2005.05.010 [DOI] [Google Scholar]
- Ponge J. F. (2013). Plant–soil feedbacks mediated by humus forms: a review. Soil Biol. Biochem. 57 1048–1060. 10.1016/j.soilbio.2012.07.019 [DOI] [Google Scholar]
- Requena N., Jimenez I., Toro M., Barea J. M. (1997). Interactions between plant-growth-promoting rhizobacteria (PGPR), arbuscular mycorrhizal fungi and Rhizobium spp. in the rhizosphere of Anthyllis cytisoides, a model legume for revegetation in mediterranean semi-arid ecosystems. New Phytol. 136 667–677. 10.1046/j.1469-8137.1997.00786.x [DOI] [PubMed] [Google Scholar]
- Riggs C. E., Hobbie S. E., Bach E. M., Hofmockel K. S., Kazanski C. E. (2015). Nitrogen addition changes grassland soil organic matter decomposition. Biogeochemistry 125 203–219. 10.1007/s10533-015-0123-2 [DOI] [Google Scholar]
- Rousk J., Bååth E., Brookes P. C., Lauber C. L., Lozupone C., Caporaso J. G., et al. (2010). Soil bacterial and fungal communities across a pH gradient in an arable soil. ISME J. 4 1340–1351. [DOI] [PubMed] [Google Scholar]
- Rudgers J. A., Kivlin S. N., Whitney K. D., Price M. V., Waser N. M., Harte J. (2014). Responses of high-altitude graminoids and soil fungi to 20 years of experimental warming. Ecology 95 1918–1928. 10.1890/13-1454.1 [DOI] [PubMed] [Google Scholar]
- Schappe T., Albornoz F. E., Turner B. L., Neat A., Condit R., Jones F. A. (2017). The role of soil chemistry and plant neighbourhoods in structuring fungal communities in three Panamanian rainforests. J. Ecol. 105 569–579. 10.1111/1365-2745.12752 [DOI] [Google Scholar]
- Schimel J., Balser T. C., Wallenstein M. (2007). Microbial stress-response physiology and its implications for ecosystem function. Ecology 88 1386–1394. [DOI] [PubMed] [Google Scholar]
- Sláviková E., Košíková B., Mikulášová M. (2002). Biotransformation of waste lignin products by the soil-inhabiting yeast Trichosporon pullulans. Can. J. Microbiol. 48 200–203. 10.1139/w02-013 [DOI] [PubMed] [Google Scholar]
- Strickland M. S., Rousk J. (2010). Considering fungal: bacterial dominance in soils–methods, controls, and ecosystem implications. Soil Biol. Biochem. 42 1385–1395. 10.1016/j.soilbio.2010.05.007 [DOI] [Google Scholar]
- Sun R., Dsouza M., Gilbert J. A., Guo X., Wang D., Guo Z., et al. (2016). Fungal community composition in soils subjected to long-term chemical fertilization is most influenced by the type of organic matter. Environ. Microbiol. 18 5137–5150. 10.1111/1462-2920.13512 [DOI] [PubMed] [Google Scholar]
- Sun R., Zhang X. X., Guo X., Wang D., Chu H. (2015). Bacterial diversity in soils subjected to long-term chemical fertilization can be more stably maintained with the addition of livestock manure than wheat straw. Soil Biol. Biochem. 88 9–18. 10.1016/j.soilbio.2015.05.007 [DOI] [Google Scholar]
- Tedersoo L., Bahram M., Cajthaml T., Põlme S., Hiiesalu I., Anslan S., et al. (2016). Tree diversity and species identity effects on soil fungi, protists and animals are context dependent. ISME J. 10 346–362. 10.1038/ismej.2015.116 [DOI] [PMC free article] [PubMed] [Google Scholar]
- Tedersoo L., Bahram M., Põlme S., Kõljalg U., Yorou N. S., Wijesundera R., et al. (2014). Global diversity and geography of soil fungi. Science 346 125688. 10.1126/science.aaa1185 [DOI] [PubMed] [Google Scholar]
- Tiedje J. M., Asuming-Brempong S., Nüsslein K., Marsh T. L., Flynn S. J. (1999). Opening the black box of soil bacterial diversity. Appl. Soil Ecol. 13 109–122. 10.1016/S0929-1393(99)00026-8 [DOI] [Google Scholar]
- Tilman D., Wedin D., Knops J. (1996). Productivity and sustainability influenced by biodiversity in grassland ecosystems. Nature 379 718–720. [Google Scholar]
- Turnbaugh P. J., Ridaura V. K., Faith J. J., Rey F. E., Knight R., Gordon J. I. (2009). The effect of diet on the human gut microbiome: a metagenomic analysis in humanized gnotobiotic mice. Sci. Transl. Med. 1 6ra14. 10.1126/scitranslmed.3000322 [DOI] [PMC free article] [PubMed] [Google Scholar]
- Urbanová M., Šnajdr J., Baldrian P. (2015). Composition of fungal and bacterial communities in forest litter and soil is largely determined by dominant trees. Soil Biol. Biochem. 84 53–64. 10.1016/j.soilbio.2015.02.011 [DOI] [Google Scholar]
- Van Bruggen A. H. C., Semenov A. M. (2000). In search of biological indicators for soil health and disease suppression. Appl. Soil Ecol. 15 13–24. 10.1016/S0929-1393(00)00068-8 [DOI] [Google Scholar]
- van der Heijden M. G., de Bruin S., Luckerhoff L., van Logtestijn R. S., Schlaeppi K. (2016). A widespread plant-fungal-bacterial symbiosis promotes plant biodiversity, plant nutrition and seedling recruitment. ISME J. 10 389–399. 10.1038/ismej.2015.120 [DOI] [PMC free article] [PubMed] [Google Scholar]
- Van der Heijden M. G., Klironomos J. N., Ursic M., Moutoglis P. (1998). Mycorrhizal fungal diversity determines plant biodiversity, ecosystem variability and productivity. Nature 396 69–72. 10.1038/23932 [DOI] [Google Scholar]
- van der Heijden M. G., Wagg C. (2013). Soil microbial diversity and agro-ecosystem functioning. Plant Soil. 363 1–5. 10.1007/s11104-012-1545-4 [DOI] [Google Scholar]
- Vázquez M. M., César S., Azcón R., Barea J. M. (2000). Interactions between arbuscular mycorrhizal fungi and other microbial inoculants (Azospirillum, Pseudomonas, Trichoderma) and their effects on microbial population and enzyme activities in the rhizosphere of maize plants. Appl. Soil Ecol. 15 261–272. 10.1016/S0929-1393(00)00075-5 [DOI] [Google Scholar]
- Veum K. S., Goyne K. W., Kremer R. J., Miles R. J., Sudduth K. A. (2014). Biological indicators of soil quality and soil organic matter characteristics in an agricultural management continuum. Biogeochemistry 117 81–99. 10.1007/s10533-013-9868-7 [DOI] [Google Scholar]
- Vitousek P. M., Porder S., Houlton B. Z., Chadwick O. A. (2010). Terrestrial phosphorus limitation: mechanisms, implications, and nitrogen–phosphorus interactions. Ecol. Appl. 20 5–15. 10.1890/08-0127.1 [DOI] [PubMed] [Google Scholar]
- Voříšková J., Baldrian P. (2013). Fungal community on decomposing leaf litter undergoes rapid successional changes. ISME J. 7 477–486. 10.1038/ismej.2012.116 [DOI] [PMC free article] [PubMed] [Google Scholar]
- Wang X., Van Nostrand J. D., Deng Y., Lü X., Wang C., Zhou J. (2015). Scale-dependent effects of climate and geographic distance on bacterial diversity patterns across northern china’s grasslands. FEMS Microbiol. Ecol. 91 213–222. 10.1093/femsec/fiv133 [DOI] [PubMed] [Google Scholar]
- Waring B. G., Averill C., Hawkes C. V. (2013). Differences in fungal and bacterial physiology alter soil carbon and nitrogen cycling: insights from meta-analysis and theoretical models. Ecol. Lett. 16 887–894. 10.1111/ele.12125 [DOI] [PubMed] [Google Scholar]
- Xiong J., Liu Y., Lin X., Zhang H., Zeng J., Hou J., et al. (2012). Geographic distance and pH drive bacterial distribution in alkaline lake sediments across Tibetan Plateau. Environ. Microbiol. 14 2457–2466. 10.1111/j.1462-2920.2012.02799.x [DOI] [PMC free article] [PubMed] [Google Scholar]
- Yao Q., Liu J., Yu Z., Li Y., Jin J., Liu X. (2017a). Changes of bacterial community compositions after three years of biochar application in a black soil of northeast china. Appl. Soil Ecol. 113 11–21. 10.1016/j.apsoil.2017.01.007 [DOI] [Google Scholar]
- Yao Q., Liu J., Yu Z., Li Y., Jin J., Liu X. (2017b). Three years of biochar amendment alters soil physiochemical properties and fungal community composition in a black soil of northeast China. Soil Biol. Biochem. 110 56–67. 10.1016/j.soilbio.2017.03.005 [DOI] [Google Scholar]
- Zechmeister-Boltenstern S., Keiblinger K. M., Mooshammer M., Peñuelas J., Richter A., Sardans J., et al. (2015). The application of ecological stoichiometry to plant–bacterial–soil organic matter transformations. Ecol. Monogr. 85 133–155. 10.1890/14-0777.1.sm [DOI] [Google Scholar]
- Zeng Q. C., Dong Y. H., An S. S. (2016). Bacterial communities responses to soils along a latitudinal and vegetation gradient on the loess plateau, china. PLOS ONE 11:e0152894. 10.1371/journal.pone.0152894 [DOI] [PMC free article] [PubMed] [Google Scholar]
- Zhang C., Liu G., Xue S., Wang G. (2016). Soil bacterial community dynamics reflect changes in plant community and soil properties during the secondary succession of abandoned farmland in the loess plateau. Soil Biol. Biochem. 97 40–49. 10.1016/j.soilbio.2016.02.013 [DOI] [Google Scholar]
- Zhu B., Gutknecht J. L., Herman D. J., Keck D. C., Firestone M. K., Cheng W. (2014). Rhizosphere priming effects on soil carbon and nitrogen mineralization. Soil Biol. Biochem. 76 183–192. 10.1016/j.soilbio.2014.04.033 [DOI] [Google Scholar]
- Zuppinger-Dingley D., Schmid B., Petermann J. S., Yadav V., De Deyn G. B., Flynn D. F. (2014). Selection for niche differentiation in plant communities increases biodiversity effects. Nature 515 108–111. 10.1038/nature13869 [DOI] [PubMed] [Google Scholar]
Associated Data
This section collects any data citations, data availability statements, or supplementary materials included in this article.