

Abstract
Objective
Recovery of motor function is important for regaining independence after stroke, but difficult to predict for individual patients. Our aim was to develop an efficient, accurate, and accessible algorithm for use in clinical settings. Clinical, neurophysiological, and neuroimaging biomarkers of corticospinal integrity obtained within days of stroke were combined to predict likely upper limb motor outcomes 3 months after stroke.
Methods
Data from 207 patients recruited within 3 days of stroke [103 females (50%), median age 72 (range 18–98) years] were included in a Classification and Regression Tree analysis to predict upper limb function 3 months poststroke.
Results
The analysis produced an algorithm that sequentially combined a measure of upper limb impairment; age; the presence or absence of upper limb motor evoked potentials elicited with transcranial magnetic stimulation; and stroke lesion load obtained from MRI or stroke severity assessed with the NIHSS score. The algorithm makes correct predictions for 75% of patients. A key biomarker obtained with transcranial magnetic stimulation is required for one third of patients. This biomarker combined with NIHSS score can be used in place of more costly magnetic resonance imaging, with no loss of prediction accuracy.
Interpretation
The new algorithm is more accurate, efficient, and accessible than its predecessors, which may support its use in clinical practice. While further work is needed to potentially incorporate sensory and cognitive factors, the algorithm can be used within days of stroke to provide accurate predictions of upper limb functional outcomes at 3 months after stroke. www.presto.auckland.ac.nz
Introduction
Recovery of upper limb motor function is important for regaining independence after stroke.1, 2 In general, greater initial impairment is associated with worse motor outcomes.2, 3 However, experienced clinicians find it difficult to accurately predict functional outcomes for individual patients.4 Being able to predict motor outcomes soon after stroke could support realistic discharge planning, rehabilitation, goal setting, and appropriate allocation of time and resources by clinicians and patients.5
There is growing interest in using biomarkers to predict patients’ motor recovery and outcomes.6, 7 Patients in whom transcranial magnetic stimulation elicits a motor evoked potential in muscles of the paretic limb typically experience greater motor recovery and better outcomes than patients without motor evoked potentials.3, 8, 9 MRI can also be used to derive biomarkers of the motor system after stroke.10 Worse upper limb motor recovery and outcomes are predicted by greater stroke lesion load on descending corticomotor pathways,11 and greater asymmetry in fractional anisotropy along the corticospinal tracts.12, 13, 14, 15 To date no single clinical measure or neurological biomarker has been able to accurately predict motor recovery or outcome for all patients, and therefore approaches using combinations of measures and biomarkers are needed.6
We developed the Predict Recovery Potential (PREP) algorithm which combines clinical measures and neurological biomarkers in the initial days after stroke to predict upper limb functional outcomes at 3 months.15 The algorithm is unique in its sequential nature, which begins with a simple clinical test and then uses biomarkers as required to resolve uncertainty. The algorithm has been validated in a sample of 192 patients including those with previous stroke.5 Using PREP in clinical practice increased therapist confidence, modified therapy content, and was associated with a 1 week reduction in length of stay, with no detrimental effects on patient outcomes.5 While using PREP can increase rehabilitation efficiency, not all clinical settings have access to transcranial magnetic stimulation and the ability to derive quantitative biomarkers from diffusion‐weighted MRI.
The purpose of this study was to develop a new algorithm that would be more efficient, accurate, and accessible to practising clinicians. We sought to determine if TMS could be used in fewer patients than originally proposed or even eliminated, and whether the diffusion‐weighted MRI biomarker could be replaced with a simpler measure of stroke lesion load obtained from T1‐weighted images alone.11, 16
Methods
Patients
A retrospective analysis of data from two previous studies of 207 patients [103 females (50%); median age 72 (range 18–98) years] was carried out.5, 15 Patient clinical characteristics are summarized in Table 1. The 2014 study provided data from 50 patients with first‐ever monohemispheric ischemic stroke. The 2017 study provided data from an independent cohort of 157 patients with previous or first‐ever ischemic stroke or intracerebral hemorrhage. For both studies, people were excluded if they had cerebellar stroke, cognitive or communication impairments precluding informed consent, or if they resided out of area precluding follow‐up. The primary outcome for both studies was Action Research Arm Test (ARAT) score at 3 months poststroke (mean = 92 days, SD = 9 days), which was obtained by a trained clinical assessor blinded to algorithm prognosis and not involved in patient care. Upper limb therapy dose in minutes was recorded for each session by treating physical and occupational therapists during inpatient rehabilitation, and the total number of upper limb therapy minutes was calculated for subsequent analysis.
Table 1.
Participant characteristics
| N = 207 | |
|---|---|
| Demographic characteristics | |
| Age (years) | |
| Median age (range) | 72 (18–98) |
| <80 years | 139 (67%) |
| Sex | |
| Male | 104 (50%) |
| Female | 103 (50%) |
| Ethnicity | |
| European | 131 (63%) |
| Maori | 10 (5%) |
| Pacific | 30 (15%) |
| Asian | 36 (17%) |
| Stroke risk factors | |
| Hypertension | 133 (64%) |
| Dyslipidemia | 66 (32%) |
| Previous cardiac history | 56 (27%) |
| Atrial fibrillation | 47 (23%) |
| Diabetes mellitus | 43 (21%) |
| Ex‐smoker | 35 (17%) |
| Smoker | 17 (8%) |
| Stroke characteristics | |
| First stroke | |
| yes | 181 (87%) |
| no | 26 (13%) |
| Stroke type (Oxfordshire classification) | |
| Total anterior circulation infarct | 12 (6%) |
| Partial anterior circulation infarct | 74 (36%) |
| Lacunar infarct | 84 (40%) |
| Posterior circulation infarct (excluding cerebellar) | 16 (8%) |
| Intracerebral hemorrhage | 21 (10%) |
| Hemisphere | |
| Right | 108 (52%) |
| Hand | |
| Dominant | 95 (46%) |
| Intravenous thrombolysis | |
| yes | 19 (9%) |
| Endovascular thrombectomy | |
| yes | 3 (1%) |
| Stroke Severity | |
| Mild (NIHSS score 0 – 4) | 112 (54%) |
| Moderate (NIHSS score 5 – 15) | 85 (41%) |
| Severe (NIHSS score ≥ 16) | 10 (5%) |
| Paretic upper limb measures | |
| Baseline SAFE score | |
| Excellent outcome median (range) | 8 (0 – 9) |
| Good outcome median (range) | 6 (0 – 9) |
| Limited outcome median (range) | 1 (0 – 5) |
| Poor outcome median (range) | 0 (0 – 3) |
| Baseline UE‐FM score | |
| Excellent outcome median (range) | 58 (16 – 65) |
| Good outcome median (range) | 43 (6 – 63) |
| Limited outcome median (range) | 13 (2 – 27) |
| Poor outcome median (range) | 7 (4 – 14) |
| 3‐month UE‐FM score | |
| Excellent outcome median (range) | 64 (47 – 66) |
| Good outcome median (range) | 54 (40 – 65) |
| Limited outcome median (range) | 32 (21 – 50) |
| Poor outcome median (range) | 9 (7 – 31) |
Paretic upper limb measures are reported for actual (not predicted) outcome categories, based on Action Research Arm Test score at 3 months (Table 2). NIHSS, National Institutes of Health Stroke Scale; SAFE, Shoulder Abduction, Finger Extension; UE‐FM, upper extremity Fugl‐Meyer.
Algorithm measures
Shoulder abduction and finger extension strength were graded in the paretic upper limb using the Medical Research Council (MRC) grades 3 days after stroke symptom onset (median = 3 days, range = 1–4 days). The MRC grades for each movement were summed to obtain a SAFE score out of 10. The NIHSS and upper extremity Fugl‐Meyer (UE‐FM) scores were obtained at the same time as the SAFE score. TMS and MRI biomarkers were obtained for all patients in the smaller cohort (n = 50), and only as required by the PREP algorithm for patients in the larger cohort. TMS was used to determine the presence or absence of MEPs in the paretic extensor carpi radialis and first dorsal interosseous muscles, 5 to 7 days poststroke. These muscles were chosen as impaired wrist extension and index finger control often limit upper limb function after stroke. Standard surface EMG techniques were used, and single pulse TMS was delivered with a figure‐of‐eight coil connected to a MagStim 200 stimulator. The coil was oriented to produce posterior‐to‐anterior current flow in the ipsilesional primary motor cortex. The patient was considered MEP+ if MEPs of any amplitude were observed at a consistent latency (±3 msec) on at least 50% of at least eight trials in either of the recorded muscles.
MRI was used 10 to 14 days poststroke to obtain three biomarkers, described below. T1‐weighted and diffusion‐weighted images were acquired with a Siemens 1.5 T Avanto scanner. Axial T1‐weighted images had 1.0 × 1.0 × 1.0 mm voxels, a 256 mm field of view, TR = 11 msec, and TE = 4.94 msec. Diffusion‐weighted images had 1.8 × 1.8 × 3.0 mm voxels, a 230 mm field of view, b = 2000 s.mm2, TR = 6700 msec, TE = 101 msec, 30 gradient directions, and two averages. The first biomarker was used in both previous studies and involved calculating the mean fractional anisotropy within the posterior limb of each internal capsule. A template volume of interest for the posterior limb of each internal capsule was warped to the patients’ images. The microstructural characteristics of the internal capsules were quantified by calculating an asymmetry index from the mean fractional anisotropy values: PLIC FAAI = (FAcontralesional – FAipsilesional)/(FAcontralesional + FAipsilesional).17
Two more biomarkers that could be calculated from T1‐weighted images were developed in this study. These were stroke lesion load on the ipsilesional corticospinal tract and sensorimotor tracts. In preparation, template tracts were constructed using probabilistic fiber tracking in the contralesional hemispheres of 85 patients. Diffusion‐weighted images were preprocessed with motion and eddy current correction, skull stripping, estimation and fitting of diffusion parameters, and modeling of crossing fibers.18 Seed masks were placed at the pyramid and the primary motor cortex (M1), with a way point at the posterior limb of the internal capsule, for the corticospinal tract template. Seed masks were placed at the medial lemniscus near the inferior border of the pons and the primary somatosensory cortex (S1), with a way point at the ventral nuclei of the thalamus, for the sensory tract template. Tractography was conducted with a curvature threshold of 0.2 and step‐length of 0.5. Tracts were then nonlinearly transformed to MNI space and mirrored along the mid‐sagittal axis as required so that all tracts were in the left hemisphere. Tracts from all participants were then combined and thresholded at 75% probability to ensure that only fibers at each tract's core were used for subsequent analyses. Two template tracts were generated; an M1 corticospinal tract, and a sensorimotor tract formed by combining the S1 sensory tract with the M1 corticospinal tract. The template corticospinal and sensorimotor tracts were then nonlinearly registered to each patient's T1‐weighted image. A stroke lesion mask was hand‐drawn on each patient's T1‐weighted image and the percentage of tract voxels that overlapped the stroke lesion was calculated.16, 19
Analysis
A hypothesis‐free cluster analysis of ARAT scores at 3 months poststroke was carried out, to re‐evaluate the boundaries between the four outcome categories of Excellent, Good, Limited, and Poor upper limb outcome. These category labels replace the previous labels of Complete, Notable, Limited, and None.15 Each patient was categorized into one of the four outcomes according to their ARAT score at 3 months.
A classification and regression tree (CART) analysis was carried out with IBM SPSS (version 24) to determine which factors best predict outcome category. CART analysis produces a decision tree without the user determining which variables to include, or their order, in the tree. This approach substantially differed from that used in the development of the PREP algorithm, and means that there were no a priori assumptions made about the likely sequence or type of predictors that were included in the resulting decision tree. The demographic and clinical variables available to the CART analysis were sex, age binarized at 80 years (<80, ≥80), hemisphere affected (left, right), hand affected (dominant, nondominant), stroke classification (lacunar infarct, partial anterior circulation infarct, total anterior circulation infarct, posterior circulation infarct, intracerebral hemorrhage), intravenous thrombolysis (yes, no), previous stroke (yes, no), SAFE score, stroke severity (NIHSS score), upper limb impairment (UE‐FM score), and upper limb therapy dose (minutes). The biomarkers were MEP status (MEP+, MEP−), PLIC FAAI, corticospinal tract lesion load (%), and sensorimotor tract lesion load (%). While therapy dose is not known at the beginning of rehabilitation, and therefore is not a predictor per se, it was included in the analysis as a potential modifier of outcome.
The CART analysis had a maximum tree depth of 3, minimum terminal node size of 10 cases, and automated pruning to avoid over‐fitting with a maximum difference in risk of 1 standard error. “Gini” was used to optimize homogeneity within terminal nodes. Alternative CART analyses were carried out by removing either TMS or MRI data, or both. The results of the CART analyses were reformatted and combined to produce the PREP2 algorithm.
Results
Cluster analysis
As in previous studies, the cluster analysis identified four nonoverlapping outcome categories (Table 2). The cluster boundaries were similar to those found previously15 with the lower boundary for Good dropping from 39 to 34 points.
Table 2.
ARAT scores for functional outcome categories 3 months poststroke
| Outcome | Mean | Median | Minimum | Maximum | N |
|---|---|---|---|---|---|
| Excellent | 56 | 57 | 50 | 57 | 113 |
| Good | 43 | 42 | 34 | 48 | 55 |
| Limited | 22 | 22 | 13 | 31 | 16 |
| Poor | 2 | 3 | 0 | 9 | 23 |
CART analysis
The CART analysis produced a decision tree with MEP status as the first decision point, followed by sensorimotor tract and corticospinal tract lesion load, and then NIHSS and SAFE score, with an overall prediction accuracy of 73%. However, using TMS with every patient is impractical, and unnecessary as all patients with a SAFE score of 5 or more were MEP+ (n = 141, 68%). Therefore, we first binarized the group according to SAFE score (SAFE < 5, SAFE ≥ 5), and performed separate CART analyses for each category.
For patients with a SAFE score of 5 or more, the overall prediction accuracy was 78% (Fig. 1, Table 3). If patients were less than 80 years of age they were most likely to have an Excellent upper limb outcome. If they were 80 years old or more, and their UE‐FM score was less than 48 points, they were likely to have a Good outcome; otherwise they were likely to have an Excellent outcome. If UE‐FM scores were removed, the CART analysis predicted that patients aged at least 80 years were likely to have a Good outcome if their SAFE score was 5, 6, or 7, and an Excellent outcome if their SAFE score was 8 or more. Given that prediction accuracy was similar (79% for UE‐FM and 78% for SAFE), and the SAFE score is quicker and easier to obtain, we elected to retain the SAFE score in the algorithm.
Figure 1.
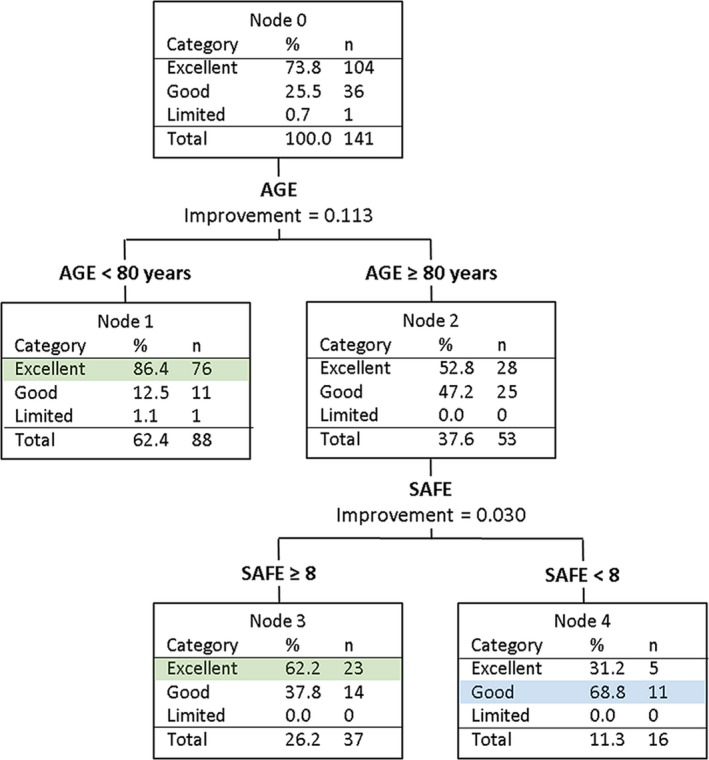
CART analysis for patients with a SAFE score ≥ 5 within 72 h poststroke. All of these patients are MEP+.
Table 3.
PREP2 algorithm accuracy, positive and negative predictive values
| PPV (95% CI) | NPV (95% CI) | Accuracy for SAFE ≥ 5 | Accuracy for SAFE < 5 | |
|---|---|---|---|---|
| PREP2: Overall accuracy 75% | ||||
| Excellent N = 113 | 79% (73–84%) | 83% (75–89%) | 78% | 70% |
| Good N = 55 | 58% (46–68%) | 84% (79–88%) | ||
| Limited N = 16 | 86% (44–98%) | 95% (93–97%) | ||
| Poor N = 23 | 91% (73–98%) | 99% (96–100%) | ||
| With MRI: Overall accuracy 75% | ||||
| Excellent N = 113 | 79% (73–84%) | 83% (75–89%) | 78% | 70% |
| Good N = 55 | 58% (46–68%) | 84% (79–88%) | ||
| Limited N = 16 | 73% (46–89%) | 100% (97–100%) | ||
| Poor N = 23 | 100% | 92% (82–96%) | ||
| With no TMS, and no TMS or MRI: Overall accuracy 71% | ||||
| Excellent N = 113 | 79% (73–84%) | 83% (75–89%) | 78% | 55% |
| Good N = 55 | 53% (41–64%) | 82% (77–85%) | ||
| Limited N = 16 | No predictions | 92% | ||
| Poor N = 23 | 64% (50–75%) | 99% (96–100%) | ||
For patients with a SAFE score less than 5, the overall prediction accuracy was 70% (Fig. 2A, Table 3). Given the smaller number of patients in this analysis (n = 66) the minimum terminal node size was reduced from 10 to 5 cases. The CART analysis found that if patients were MEP+ they were most likely to have a Good outcome. If patients were MEP− and had a sensorimotor tract lesion load of 15% or less they were most likely to have a Limited outcome. If patients were MEP− with a sensorimotor tract lesion load more than 15% they had a Poor outcome. The accuracy of predictions for MEP− patients was 90%. Note that fractional anisotropy asymmetry indices for the posterior limbs of the internal capsules, as well as lesion load on the corticospinal and sensorimotor tracts, were all entered into the CART analysis. Only sensorimotor tract lesion load was selected by the CART analysis, indicating that it was a better predictor than the other MRI biomarkers.
Figure 2.
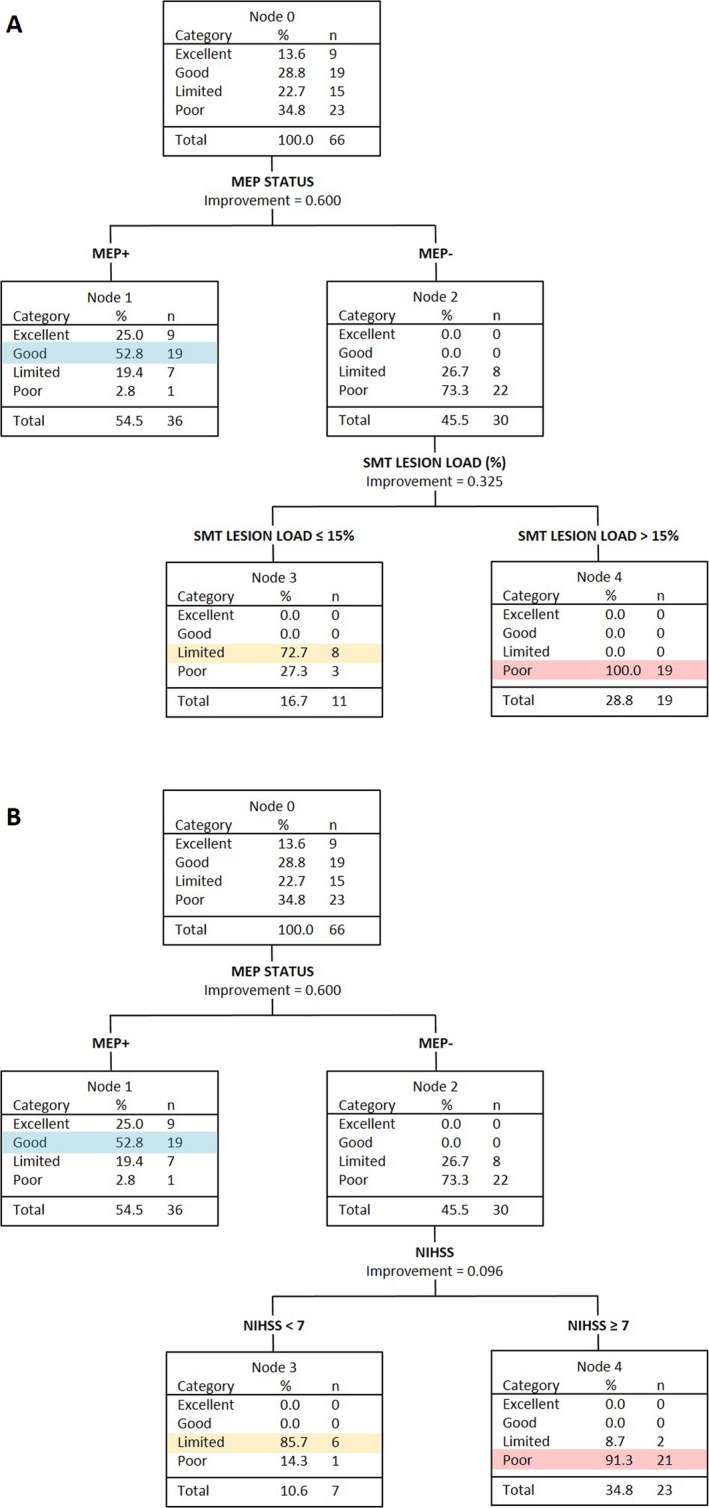
CART analyses of patients with a SAFE score < 5 at 72 h poststroke. (A) Both TMS and MRI biomarkers available. The analysis selects sensorimotor tract (SMT) lesion load to differentiate between MEP− patients who will have a Limited versus Poor upper limb outcome. (B) TMS but no MRI biomarkers available. The analysis selects NIHSS score to differentiate between MEP− patients who will have a Limited versus Poor upper limb outcome.
Alternative CART analyses were also carried out for patients with a SAFE score less than 5. If MRI biomarkers were removed, the CART analysis selected NIHSS score to predict outcome for MEP− patients (Fig. 2B). Patients who were MEP− were most likely to have a Limited outcome if their NIHSS score was less than 7, and a Poor outcome if their NIHSS score was 7 or more. The accuracy of predictions for MEP− patients was the same as when MRI biomarkers were available (90%). The overall accuracy of predictions for patients with a SAFE score less than 5 was also the same as when MRI biomarkers were available (70%), but with different positive and negative predictive values (Table 3).
If MEP status was removed, the CART analysis selected NIHSS score to predict outcome for patients with a SAFE score less than 5. Patients with an NIHSS score less than 9 were most likely to have a Good outcome, while those with an NIHSS score of 10 or more were most likely to have a Poor outcome. However, prediction accuracy dropped to 55% (Table 3). MRI biomarkers were available but not selected as predictors by the CART analysis because large overlaps in values meant they could not be used as surrogates for MEP status. The fractional anisotropy asymmetry index for the posterior limbs of the internal capsules ranged from −0.04 to 0.53 for MEP+ patients and from −0.09 to 0.55 for MEP− patients. Corticospinal tract lesion load ranged from 0.4% to 51.1% for MEP+ patients and from 2.1% to 51.7% for MEP− patients. Sensorimotor tract lesion load ranged from 0.2% to 43.5% for MEP+ patients and from 2.0% to 39.6% for MEP− patients. This indicates that these MRI biomarkers do not distinguish between MEP+ and MEP− patients.
If both TMS and MRI biomarkers were removed, the CART analysis again used NIHSS score to predict outcome for patients with a SAFE score less than 5. This produced the same decision tree as when TMS was removed.
The potential predictors that the CART analyses did not select were sex, hemisphere affected, hand affected, stroke classification, intravenous thrombolysis, and previous stroke. Upper limb outcome was not predicted by these factors, nor was it modified by upper limb therapy dose.
An algorithm for clinical use
The decision trees produced by the CART analyses were reformatted into a new algorithm (PREP2) suitable for use by clinicians, in order to make predictions for individual patients (Fig. 3). The new algorithm does not include MRI biomarkers, because the decision trees produced with and without MRI biomarker information had equivalent prediction accuracy (Table 3), and the NIHSS score at 3 days poststroke is more accessible than an MRI biomarker. The information that could be offered to patients in each predicted outcome category is provided in Table 4.
Figure 3.
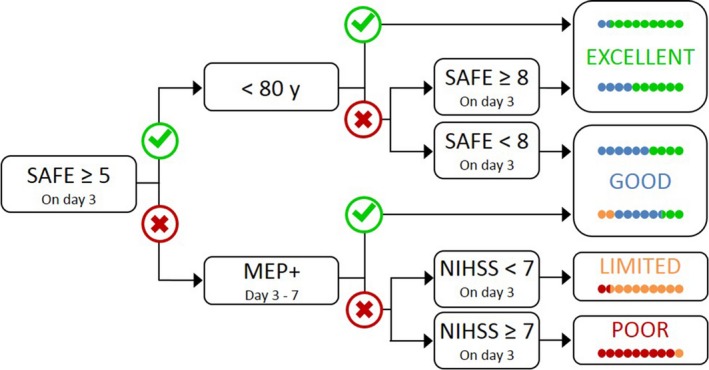
The PREP2 algorithm predicts upper limb functional outcome at 3 months poststroke. The four possible upper limb outcomes are color‐coded. The colored dots depict the proportion of patients expected to achieve each color‐coded outcome, depending on their pathway through the algorithm, based on the results of the CART analysis. Patients who achieve a SAFE score of five or more within 72 h of stroke symptom onset, and are less than 80 years old, are most likely to have an Excellent upper limb outcome. Patients who achieve a SAFE score of five or more within 72 h of stroke symptom onset and are 80 years old or more, are most likely to have an Excellent upper limb outcome provided their SAFE score is at least 8; otherwise they are likely to have a Good upper limb outcome. Patients whose SAFE score is less than 5 at 72 h after stroke symptom onset need TMS to determine MEP status in the paretic upper limb, a key biomarker of corticospinal tract integrity. If a MEP can be elicited (MEP+) approximately 5 days poststroke then the patient is likely to have at least a Good upper limb outcome. If a MEP cannot be elicited, the NIHSS score obtained 3 days poststroke can be used to predict either a Limited outcome if the score is less than 7, or a Poor outcome if the score is 7 or more.
Table 4.
Algorithm predictions
| Predicted outcome | Description | Rehabilitation focus |
|---|---|---|
| Excellent | Potential to make a complete, or near‐complete, recovery of hand and arm function within 3 months | Promote normal use of the affected hand and arm with task‐specific practice, while minimizing adaptation and compensation. |
| Good | Potential to be using the affected hand and arm for most activities of daily living within 3 months, though with some weakness, slowness, or clumsiness | Promote normal function of the affected hand and arm by improving strength, coordination, and fine motor control with repetitive and task‐specific practice. Minimize compensation with the other hand and arm, and the trunk. |
| Limited | Potential to regain movement in the affected hand and arm within 3 months, but daily activities are likely to require significant modification | Promote movement and reduce impairment by improving strengthand active range of motion. Promote adaptation in daily activities, incorporating the affected upper limb wherever safely possible. |
| Poor | Unlikely to regain useful movement of the hand and arm within 3 months | Prevent secondary complications such as pain, spasticity, and shoulder instability. Reduce disability by learning to complete daily activities with the stronger hand and arm. |
Note that the outcome category names replace those used in the original PREP algorithm (Complete, Notable, Limited, None).
Overall, the new algorithm correctly predicted upper limb outcome for 156 of 207 patients (75%). Of the remaining 51 patients, the algorithm was too optimistic for 35 (69%) and too pessimistic for 16 (31%). See Table 3 for positive and negative predictive values for each outcome. Most of the patients for whom the algorithm was too optimistic were predicted to have an Excellent outcome, but had a Good (n = 25) or Limited (n = 1) outcome instead. Most of the patients for whom the algorithm was too pessimistic were predicted to have a Good outcome, but had an Excellent outcome instead (n = 14). This contributed to the relatively low positive predictive value for the Good outcome category.
The new PREP2 algorithm correctly predicted the actual (rather than minimum) level of function at 3 months for 156 of 207 patients (75%), and is more accurate than the PREP algorithm which could predict actual level of function for 132 of these patients (64%). PREP2 required TMS for 66 of 207 patients (32%) in this sample, which is more efficient than the PREP algorithm that would have required TMS for 116 of these patients (56%). The new PREP2 algorithm eliminated the need for MRI for the 30 of 207 patients (15%) who were MEP−, because NIHSS score 3 days poststroke could be used with equivalent accuracy.
Discussion
PREP2 is an efficient, accessible, and accurate algorithm that may be useful in clinical practice. If a patient achieves a SAFE score of 5 or more within 72 h poststroke, knowing their age allows prediction of a Good or Excellent upper limb outcome. If the SAFE score is less than 5 at 72 h poststroke, the NIHSS score can be obtained at this time and a TMS assessment scheduled within the next 3 days. These measures allow prediction of a Good, Limited, or Poor outcome. While further work is needed to potentially incorporate sensory and cognitive factors that may affect upper limb outcomes, the PREP2 algorithm highlights the value of sequentially combining clinical predictors and a key biomarker of corticospinal tract integrity, MEP status, for predicting upper limb function after stroke.
This study addresses some of the limitations of previous work. Efficiency was improved by the finding that patients with a SAFE score of 5 or more are MEP+ so that TMS is only required for a third of patients using PREP2, instead of more than half if using the PREP algorithm. Accessibility was improved by removing the need for MRI scans. Provided MEP status information is available, the NIHSS score can be used with equivalent prediction accuracy. Despite these simplifications, accuracy increased with PREP2 correctly predicting the actual upper limb functional outcome for 75% of patients, which is an improvement on the 64% accuracy of PREP. Predictions were too optimistic for most of the remaining 25% of patients. Erring on the side of optimism is preferable to the alternative, to avoid reducing patient and therapist motivation. These improvements in efficiency, accessibility, and accuracy may support the testing and further validation of PREP2 in a variety of clinical settings.
The simple bedside assessment of shoulder abduction and finger extension strength (SAFE score), combined with the patient's age, discriminated with 78% accuracy between patients who had Excellent or Good upper limb function 3 months poststroke. This 2‐min assessment is all that was needed to provide a prediction for 68% of patients, indicating that accurate predictions can be easily made for most patients. Age binarized at 80 years is a new predictor identified by the CART analysis. The finding that patients aged 80 years or more needed to be less impaired (SAFE score ≥ 8) in order to achieve the same functional outcome as their younger counterparts is in keeping with previous reports that age is an independent predictor of stroke outcome.2, 20 TMS is only required for patients with a SAFE score less than 5. MEP+ patients are most likely to have Good upper limb function 3 months poststroke. An MEP− patient will have Limited or Poor upper limb function 3 months poststroke, and NIHSS score can be used to discriminate between these two possibilities.
The accuracy of predictions based on clinical assessment alone was 78% for patients with a SAFE score of 5 or more, but only 55% for patients with a SAFE score less than 5. Without MEP status, the CART analysis did not select any of the MRI biomarkers employed here, and instead selected NIHSS score to predict either a Good or Poor outcome. However, the accuracy of these predictions was only marginally better than chance (55%, Table 3). The addition of TMS biomarker information increased prediction accuracy to 70% for these patients, underlining the value of testing corticospinal tract function in patients with more severe motor impairment.21, 22 While PREP2 requires TMS for a smaller proportion of patients, this does not eliminate barriers to using this technique in a clinical setting. The major barrier is the cost of the TMS equipment but this might be offset by a reduced average length of stay when algorithm predictions are used in clinical practice.5 MEP status is a simple TMS measure, which can be obtained in approximately 20 min.5 Few patients (2%) have contraindications to TMS such as a history of epilepsy.5 Future studies could explore the possibility of replacing TMS with SAFE scores obtained at later time points, as per previous work.23
The positive and negative predictive values for PREP2 ranged between 83% and 99%, with the exception of the positive predictive value for the Good category which was only 58%. This was partly because 27% of patients predicted to have a Good outcome exceeded this expectation and had an Excellent outcome. In clinical practice, this might mean that patients in this category could be informed that they are likely to have a Good upper limb outcome, and there is a one in four chance it could be Excellent. Predicting that patients will achieve at least a Good upper limb outcome increases the positive predictive value for this category from 58% (95% CI: 46–68%) to 85% (95% CI: 73–92%), which is similar to the positive predictive values for the other outcome categories. For MEP− patients, NIHSS score and sensorimotor tract lesion load produced predictions with equivalent accuracy (90%). However, the positive predictive value was higher for the Limited category when NIHSS score was used, and higher for the Poor category when sensorimotor tract lesion load was used. In clinical practice, certainty of a Poor prognosis could be maximized using sensorimotor tract lesion load rather than NIHSS score for MEP− patients.
Previous studies have used clinical measures alone to predict upper limb outcomes.2, 3, 4 One study found that patients at 48 h poststroke with a Fugl‐Meyer scale score of at least 1 point for paretic finger extension, and a Motricity Index score of at least 9 points for shoulder abduction, had a 98% probability of having “manual dexterity” 6 months poststroke, defined as an ARAT score of at least 10 points.23 If both scores were below these cut‐offs, the probability was only 25%. Another study used two items from the ARAT to predict whether patients would have a Fugl‐Meyer scale score of at least 32 points at 12 months poststroke, as this was the minimum required to perform a drinking task with the paretic upper limb.24 Patients at 3 days poststroke whose combined score on the “pour water from glass to glass” and “place hand on top of head” items of the ARAT was at least 2 points (out of 6) were predicted to achieve a Fugl‐Meyer score of at least 32 points by 12 months poststroke, with 81% accuracy.24 While the predictions made by these studies are accurate, they are for dichotomized outcomes that are not particularly useful. ARAT scores between 10 and 57 points23 embrace such a wide range of functional outcomes that making this prediction provides very little guidance for patients or therapists. Predicting whether a patient will be able to perform a single drinking task or not, based on their expected Fugl‐Meyer score,24 is also not particularly informative when planning rehabilitation. Neither of these predictive models has yet been validated in independent cohorts, and the effects of using them in clinical practice are yet to be explored.
In contrast, PREP2 predicts one of four functionally meaningful upper limb outcomes. The sequential nature of the algorithm means that predictions can be made for 68% of patients using only SAFE score and age, with 78% accuracy. TMS is only needed for patients who have a SAFE score less than 5, and is essential for identifying which of these patients are MEP+ and have the potential for a Good outcome. When PREP predictions are available, therapists are more confident they know what to expect for the patient's recovery and modify their therapy content according to the suggested rehabilitation goals, and patients experience a shorter length of stay with no detrimental effects on outcomes or satisfaction.5
One of the limitations of this study is the small number of MEP− patients relative to MEP+. Further work could usefully explore other neuroimaging biomarkers that might provide important prognostic information for MEP− patients. These may involve measures of alternative descending motor pathways,25, 26, 27, 28 and of the wider ipsilesional and contralesional sensorimotor networks, including the corpus callosum.29, 30, 31, 32, 33 However, more sophisticated measures may also require expertise not readily available in most clinical settings. Patients with previous stroke or intracerebral hemorrhage were also relatively under‐represented in this study. Other possible predictors of upper limb outcome also need to be explored, such as impaired upper limb somatosensation, vision, visuospatial attention, and cognition.3, 34, 35 It is possible that PREP2 predictions, which are based on motor system measures, are less likely to be achieved when the patient's motor performance is also affected by deficits in sensory and cognitive domains.
PREP2 could be used for selection and stratification of patients for upper limb rehabilitation trials initiated early after stroke. Matching treatment and control groups on baseline clinical measures alone runs the risk of the groups being mismatched in terms of likely outcomes, particularly when patients with moderate to severe initial impairment are included. Being able to match treatment and control groups for their expected outcome may reduce noise and increase the trial's sensitivity to treatment effects.
PREP2 is an efficient, accessible, and accurate algorithm that could be useful in clinical practice. Its predecessor has been validated and found to increase rehabilitation efficiency.5 This needs to be confirmed for PREP2, preferably in the context of a multi‐site study with a larger sample of patients being rehabilitated in a variety of clinical settings.
Author Contributions
CMS: Conception and design of the study; acquisition and analysis of data; drafting of the manuscript. WDB: Conception and design of the study; drafting of the manuscript. SJA: Acquisition of data. MCS: Acquisition and analysis of data; drafting of the manuscript. VMB: Analysis of data. PAB: Drafting of the manuscript.
Conflicts of Interest
None.
Acknowledgments
The authors thank Anna McRae and Rhema Vaithianathan. This work was funded by the Health Research Council of New Zealand (09/164, 11/270, 14/136).
Funding Statement
This work was funded by Health Research Council of New Zealand grant 09/164, 11/270, 14/136.
References
- 1. Langhorne P, Coupar F, Pollock A. Motor recovery after stroke: a systematic review. Lancet Neurol 2009;8:741–754. [DOI] [PubMed] [Google Scholar]
- 2. Veerbeek JM, Kwakkel G, van Wegen EE, et al. Early prediction of outcome of activities of daily living after stroke: a systematic review. Stroke 2011;42:1482–1488. [DOI] [PubMed] [Google Scholar]
- 3. Coupar F, Pollock A, Rowe P, et al. Predictors of upper limb recovery after stroke: a systematic review and meta‐analysis. Clin Rehabil 2012;26:291–313. [DOI] [PubMed] [Google Scholar]
- 4. Nijland RH, van Wegen EE, Harmeling‐van der Wel BC, et al. Accuracy of physical therapists’ early predictions of upper‐limb function in hospital stroke units: the EPOS study. Phys Ther 2013;93:460–469. [DOI] [PubMed] [Google Scholar]
- 5. Stinear CM, Byblow WD, Ackerley SJ, et al. Predicting recovery potential for individual stroke patients increases rehabilitation efficiency. Stroke 2017;48:1011–1019. [DOI] [PubMed] [Google Scholar]
- 6. Kim B, Winstein C. Can neurological biomarkers of brain impairment be used to predict poststroke motor recovery? A systematic review Neurorehabil Neural Repair 2016;31:3–24. [DOI] [PubMed] [Google Scholar]
- 7. Burke E, Cramer SC. Biomarkers and predictors of restorative therapy effects after stroke. Curr Neurol Neurosci Rep 2013;13:329. [DOI] [PMC free article] [PubMed] [Google Scholar]
- 8. Byblow WD, Stinear CM, Barber PA, et al. Proportional recovery after stroke depends on corticomotor integrity. Ann Neurol 2015;78:848–859. [DOI] [PubMed] [Google Scholar]
- 9. Bembenek JP, Kurczych K, Karli Nski M, et al. The prognostic value of motor‐evoked potentials in motor recovery and functional outcome after stroke ‐ a systematic review of the literature. Funct Neurol 2012;27:79–84. [PMC free article] [PubMed] [Google Scholar]
- 10. Puig J, Blasco G, Schlaug G, et al. Diffusion tensor imaging as a prognostic biomarker for motor recovery and rehabilitation after stroke. Neuroradiology 2017;59:343–351. [DOI] [PubMed] [Google Scholar]
- 11. Feng W, Wang J, Chhatbar PY, et al. Corticospinal tract lesion load: an imaging biomarker for stroke motor outcomes. Ann Neurol 2015;78:860–870. [DOI] [PMC free article] [PubMed] [Google Scholar]
- 12. Buch ER, Rizk S, Nicolo P, et al. Predicting motor improvement after stroke with clinical assessment and diffusion tensor imaging. Neurology 2016;86:1924–1925. [DOI] [PMC free article] [PubMed] [Google Scholar]
- 13. Puig J, Blasco G, Daunis IEJ, et al. Decreased corticospinal tract fractional anisotropy predicts long‐term motor outcome after stroke. Stroke 2013;44:2016–2018. [DOI] [PubMed] [Google Scholar]
- 14. Puig J, Pedraza S, Blasco G, et al. Acute damage to the posterior limb of the internal capsule on diffusion tensor tractography as an early imaging predictor of motor outcome after stroke. AJNR Am J Neuroradiol 2011;32:857–863. [DOI] [PMC free article] [PubMed] [Google Scholar]
- 15. Stinear CM, Barber PA, Petoe M, et al. The PREP algorithm predicts potential for upper limb recovery after stroke. Brain 2012;135(Pt 8):2527–2535. [DOI] [PubMed] [Google Scholar]
- 16. Riley JD, Le V, Der‐Yeghiaian L, et al. Anatomy of stroke injury predicts gains from therapy. Stroke 2011;42:421–426. [DOI] [PMC free article] [PubMed] [Google Scholar]
- 17. Petoe MA, Byblow WD, de Vries EJ, et al. A template‐based procedure for determining white matter integrity in the internal capsule early after stroke. Neuroimage Clin 2014;4:695–700. [DOI] [PMC free article] [PubMed] [Google Scholar]
- 18. Behrens TE, Johansen‐Berg H, Woolrich MW, et al. Non‐invasive mapping of connections between human thalamus and cortex using diffusion imaging. Nat Neurosci 2003;6:750–757. [DOI] [PubMed] [Google Scholar]
- 19. Burke E, Dodakian L, See J, et al. A multimodal approach to understanding motor impairment and disability after stroke. J Neurol 2014;261:1178–1186. [DOI] [PubMed] [Google Scholar]
- 20. Nakayama H, Jorgensen HS, Raaschou HO, et al. The influence of age on stroke outcome. The Copenhagen Stroke Study. Stroke 1994;25:808–813. [DOI] [PubMed] [Google Scholar]
- 21. Chang MC, Do KH, Chun MH. Prediction of lower limb motor outcomes based on transcranial magnetic stimulation findings in patients with an infarct of the anterior cerebral artery. Somatosens Mot Res 2015;32:249–253. [DOI] [PubMed] [Google Scholar]
- 22. Pizzi A, Carrai R, Falsini C, et al. Prognostic value of motor evoked potentials in motor function recovery of upper limb after stroke. J Rehabil Med 2009;41:654–660. [DOI] [PubMed] [Google Scholar]
- 23. Nijland RH, van Wegen EE, Harmeling‐van der Wel BC, et al. Presence of finger extension and shoulder abduction within 72 hours after stroke predicts functional recovery: early prediction of functional outcome after stroke: the EPOS cohort study. Stroke 2010;41:745–750. [DOI] [PubMed] [Google Scholar]
- 24. Persson HC, Alt Murphy M, Danielsson A, et al. A cohort study investigating a simple, early assessment to predict upper extremity function after stroke ‐ a part of the SALGOT study. BMC Neurol 2015;15:92. [DOI] [PMC free article] [PubMed] [Google Scholar]
- 25. Lindenberg R, Renga V, Zhu LL, et al. Structural integrity of corticospinal motor fibers predicts motor impairment in chronic stroke. Neurology 2010;74:280–287. [DOI] [PMC free article] [PubMed] [Google Scholar]
- 26. Takenobu Y, Hayashi T, Moriwaki H, et al. Motor recovery and microstructural change in rubro‐spinal tract in subcortical stroke. Neuroimage Clin 2014;4:201–208. [DOI] [PMC free article] [PubMed] [Google Scholar]
- 27. Phan TG, van der Voort S, Chen J, et al. Impact of corticofugal fibre involvement in subcortical stroke. BMJ Open 2013;3:e003318. [DOI] [PMC free article] [PubMed] [Google Scholar]
- 28. Archer DB, Vaillancourt DE, Coombes SA. A template and probabilistic atlas of the human sensorimotor tracts using diffusion MRI. Cereb Cortex 2017;. https://doi.org/10.1093/cercor/bhx066. [DOI] [PMC free article] [PubMed] [Google Scholar]
- 29. Park CH, Kou N, Ward NS. The contribution of lesion location to upper limb deficit after stroke. J Neurol Neurosurg Psychiatry 2016;87:1283–1286. [DOI] [PMC free article] [PubMed] [Google Scholar]
- 30. Koch P, Schulz R, Hummel FC. Structural connectivity analyses in motor recovery research after stroke. Ann Clin Transl Neurol 2016;3:233–244. [DOI] [PMC free article] [PubMed] [Google Scholar]
- 31. Granziera C, Daducci A, Meskaldji DE, et al. A new early and automated MRI‐based predictor of motor improvement after stroke. Neurology 2012;79:39–46. [DOI] [PubMed] [Google Scholar]
- 32. Grefkes C, Ward NS. Cortical reorganization after stroke: how much and how functional? Neuroscientist 2014;20:56–70. [DOI] [PubMed] [Google Scholar]
- 33. Stewart JC, Dewanjee P, Tran G, et al. Role of corpus callosum integrity in arm function differs based on motor severity after stroke. Neuroimage Clin 2017;14:641–647. [DOI] [PMC free article] [PubMed] [Google Scholar]
- 34. Meyer S, De Bruyn N, Lafosse C, et al. Somatosensory impairments in the upper limb poststroke: distribution and association with motor function and visuospatial neglect. Neurorehabil Neural Repair 2016;30:731–742. [DOI] [PubMed] [Google Scholar]
- 35. Meyer S, Karttunen AH, Thijs V, et al. How do somatosensory deficits in the arm and hand relate to upper limb impairment, activity, and participation problems after stroke? A systematic review Phys Ther 2014;94:1220–1231. [DOI] [PubMed] [Google Scholar]