Abstract
To investigate the diurnal variation of the pulse waveform parameters determined by laser speckle flowgraphy (LSFG) on the optic nerve head (ONH) in healthy subjects.
This prospective cross sectional study was conducted at Nagoya University Hospital. We studied 13 healthy volunteers whose mean age was 33.5 ± 7.6 years. Eight pulse waveform parameters on the ONH were determined by LSFG (LSFG-NAVI) every 3 hours from 6 am to 12 pm. The intraocular pressure (IOP), systolic (SBP) and diastolic (DBP) blood pressure, and heart rate (HR) in the brachial artery were also recorded. We evaluated the diurnal variations of the parameters and compared the pulse waveform parameters to the other parameters using a linear mixed model.
Of the 8 parameters, skew (P < .001), blow out score (BOS, P < .001), blow out time (BOT, P = .028), rising rate (P < .001), falling rate (P < .001), resistivity index (P < .001) had a significant diurnal fluctuation. In addition, IOP (P < .001), SBP (P = .005), DBP (P = .001), and HR (P < .001) had significant diurnal fluctuations. The BOS and resistivity index were significantly correlated with the HR (P = .009, P = .012, respectively), and the BOT were significantly correlated with the DBP and mean ocular perfusion pressure (P = .042, P = .041, respectively).
We found that there was significant diurnal variation in 6 waveform parameters on the ONH in LSFG. We believe that our results highlighting diurnal variations in these waveform parameters need to be considered when interpreting pulse waveform parameter data and in understanding the precise underlying mechanism of ocular diseases such as diabetic retinopathy, retinal vein occlusion, and glaucoma.
Keywords: diurnal variation, healthy subjects, laser speckle flowgraphy, optic nerve head, pulse waveform
1. Introduction
Ocular blood flow has an essential role of supplying adequate amount of oxygen and nutrients to the eye.[1] Blood flow in the optic nerve head (ONH) has been reported to be impaired in some ocular diseases such as glaucoma[2] and retinitis pigmentosa.[3,4] Thus, the assessment of ocular blood flow is very important for further comprehension of the underlying pathology of ocular diseases.
Laser speckle flowgraphy (LSFG) has been developed to non-invasively and quickly evaluate the blood flow,[5–8] and it is a reliable and reproducible technique.[5–8] The mean blur rate (MBR) represents the relative blood flow velocity and is determined by the blurred speckle pattern produced by the interference of laser light by red blood cell movement through vessels.[7,8] MBR can be used to assess several diseases such as glaucoma,[9,10] retinal vein occlusion,[11,12] and diabetic macular edema.[11]
An update of the software embedded in the most recent LSFG analyzer (LSFG Analyzer, v. 3.1.6, Softcare Co., Ltd, Fukutsu, Japan) enables capturing of synchronized images from each cardiac cycle and derives various heartbeat waveform parameters. The MBR pulse waveform may be a new target biomarker for the detection and evaluation of vascular diseases in the retina. Several reports have described the relationship between these waveform parameters and other variables, for example, age,[13–16] mean intima-media thickness,[17] and normal-tension glaucoma.[13]
It is well established that diurnal variations are present in various anatomical and physiological parameters of the eye, for example, intraocular pressure (IOP),[18–21] corneal thickness,[22,23] corneal topography,[24] pupillary diameter, anterior chamber biometrics, and choroidal thickness.[25,26] In addition, several reports have described diurnal variations in ocular blood flow,[27,28] including those stating that MBR determined using LSFG showed a significant diurnal variation in healthy subjects, with a trough at 9 am and a peak at 12 pm on ONH.[29]
For precise evaluation of pulse waveform parameters, consideration of diurnal variation is warranted. However, to the best of our knowledge, there have been no reports to date that assess the diurnal variations in the pulse waveform parameters in LSFG.
Thus, the purpose of this study was to determine whether diurnal variation in these waveform parameters does exist and, if so, to investigate the correlation between diurnal variation of pulse waveform parameters and other ocular parameters.
2. Methods
2.1. Subjects and testing protocol
This is the prospective cross-sectional study which was performed at Nagoya University Hospital. The procedures in this study followed the tenets of the Declaration of Helsinki and were approved by the Ethics Committee of Nagoya University Hospital. All participants had received information about the purpose and possible side effects of the procedures and signed an informed consent form.
Twenty-six eyes of 13 healthy men volunteers with no ophthalmic or systemic diseases were studied. All subjects had a best-corrected visual acuity (BCVA) of ≥20/20 and were examined to determine if any ocular disease was present. Slit-lamp examinations and indirect ophthalmoscopy were used to examine the anterior and the posterior segments of the eyes. Subjects were also screened for any medical condition that could influence the hemodynamic of the eye such as diabetes, hypertension, arrhythmia, and vascular diseases. The exclusion criteria were presence of any ocular disease, history of intraocular surgery, presence of systemic disease requiring medical treatment affecting blood flow and smoking.
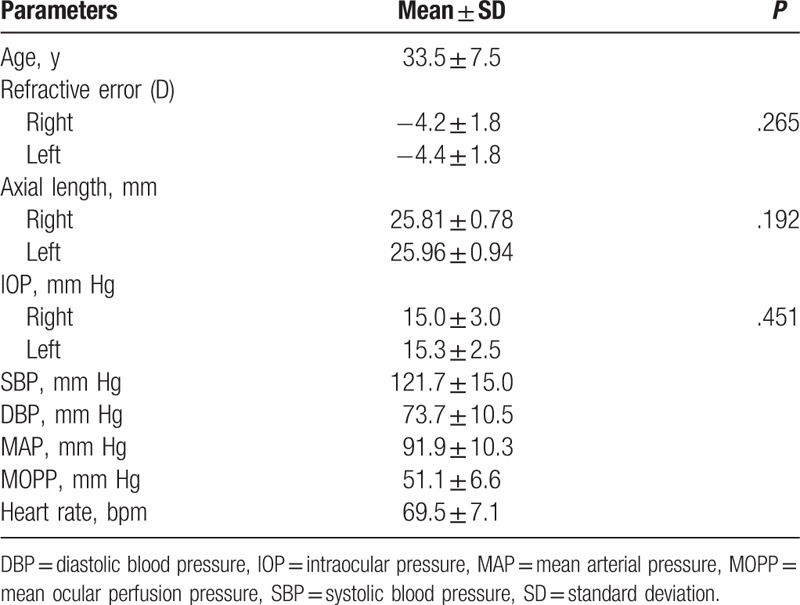
The 8 pulse waveform parameters determined by the LSFG-NAVI as below, IOP, systolic blood pressure (SBP), diastolic blood pressure (DBP), and heart rate (HR) were also measured every 3 hours from 6 am to 12 pm (Table 1). Because the intake of alcohol[30] and caffeine[31] can influence the IOP, all participants were asked to abstain from alcoholic and caffeinated beverages from the evening before and for the day of the study. Additionally, all participants were asked to abstain from consuming any food 2 hours before each experiment. All of the examinations were performed in the sitting position. Each subject rested for 10 to 15 minutes in a quiet room before the tests, and each experimental session was completed within 15 minutes.
Table 1.
Baseline characteristics of 13 healthy Japanese men.
2.2. Laser speckle flowgraphy
The principles of LSFG have been described in detail.[7] Briefly, LSFG is made of fundus camera with 830 nm wave length diode laser and the computer with measurement and analysis software. After switching on the laser, a speckle pattern appears due to the interference of the light scattered from the illuminated tissue. The MBR is a measure of the relative blood flow, and it is determined by examining the pattern of the speckle contrast produced by the interference of the laser light that is scattered by the movement of the blood cells in the ocular blood vessels. The MBR images are acquired at a rate of 30 frames/second over a 4-second period. The embedded analysis software then synchronizes all of the MBR images with each cardiac cycle, and the averaged MBR of a heartbeat is displayed as a heartbeat map.
The LSFG Analyzer software enables capturing of synchronized images from each cardiac cycle and derives various heartbeat waveform parameters (Fig. 1). The MBR for the overall area of the ONH was used for the pulse waveform analysis in this study. All currently available 8 pulse waveform parameters of LSFG were included in this study (Fig. 2). The calculation of pulse waveform parameters has been described in detail.[8]
Figure 1.
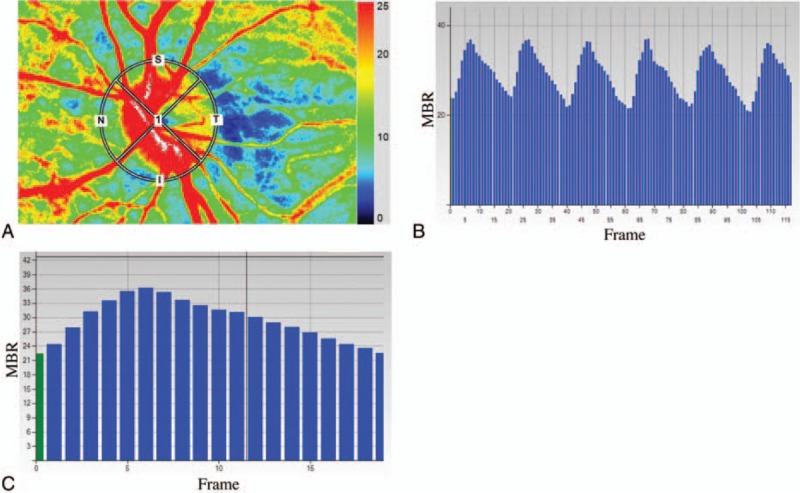
Analysis of the pulse waveform at the optic nerve head (ONH) using laser speckle flowgraphy (LSFG). Representative color coded composite map (A). By this circle rubber band at the ONH, the mean blur rate (MBR) and other waveform parameters can be measured (A). Pulse waves showing changes in the MBR, which is tuned to cardiac cycle for 4 seconds. The total number of frames is 118 in a scan (B). The change of the MBR in 1 heartbeat (C).
Figure 2.
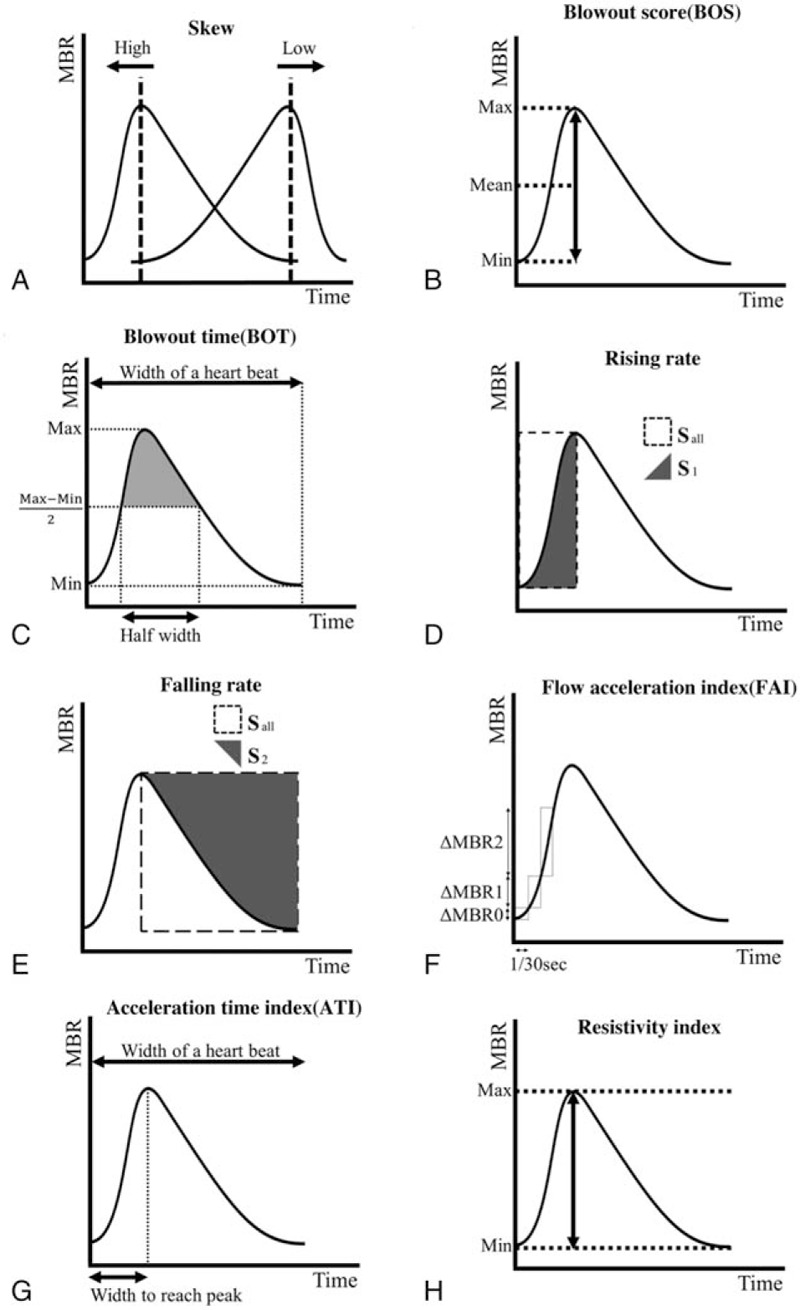
The pulse waveform analysis of 8 parameters. The skew represents the asymmetry of the waveform (A). If the shape of the waveform is symmetry the skew is 0 and if the peak comes faster than that, the skew increases and the peak slower, the skew decreases. The BOS indicates the amount of the blood flow volume in 1 heartbeat (width of a heartbeat) (B). The BOT represents the ratio of the half width in a heartbeat (C). The half width is the duration of the time that the MBR is higher than (MBRmax − MBRmin)/2. The RR is the proportion of the area of the S1 to the Sall (D). Sall is the square area before the peak and the S1 is the increasing area (D). The FR is the proportion of the area of the S2 to the Sall (E). Sall is the area of the square after the peak and the S2 is the decreasing area (E). The FAI is the maximum change of the increasing MBR in 1/30 seconds (F). The ATI is the ratio of the duration of the time to reach peak (width to reach peak) in 1 heartbeat (width of a heartbeat) (G). The RI is defined from dividing the difference of MBRmax and the MBRmin by the MBRmax (H).
The LSFG was measured 2 times at each time point in all of the eyes. The average of values was calculated for the analysis.
2.3. Other examinations
The refractive error was measured with an autorefractometer (KR8900; Topcon, Tokyo, Japan). The axial length was measured by partial optical coherence inferometry (IOLMaster; Carl Zeiss Meditec, La Jolla, CA). The IOP was measured with a handheld tonometer (Icare; TiolatOy, Helsinki, Finland). Additionally, the SBP, DBP, and HR were measured with an automatic sphygmomanometer (CH-483C; Citizen, Tokyo, Japan). The mean arterial pressure (MAP) and the mean ocular perfusion pressure (MOPP) were calculated as follow:
 |
 |
2.4. Statistical analysis
We evaluated the diurnal variations of parameters including the pulse waveforms using a linear mixed model to incorporate possible correlations between repeated measured values of the parameters for each eye over time and between those from the 2 eyes within a subject. That means that the statistics, linear mixed model, did not compare the values of parameters for each eye separately, and was able to evaluate the value of 1 eye to be interacted by the fellow eye over time and use the 2 eyes within a subject.
Specifically, we assumed the following model,
 |
i (subject) = 1, …, 13, j (eye) = 1,2, k (time) = 6, 9, 12, 15, 18, 21, 24 (hour) where yijk is the pulse waveforms value for side j of eye (1 = right, 2 = left) at time k on subject i. ai is a subject-specific random effect. The function f(t:β), which represents a fixed effect of time on the pulse waveforms on the ONH, was specified as a polynomial function: f(t:β) = β0 + β1t + β2t2 + … + βptp. The parameters γ and ξ represent fixed effects of the side of eye and a particular covariate Z, respectively. The order of polynomials in f(t:β) was selected based on the Akaike information criteria. For the residual term εijk on the pulse waveforms value, we assumed a compound symmetry correlation structure within each eye.
We calculated the coefficient, 95% confidence interval, and the P-value for the fixed effects. The level for statistical significance was .05. The statistical analyses were performed with SAS9.3 MIXED procedure (SAS, Inc., Cary, NC).
3. Results
3.1. Characteristics of the subjects
The characteristics of the subjects are shown in Table 1. Thirteen healthy Japanese men were included in the study. The mean age was 33.5 ± 7.6 years with a range of 28 to 47. The mean refractive error of the right eye was −4.2 ± 1.8 diopters (D) with a range of −0.5 to −6.25, and the left −4.4 ± 1.8D with a range of −1.0 to −6.5. The mean axial length of the right eye was 25.81 ± 0.78 mm with a range of 24.59 to 27.38, and the left 25.96 ± 0.94 with a range of 24.51 to 27.54. The baseline IOP of the right eye was 15 ± 3.0 mm Hg with a range of 8 to 19 and the left 15.3 ± 2.5 mm Hg with a range of 10 to 19. There are no significant differences in the refractive error, the axial length, and the baseline IOP between the both eyes. The baseline SBP, DBP and HR were 121.7 ± 15.0 mm Hg with a range of 92 to 148, 73.7 ± 10.5 mm Hg with a range of 56 to 93 and 69.5 ± 7.1 bpm with a range of 59 to 82, respectively.
3.2. Diurnal variations of pulse waveform parameters analysis
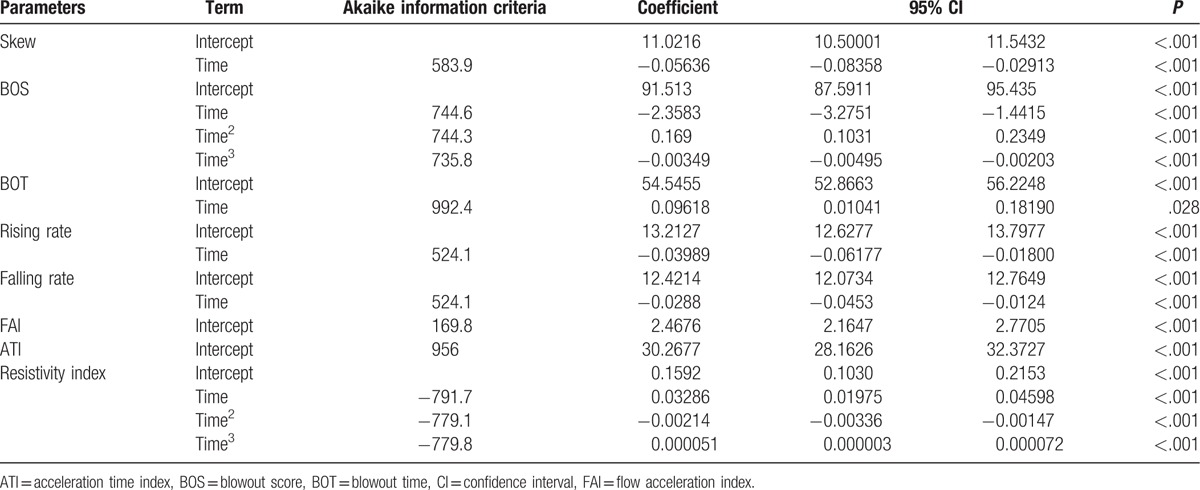
Diurnal change of 8 waveform parameters on the ONH are demonstrated in Fig. 3. Of the 8 pulse waveform parameters, skew (P < .001), blowout score (BOS) (P < .001), blowout time (BOT) (P = .028), rising rate (P < .001), falling rate (P < .001), resistivity index (P < .001) had a significant diurnal fluctuation. The diurnal variations in resistivity index and BOS can be best described by a cubic polynomial equation using linear mixed model (Table 2, Fig. 3). The BOS had the lowest at 9 am and increased during the day till the highest at 9 pm and the resistivity index had a peak at 9 am and decreased during the day till the nadir at 9 pm. The skew, the BOT, the rising rate, and the falling rate can be best described by a linear equation (Table 2, Fig. 3). The BOT decreased in the morning and increased in the evening, and the skew, the rising rate, and the falling rate increased in the morning and decreased gradually in the evening.
Figure 3.
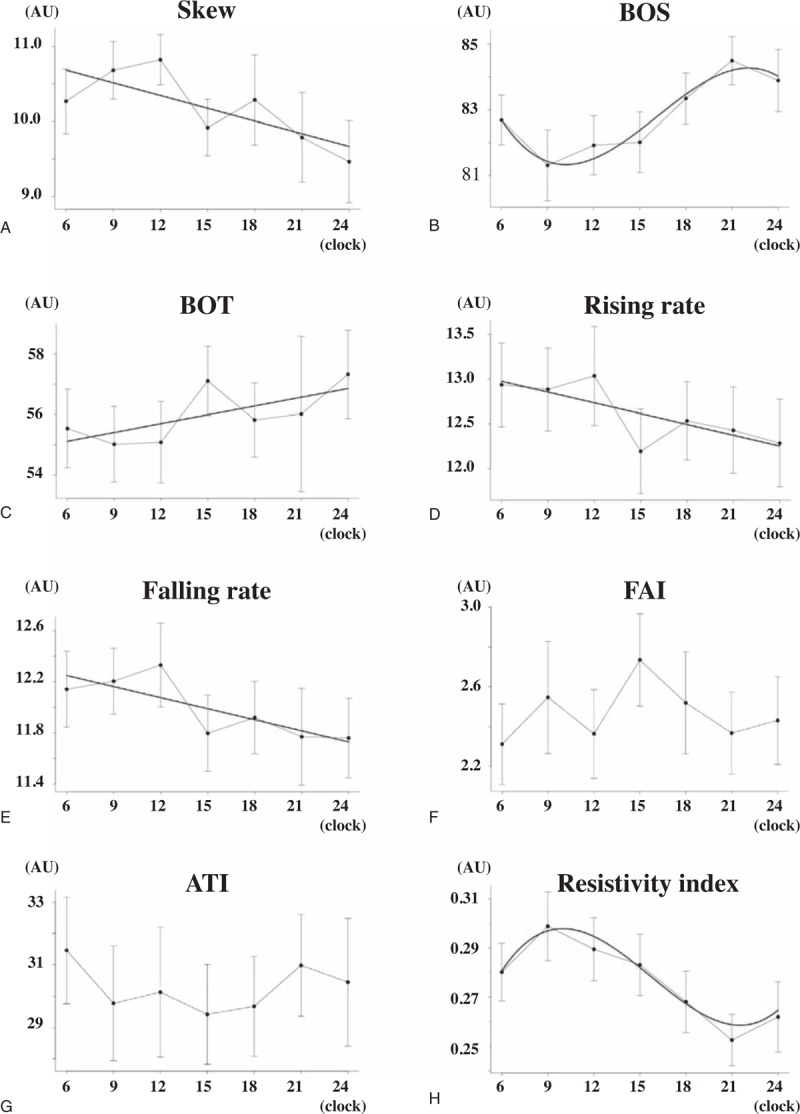
Diurnal variations of 8 waveform parameters in ONH are demonstrated. Of the 8 pulse waveform parameters, skew (P < .0001), BOS (P < .0001), BOT (P = .028), RR (P = .0004), FR (P = .0007), and RI (P < .0001) had a significant diurnal fluctuation. The red line in the graphs is the optimum curve. The graphs of BOS (B) and RI (H) can be described as cubic function. The RI had a peak at 9 am and decreased during the day till the nadir at 9 pm (H). While, the BOS had the lowest at 9 am and increased during the day till the highest at 9 pm (B). The BOT decreased in the daytime and increased in the nighttime (C). The skew (A), RR (D), and FR (E) increased in the morning and decreased gradually in the night. The graphs of these parameters are described as liner function (A, C, E, and F).
Table 2.
Polynomial regression analysis of the relation between pulse waveform parameters and time.
3.3. Diurnal variations of ocular and systemic factors
Figure 4 shows the changes of the ocular and systemic factors with time. The IOP (P < .001), SBP (P = .005), DBP (P = .001), and HR (P < .001) had significant diurnal fluctuations.
Figure 4.
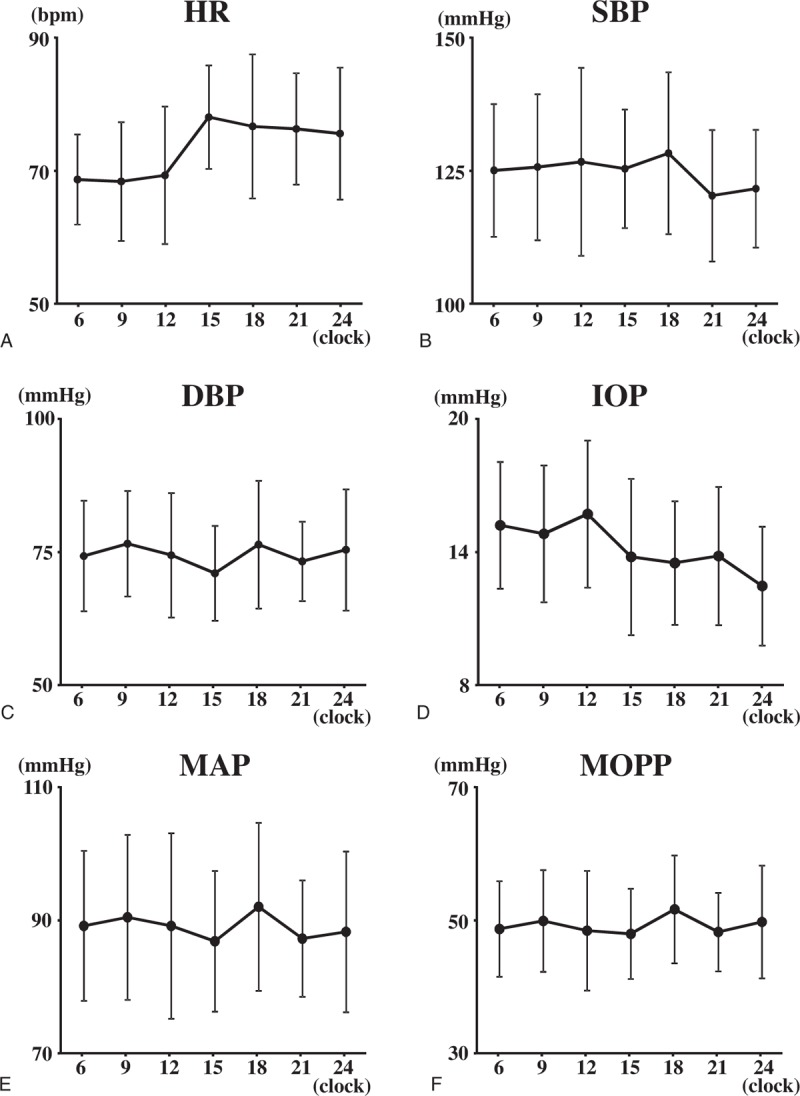
The changes of the ocular and systemic factors with time. HR (P < .001) (A), SBP (P = .005) (B), DBP (P = .001) (C) the IOP (P < .001) (D), the MAP (P < .001) (E), and the MOPP (P < .001) (F) had significant diurnal fluctuation.
3.4. Correlation of waveform parameters with other factors
The BOS and the resistivity index were significantly correlated with the HR respectively (P = .009, P = .012). The BOT was significantly correlated with the DBP and the MOPP (P = .042, P = .041, respectively).
4. Discussion
Our results obtained using a mixed linear model showed that 6 of 8 pulse waveform parameters exhibited significant diurnal variations, and the pattern of the diurnal fluctuation varied across the waveform parameters. It is best described by a cubic polynomial equation for the resistivity index and the BOS and a linear equation for the BOT, the skew, the rising rate, and the falling rate. In addition, IOP, SBP, DBP, and HR exhibited significant diurnal variations. The BOS and the resistivity index were significantly correlated with HR, and the BOT was correlated with DBP, MAP, and MOPP. Other pulse waveform parameters were not correlated with any parameters. To the best of our knowledge, this is the first study that measured the diurnal variations of pulse waveform parameters using LSFG.
Figure 5 shows representative MBR pulse waveforms on ONH in the morning (A) and night (B) and a comparison that highlights the changes that occurred over a heartbeat (C). The number of frames was higher in the morning than in the evening because HR was lower in the morning. In addition, observed MBR was higher throughout frames over a heartbeat in the evening than in the morning.
Figure 5.
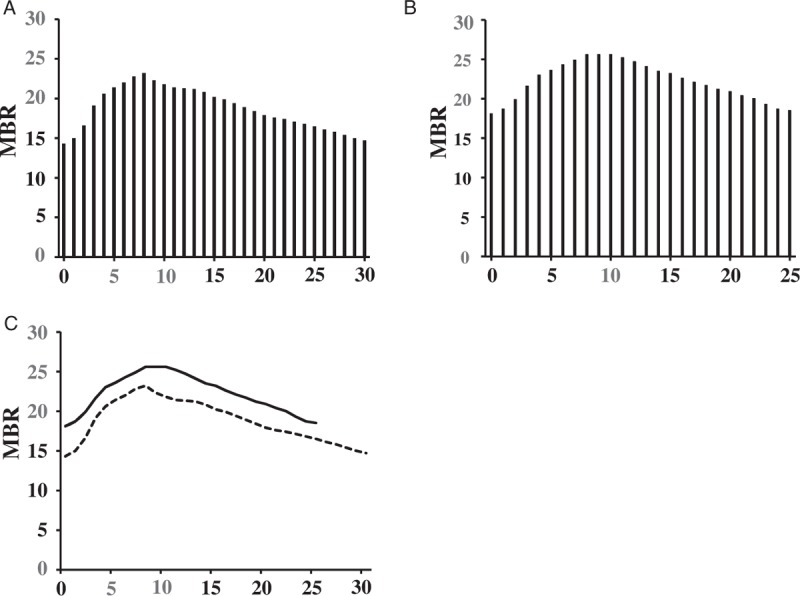
Representative MBR waveforms on the ONH in the morning (A) and night (B), and a comparison that highlighted the changes to it over a beat (C). The higher maximum, minimum and the mean MBRs were observed at nighttime than at daytime. The difference between the MBRmax and MBRmin was higher in the morning than at night. The peak is left forward at daytime and right forward at nighttime and the shape of the waveform is more asymmetry at night. The number of the frames was higher in the morning than at night.
There are several possible explanations for the diurnal variations in the pulse waveform parameters. First, HR exhibited a significant diurnal variation; in the present study, HR was low in the morning and high in the evening. This result corroborates with that of a previous study where HR was highest at 9 pm.[26] HR is strongly associated with the pulse waveforms determined using LSFG because of the frame number (30 frames/second in the present study), which reflects the duration of a heartbeat. Accordingly, the higher the HR, the shorter the duration of 1 heartbeat and the lower the number of frames per beat in LSFG. Moreover, we discovered that only the BOS and the resistivity index were significantly correlated with HR in the multiple regression analysis. Taken together, HR would affect the diurnal variations in the pulse waveforms determined using LSFG.
Second, it has been reported that sympathetic activity increases in the morning[32] and decreases during asleep.[30,33] Previous studies described a circadian rhythm in circulating epinephrine and norepinephrine considered to reflect the sympathetic activity,[33] which decreases at night.[30,33] As the sympathetic activity increases, it constricts blood vessels, and when it decreases, it dilates blood vessels.[31] Several studies have reported that peripheral vascular resistance is decreased at night.[34–36] Sindrup et al[36] described significant nocturnal variations associated with incremental decreases in peripheral blood flow and reduction of the vascular resistance in subcutaneous adipose tissue. Casiglia et al reported that the peripheral resistance values were the highest during the daytime and the lowest during the night in the leg[35] and forearm.[34] Panza et al[32] discovered that the vascular resistance had a significant circadian rhythm due to α-sympathetic activity with an associated increase during the morning. The nocturnal decreases in the peripheral vascular resistance could be caused by the decreased sympathetic activity at night. It is possible that one of the reasons for diurnal variations in pulse waveform parameters, including the resistivity index, an indicator of vascular resistance, is sympathetic activity.
Third, nitric oxide (NO) may be associated with the observed diurnal variations. NO can induce various biological responses such as vasodilation, increase in ocular blood flow, and reduction in IOP.[37] Perlman et al[37] reported that a significant circadian rhythm exists for NO and peaks at night. Elherik et al[38] found a borderline trend for a circadian variation in NO levels, with the peak occurring at 8 pm. Therefore, NO could also be a candidate contributing to the diurnal variations in the pulse waveform parameters.
There are several limitations of this study. First, any gender-related difference is unknown because the enrolled normal subjects in this study were all men. Yanagida et al[8] reported that gender-related differences exist in MBR as determined using LSFG. Consequently, it is likely that the pulse waveform parameters have gender-related differences. Second, we did not measure the concentration of epinephrine and NO in this study, and actual association between these and the waveform parameters is unknown. Third, the sample size was small. Further study with larger number of healthy subjects (both men and women) and measurement of epinephrine and NO will be needed.
In conclusion, we found that there was a significant diurnal variation in 6 of 8 waveform parameters determined using LSFG on ONH. We believe that our results highlighting diurnal variations in these waveform parameters need to be considered when interpreting pulse waveform parameter data and in understanding the precise underlying mechanism of ocular diseases such as diabetic retinopathy, retinal vein occlusion, and glaucoma.
Footnotes
Abbreviations: BCVA = best-corrected visual acuity, BOS = blow out score, BOS = blow out time, D = diopters, DBP = diastolic blood pressure, HR = heart rate, IOP = intraocular pressure, LSFG = laser speckle flowgraphy, MAP = mean arterial blood pressure, MBR = mean blur rate, MOPP = mean ocular perfusion pressure, NO = nitric oxide, ONH = optic nerve head, SBP = systolic blood pressure.
Authors’ contributions: The design and conduct of the study (TI); collection of data (TI, MF, KY, ER); management, analysis, and interpretation of data (TI, MF, KY, KM); and preparation, review, and approval of the manuscript (TI, MF, KY, ER, HT, KM).
This manuscript is an original submission and has not been considered elsewhere.
The authors have no conflicts of interest to disclose.
References
- [1].Luo X, Shen YM, Jiang MN, et al. Ocular blood flow autoregulation mechanisms and methods. J Ophthalmol 2015;2015:864871. [DOI] [PMC free article] [PubMed] [Google Scholar]
- [2].Hayreh SS. The 1994 Von Sallman Lecture. The optic nerve head circulation in health and disease. Exp Eye Res 1995;61:259–72. [DOI] [PubMed] [Google Scholar]
- [3].Langham ME, Kramer T. Decreased choroidal blood flow associated with retinitis pigmentosa. Eye (Lond) 1990;4(Pt 2):374–81. [DOI] [PubMed] [Google Scholar]
- [4].Falsini B, Anselmi GM, Marangoni D, et al. Subfoveal choroidal blood flow and central retinal function in retinitis pigmentosa. Invest Ophthalmol Vis Sci 2011;52:1064–9. [DOI] [PubMed] [Google Scholar]
- [5].Aizawa N, Yokoyama Y, Chiba N, et al. Reproducibility of retinal circulation measurements obtained using laser speckle flowgraphy-NAVI in patients with glaucoma. Clin Ophthalmol 2011;5:1171–6. [DOI] [PMC free article] [PubMed] [Google Scholar]
- [6].Shiga Y, Shimura M, Asano T, et al. The influence of posture change on ocular blood flow in normal subjects, measured by laser speckle flowgraphy. Curr Eye Res 2013;38:691–8. [DOI] [PubMed] [Google Scholar]
- [7].Sugiyama T, Araie M, Riva CE, et al. Use of laser speckle flowgraphy in ocular blood flow research. Acta Ophthalmol 2010;88:723–9. [DOI] [PubMed] [Google Scholar]
- [8].Yanagida K, Iwase T, Yamamoto K, et al. Sex-related differences in ocular blood flow of healthy subjects using laser speckle flowgraphy. Invest Ophthalmol Vis Sci 2015;56:4880–90. [DOI] [PubMed] [Google Scholar]
- [9].Chiba N, Omodaka K, Yokoyama Y, et al. Association between optic nerve blood flow and objective examinations in glaucoma patients with generalized enlargement disc type. Clin Ophthalmol 2011;5:1549–56. [DOI] [PMC free article] [PubMed] [Google Scholar]
- [10].Yokoyama Y, Aizawa N, Chiba N, et al. Significant correlations between optic nerve head microcirculation and visual field defects and nerve fiber layer loss in glaucoma patients with myopic glaucomatous disk. Clin Ophthalmol 2011;5:1721–7. [DOI] [PMC free article] [PubMed] [Google Scholar]
- [11].Nitta F, Kunikata H, Aizawa N, et al. The effect of intravitreal bevacizumab on ocular blood flow in diabetic retinopathy and branch retinal vein occlusion as measured by laser speckle flowgraphy. Clin Ophthalmol 2014;8:1119–27. [DOI] [PMC free article] [PubMed] [Google Scholar]
- [12].Yamada Y, Suzuma K, Matsumoto M, et al. Retinal blood flow correlates to aqueous vascular endothelial growth factor in central retinal vein occlusion. Retina 2015;35:2037–42. [DOI] [PubMed] [Google Scholar]
- [13].Shiga Y, Omodaka K, Kunikata H, et al. Waveform analysis of ocular blood flow and the early detection of normal tension glaucoma. Invest Ophthalmol Vis Sci 2013;54:7699–706. [DOI] [PubMed] [Google Scholar]
- [14].Shiba T, Takahashi M, Hori Y, et al. Pulse-wave analysis of optic nerve head circulation is significantly correlated with brachial-ankle pulse-wave velocity, carotid intima-media thickness, and age. Graefes Arch Clin Exp Ophthalmol 2012;250:1275–81. [DOI] [PubMed] [Google Scholar]
- [15].Shiba T, Takahashi M, Hori Y, et al. Optic nerve head circulation determined by pulse wave analysis is significantly correlated with cardio ankle vascular index, left ventricular diastolic function, and age. J Atheroscler Thromb 2012;19:999–1005. [DOI] [PubMed] [Google Scholar]
- [16].Tsuda S, Kunikata H, Shimura M, et al. Pulse-waveform analysis of normal population using laser speckle flowgraphy. Curr Eye Res 2014;39:1207–15. [DOI] [PubMed] [Google Scholar]
- [17].Rina M, Shiba T, Takahashi M, et al. Pulse waveform analysis of optic nerve head circulation for predicting carotid atherosclerotic changes. Graefes Arch Clin Exp Ophthalmol 2015;253:2285–91. [DOI] [PubMed] [Google Scholar]
- [18].Kitazawa Y, Horie T. Diurnal variation of intraocular pressure in primary open-angle glaucoma. Am J Ophthalmol 1975;79:557–66. [DOI] [PubMed] [Google Scholar]
- [19].Liu JH, Kripke DF, Hoffman RE, et al. Nocturnal elevation of intraocular pressure in young adults. Invest Ophthalmol Vis Sci 1998;39:2707–12. [PubMed] [Google Scholar]
- [20].Wilson LB, Quinn GE, Ying GS, et al. The relation of axial length and intraocular pressure fluctuations in human eyes. Invest Ophthalmol Vis Sci 2006;47:1778–84. [DOI] [PubMed] [Google Scholar]
- [21].Read SA, Collins MJ, Iskander DR. Diurnal variation of axial length, intraocular pressure, and anterior eye biometrics. Invest Ophthalmol Vis Sci 2008;49:2911–8. [DOI] [PubMed] [Google Scholar]
- [22].Kiely PM, Carney LG, Smith G. Diurnal variations of corneal topography and thickness. Am J Optom Physiol Opt 1982;59:976–82. [DOI] [PubMed] [Google Scholar]
- [23].Harper CL, Boulton ME, Bennett D, et al. Diurnal variations in human corneal thickness. Br J Ophthalmol 1996;80:1068–72. [DOI] [PMC free article] [PubMed] [Google Scholar]
- [24].Read SA, Collins MJ, Carney LG. The diurnal variation of corneal topography and aberrations. Cornea 2005;24:678–87. [DOI] [PubMed] [Google Scholar]
- [25].Mapstone R, Clark CV. Diurnal variation in the dimensions of the anterior chamber. Arch Ophthalmol 1985;103:1485–6. [DOI] [PubMed] [Google Scholar]
- [26].Usui S, Ikuno Y, Akiba M, et al. Circadian changes in subfoveal choroidal thickness and the relationship with circulatory factors in healthy subjects. Invest Ophthalmol Vis Sci 2012;53:2300–7. [DOI] [PubMed] [Google Scholar]
- [27].Pemp B, Georgopoulos M, Vass C, et al. Diurnal fluctuation of ocular blood flow parameters in patients with primary open-angle glaucoma and healthy subjects. Br J Ophthalmol 2009;93:486–91. [DOI] [PubMed] [Google Scholar]
- [28].Sehi M, Flanagan JG, Zeng L, et al. Anterior optic nerve capillary blood flow response to diurnal variation of mean ocular perfusion pressure in early untreated primary open-angle glaucoma. Invest Ophthalmol Vis Sci 2005;46:4581–7. [DOI] [PubMed] [Google Scholar]
- [29].Iwase T, Yamamoto K, Ra E, et al. Diurnal variations in blood flow at optic nerve head and choroid in healthy eyes: diurnal variations in blood flow. Medicine (Baltimore) 2015;94:e519. [DOI] [PMC free article] [PubMed] [Google Scholar]
- [30].Tuck ML, Stern N, Sowers JR. Enhanced 24-hour norepinephrine and renin secretion in young patients with essential hypertension: relation with the circadian pattern of arterial blood pressure. Am J Cardiol 1985;55:112–5. [DOI] [PubMed] [Google Scholar]
- [31].Shoukas AA, Bohlen HG. Rat venular pressure-diameter relationships are regulated by sympathetic activity. Am J Physiol 1990;259(3 Pt 2):H674–80. [DOI] [PubMed] [Google Scholar]
- [32].Panza JA, Epstein SE, Quyyumi AA. Circadian variation in vascular tone and its relation to alpha-sympathetic vasoconstrictor activity. N Engl J Med 1991;325:986–90. [DOI] [PubMed] [Google Scholar]
- [33].Linsell CR, Lightman SL, Mullen PE, et al. Circadian rhythms of epinephrine and norepinephrine in man. J Clin Endocrinol Metab 1985;60:1210–5. [DOI] [PubMed] [Google Scholar]
- [34].Casiglia E, Palatini P, Colangeli G, et al. 24 h rhythm of blood pressure and forearm peripheral resistance in normotensive and hypertensive subjects confined to bed. J Hypertens 1996;14:47–52. [PubMed] [Google Scholar]
- [35].Casiglia E, Palatini P, Ginocchio G, et al. Leg versus forearm flow: 24 h monitoring in 14 normotensive subjects and in 14 age-matched hypertensive patients confined to bed. Am J Hypertens 1998;11:190–5. [DOI] [PubMed] [Google Scholar]
- [36].Sindrup JH, Kastrup J, Christensen H, et al. Nocturnal variations in peripheral blood flow, systemic blood pressure, and heart rate in humans. Am J Physiol 1991;261(4 Pt 2):H982–8. [DOI] [PubMed] [Google Scholar]
- [37].Perlman JI, Delany CM, Sothern RB, et al. Relationships between 24 h observations in intraocular pressure vs blood pressure, heart rate, nitric oxide and age in the medical chronobiology aging project. Clin Ter 2007;158:31–47. [PubMed] [Google Scholar]
- [38].Elherik K, Khan F, McLaren M, et al. Circadian variation in vascular tone and endothelial cell function in normal males. Clin Sci (Lond) 2002;102:547–52. [PubMed] [Google Scholar]


