

Abstract
This article discusses recent scientific advances in the study of individual differences in human brain development. Focusing on structural neuroimaging measures of brain morphology and tissue properties, two kinds of variability are related and explored: differences across individuals of the same age and differences across age as a result of development. A recent multidimensional modeling study is explained, which was able to use brain measures to predict an individual's chronological age within about one year on average, in children, adolescents, and young adults between 3 and 20 years old. These findings reveal great regularity in the sequence of the aggregate brain state across different ages and phases of development, despite the pronounced individual differences people show on any single brain measure at any given age. Future research is suggested, incorporating additional measures of brain activity and function. WIREs Cogn Sci 2017, 8:e1389. doi: 10.1002/wcs.1389
For further resources related to this article, please visit the WIREs website.
INTRODUCTION
These are exciting times for scientists interested in trying to figure out how the brain changes as it develops and how these changes somehow give rise to the incredible psychological abilities that grow along with them. Recent years have seen a huge expansion in the number and precision of technologies available to scientists for noninvasively studying human brain development.1
Using structural and functional neuroimaging and recording techniques, we can now measure within an individual child the thickness and surface area of all regions of the cerebral cortex—the outermost layer of the brain thought to be the pinnacle of cognitive processing. We can quantitatively assess the shape and volume of specific subcortical structures like the hippocampus, which plays a crucial role in forming memories, or the cerebellum, important for the coordination of movements and motor learning. We can test resting metabolic and blood flow properties at any location within the brain, and we can even measure the localized patterns of brain activity that occur while children are seeing, hearing, speaking, thinking, and learning.
One of the fundamental issues in the study of human brain and cognitive development relates to our individual differences and how these reflect the sequence of developmental changes each person goes through (see Bateson, Robustness and plasticity in development, WIREs Cogn Sci, also in the collection How We Develop). Within this area, we're still trying to answer some of the most basic questions: How pronounced are the differences across children (and adults, for that matter) in their anatomical and physiological brain features? Can we ascertain how individual brain differences relate to differences in cognitive processing, emotional sensitivities, social skills, or even academic abilities? How do genes and experience contribute to individual differences in these brain functions?
These newly available measurements are giving us new insights into brain structure and function across the lifespan. Importantly, the more we learn about individual differences in brain development, the more we also appreciate what is common across individuals about our brains.
AN OVERALL IMPRESSION OF GREAT INDIVIDUAL VARIABILITY
Although researchers still have many more questions than answers about individual brain development, one thing has become very clear in recent years: The range of variability in a given brain measure across different children of the same age tends to be high in relative proportion to the total variability in that same measure across different periods of development. In addition, many brain measures show complex changes with age, being both nonlinear—varying in the rate of change over time—and nonmonotonic—varying in the direction of change over time. For example, the total surface area of the cerebral cortex—measured as if it were un‐crumpled and flattened to remove its wrinkles—shows a high degree of interindividual variability between the ages of 3 and 20 years (Figure 1; movie link). Although cortical area increases, on average, between toddlerhood and about 10 or 11 years of age (near the onset of puberty), cortical area then decreases from adolescence into young adulthood. As can be seen from the data points in Figure 1, each representing one person, the wide dispersion of individual differences in cortical area remains about the same across different ages. This property, and the fact that the average rises and then falls, means that this measure is not very useful as an index of the phase of brain development or even of chronological age for any one person. A total cortical area of about 180 K mm2, e.g., may represent a 3‐year‐old child with a particularly large cortical area for his or her age, a 12‐year‐old with an average cortical area, or an adolescent on the other side of the ‘pubertal peak,’ heading developmentally in the opposite direction (i.e., decreasing in area, not increasing).
Figure 1.
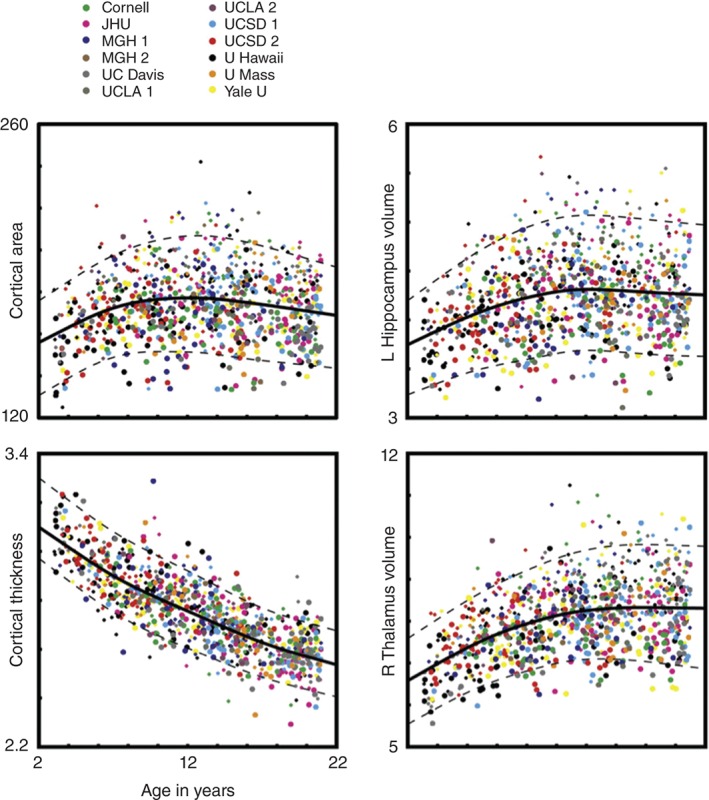
Individual morphological brain measures. Example measures derived from the segmentation of T1‐weighted MRI scans are plotted for 885 subjects as a function of age: total cortical area in square millimeters by thousands, mean cortical thickness in millimeters, volume of the left hippocampus in cubic millimeters by thousands, and volume of the right thalamus in cubic millimeters by thousands. Colors correspond to different sites and scanners. Symbol size represents subject sex (larger = female, smaller = male). A spline‐fit curve (solid line) with 5 and 95% prediction intervals (dashed lines) are also shown. (Reprinted with permission from Ref 2. Copyright 2012)
The development of cortical thickness, however, is quite different (Figure 1). Across the same ages of 3–20 years, the average thickness of the cortex moves only in one direction—decreasing; its changes over time are largely linear in shape, and differences across individuals of the same age are relatively small in comparison to the magnitude of total developmental change in thickness. These characteristics make cortical thickness a much better index of the phase of brain development than cortical surface area. In fact, it can be used to predict a child's chronological age with reasonable accuracy, explaining about 50–60% of the variance (depending on age). Although imaging scientists are not exactly sure yet how all of the underlying cellular changes contribute to our imaging measures of cortical thickness and surface area, these differing developmental profiles for the two characteristics are consistent with other evidence suggesting they have distinct genetic influences as well.3
TWO KINDS OF VARIABILITY
In essence, then, there are two opposing types of variability that we're trying to characterize in brain studies of individual differences: The range of differences across children of the same age and the range of differences across specific periods of development. Although the underlying neurobiological processes that drive this variability are not independent, each kind of variability interferes with our ability to detect and make inferences about the other. As Silvia Bunge and Kirstie Whitaker have so aptly put it, ‘An individual differences researcher's signal is a developmental researcher's noise’4 (link to commentary).
It turns out that most brain measures available to us are not like cortical thickness in terms of these two kinds of variability. As we examine an ever‐increasing collection of brain features, it appears that the majority of available neuroanatomical and neurophysiological measures show a high degree of variability across same‐aged children in relation to the amount of total developmental change (at least from about the preschool years into young adulthood). Like cortical surface area, measures of the volumes of specific subcortical structures (e.g., thalamus and hippocampus) also show nonmonotonic trends and relatively large individual differences even within healthy, typically developing children (Figure 1). A portion of the variance in these morphological brain measures relates simply to individual differences in the child's body size and sex. For example, at all ages and phases of development males tend to have bigger bodies than females on average, and having larger brains goes along with this.
Some measures of the tissue properties and cellular and molecular architecture of gray and white matter seem to have somewhat smaller variability in individual differences than the larger‐scale morphological size and shape measures. Common magnetic resonance imaging (MRI)‐derived measures of tissue microstructure include fractional anisotropy (FA), a measure of the directionality of water movement within tissue, and apparent diffusion coefficient (ADC) or mean diffusivity (MD), which both capture the degree to which water moves freely in any direction. These biomarkers of diffusivity have been associated, to some extent, with the degree of myelination that is present within a particular parcel of tissue. Myelin is a fatty sheath that covers the axons of neurons—like insulation around a wire—and improves the speed and reliability of information transfer from one neuron to another (myelin is what makes ‘white matter’ white). From animal and postmortem human studies, it is known that the brain undergoes increasing myelin deposition across development, and the timing of myelination varies systematically by cortical region: Primary sensory regions (e.g., cortex devoted to touch, vision, and hearing) are the first to myelinate, followed later by transmodal and ‘cognitive’ association cortex, in sequential fashion. Nevertheless, diffusion measures are far from perfect for assessing myelin content, and they are only slightly better than morphological measures for distinguishing developmental phase—that is, knowing from brain images and imaging measures whether we're looking at a child, an adolescent, or an adult. As with all of our imaging techniques, we are constantly improving our methods for more accurately measuring the underlying neurobiology.5
This generally high degree of interindividual variability would appear to paint a rather bleak picture for the ability of developmental researchers to make sense of the multitudinous and highly complex changing attributes that make one phase of brain development different from another. And if we can't reliably distinguish different phases of brain development, our prospects are dim for figuring out how cognitive development relates mechanistically to such changes. It is important to keep in mind, however, that the vast majority of developmental studies to date have examined brain measures only in isolation, as separate features. Although a perfectly reasonable starting point, this approach is probably not the best way to understand such a highly multifactorial and temporally complex collection of interweaving biological processes.
A MULTIDIMENSIONAL APPROACH REVEALS GREAT DEVELOPMENTAL REGULARITY DESPITE INDIVIDUAL DIFFERENCES
In 2012, the collaborative group of the Pediatric Imaging, Neurocognition, and Genetics (PING) Study6 reported the results of a novel multidimensional analysis of a large neuroimaging dataset2 (UCSD Health Sciences press release). Capitalizing on the combination of many key advances in acquiring and integrating different kinds of brain scans, extracting new and more precise measures from these images, and novel multidimensional modeling approaches, we wondered if it was possible to integrate information across lots of developing brain characteristics and examine their interrelations to get a deeper understanding of brain development as an integrated process (Cell Press video abstract). Using methods devised by us for this purpose, we demonstrated in 885 individuals between the ages of 3 and 20 years that it is possible to predict the age of a person within about one year on average using a set of 231 neuroanatomical biomarkers measured with MRI. These biomarkers included measures of brain morphology, diffusivity, and signal intensity (essentially normalized image ‘brightness’). We chose these particular brain measures before we tested the model, based on previous cross‐sectional and longitudinal research that has found significant developmental (i.e., age) differences in them from preschool ages into young adulthood. We also included some new measures that had not been examined before but that we suspected would also be sensitive to developmental changes and, therefore, would contribute to a model predicting an individual's chronological age.
Importantly, we built in several safeguards against overfitting, which is a primary concern when modeling so many variables. If a predictive model overfits the data, the resulting statistics will be artificially inflated and will give a misleading impression about how well the model predicts the variable of interest (in this case age). A simple way to test for overfitting is to calculate and plot the proportion of variance explained by the model (called the coefficient of determination) as a function of different sample sizes. Since our coefficient of determination increased and did not decrease with increasing sample sizes, we could be reasonably sure that the model was not overfitting. We also cross‐validated our results, which is a test of the reliability of the findings. One way to cross‐validate is to randomly split the data points into two halves and test the model independently within each half data set, looking for the same result. We used leave‐one‐out cross‐validation, which is computationally more demanding but produces similar results without the split‐half drawback of randomly producing noncomparable half data sets.
Amazingly, more than 92% of the variance in age across individuals was explained by our model using a multidimensional analysis of these brain features (Figure 2). On average across the ages of 3–20 years, at any given age there was only about 1 year of variance among individuals in their biologically measured phase of brain development. This was a surprising result given the variability in individual differences that we observe for most individual brain measures (for comparison, see Figure 1). What this finding reveals is that developmental alterations in the fundamental brain tissue biology and neural architecture are much more tightly linked to chronological age throughout childhood and adolescence than we previously knew. By combining multiple brain measures in our analytic approach, and capturing their interrelations, we were able to pull out a strong signal for developmental phase despite the widely varying individual differences that exist at any given age in any single measure.
Figure 2.
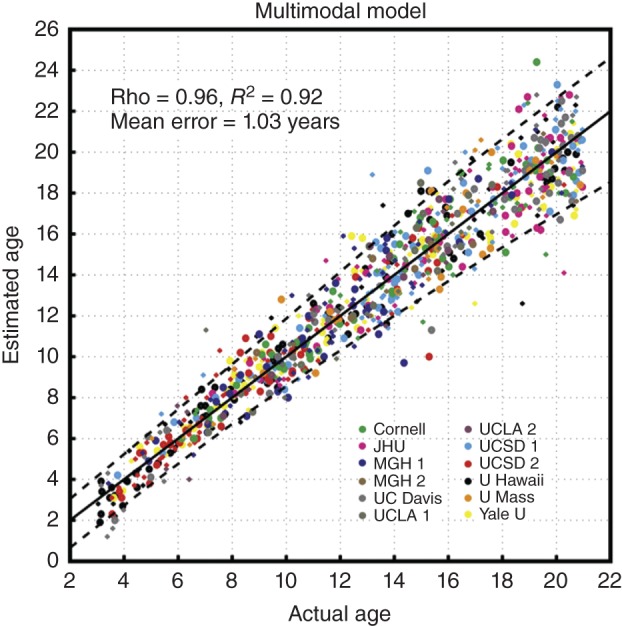
Multidimensional prediction of age. For 885 individuals, estimated brain age is plotted as a function of actual chronological age. Colors correspond to different sites and scanners. Symbol size represents subject sex (larger = female, smaller = male). A spline‐fit curve (solid line) with 5 and 95% prediction intervals (dashed lines) is also shown. (Reprinted with permission from Ref 2. Copyright 2012)
Our approach also had the advantage of being able to identify which types of brain measures were the best predictors at each part of the age range (Figure 3). Interestingly, from the preschool years until about 11 years of age, changes in the ‘brightness’ of tissues within subcortical structures explained the most variance in age (black line). From the ages of about 11 to 15 years, changes in white matter tracts likely related to increasing myelination (blue line) were the strongest age predictor, rising to the top of the heap. Measures of the volumes of subcortical brain structures explained the most variance in the age range from about 15 to 17 years old (red line). One of the most interesting results was that water diffusion properties within the gray matter of deep brain structures was the strongest contributor to the prediction of age between 17 and 20 years (purple line). This is notable since few researchers to date have been paying close attention to diffusion measures outside of the cerebral white matter.
Figure 3.
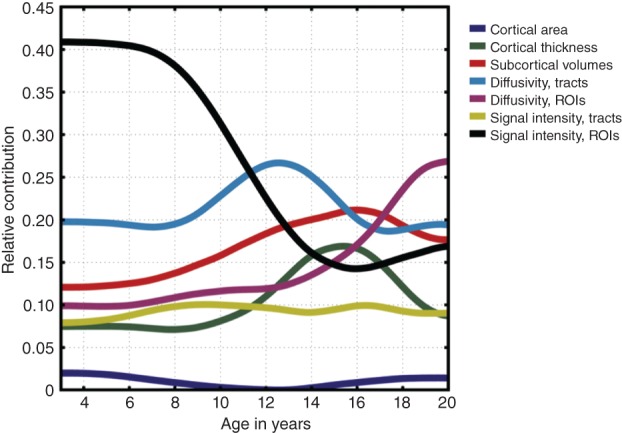
Age‐varying contributions of different imaging measures to the prediction of age. The relative contributions of separate morphological, diffusivity, and signal intensity measures within different brain structures are plotted as a function of age. Colors correspond to measure and structure type (dark blue, cortical area; green, cortical thickness; red, subcortical volumes; light blue, diffusion within white matter tracts; dark pink, diffusion within subcortical ROIs; gold, T2 signal intensity within white matter tracts; black, T2 signal intensity within subcortical regions of interest. Contributions are computed as units of the proportion of total explained variance. (Reprinted with permission from Ref 2. Copyright 2012)
It is important to note that this study, like many that attempt to make inferences about human development, relied entirely on cross‐sectionally collected data. That is, we collected brain measurements once in many different individuals at different ages and rely on the assumption that these individuals are representative of the populations at these different ages. Alternatively, developmental scientists can study the same group of individuals over time, making repeated brain measurements as they age. This kind of longitudinal approach is required for truly characterizing changes and for making the strongest inferences about developmental processes, instead of having to merely infer developmental changes from the measurements of different age groups. Despite their obvious scientific advantages, longitudinal studies of brain development are still less common than cross‐sectional studies, due in part to the practical challenges associated with recruiting and retaining participants for long periods of time. One way to reduce the chances of making misleading developmental inferences in cross‐sectional studies is to use large, representative sample sizes that are reasonably well matched on demographic characteristics across age. Recent research comparing this kind of cross‐sectional data (from PING) to longitudinal results using the same brain measures shows striking similarity between cross‐sectionally and longitudinally derived developmental trajectories.7 For the purposes of developmental phase prediction, one would expect that longitudinal data would only improve our ability to accurately predict an individual's age using neuroanatomical measures.
Overall, the results from our age prediction study suggest that throughout human development the patterns of changes that occur within the brain in the macro‐level sizes of various structures and in the cellular and molecular tissue architecture are cascading across the brain in a very systematic way. As developmentalists, we seek to understand what makes one phase of maturation or development characteristically different from another. Until recently, we have been sorely underperforming on this prospect, unable to use brain measures to reliably distinguish between individuals of even several years apart in age. With the development of this phase metric approach, we showed for the first time that many brain measures can be used to reliably identify an individual's chronological age within several months to a year on average (depending on age). This means that we now have a relatively rich multidimensional model of developmental phase—one that captures features that reliably define different points in time—in this case spanning ages 3–20 years. So, despite still needing to critically unpack and better understand these characteristics and their complex developmental relationships, this ability to predict an individual's chronological age represents significant progress. Somewhat counter‐intuitively, by trying to better capture the differences across individuals in the complex profile of neuroanatomical features, we actually uncovered new evidence that, from preschool ages into young adulthood, people of the same age are strikingly similar to each other in the aggregate state of their development. In other words, despite numerous apparent differences in any single brain characteristic at a given age, we still bear in our brains the indelible stamp of our position along the trajectory of human development.
These findings are heartening for those of us conducting research in the field, whose primary hope is an improved understanding of the neural mechanisms underlying the development of mental functioning. With improved models of typical human brain development, which better capture the distinguishing multidimensional characteristics at different ages and phases of growth, we should be in a better position to relate these phases to the timing of particular changes in cognitive development. In addition, multidimensional models might also help us identify phases of brain development that are particularly relevant to neurodevelopmental disorders, which can emerge at different points in childhood and adolescence (see D'Souza and Karmiloff‐Smith, Neurodevelopmental disorders, WIREs Cogn Sci, also in the collection How We Develop).
WHAT ABOUT INDIVIDUAL DIFFERENCES IN BRAIN ACTIVITY?
As always with scientific research, new findings inspire new questions. Our initial study focused only on anatomical and tissue property features, which are relatively stable and static measures in the sense that they may not change much over short time periods (i.e., within seconds, minutes, or hours). Measures of brain function or physiology, however, as examined using tools like functional MRI (fMRI), electroencephalography (EEG), and magnetoencephalography (MEG), change robustly and dynamically over mere milliseconds and seconds in relation to sensory events, cognitive demands, and changing brain states. Several new questions about brain function arise from the recent neuroanatomical findings. For example, do dynamic patterns of brain activity show similar developmental regularity across age, or are individual differences in physiological measures much more pronounced (see Bick and Nelson, Early experience and brain development, WIREs Cogn Sci, also in the collection How We Develop)?
Because of the fleeting and dynamic nature of functional brain signals, they add another level of complexity to our experiments. For one thing, cognitive state and behavioral task performance need to be tracked because brain activity is closely tied to these factors. Researchers must work very hard not to mistake potentially confounding factors like task performance and head motion for developmental or individual differences in brain anatomy and activity.8, 9, 10, 11, 12, 13, 14 This can be difficult to accomplish in imaging studies with children,15, 16, 17, 18, 19, 20, 21, 22 where small‐magnitude motion artifacts in particular can have insidious effects on the results of developmental differences and changes in imaging variables because of its strong and systematic correlation with age. Although the potentially distorting effects of subject motion can never be ruled out entirely, significant progress is being made to improve the integrity and reliability of our brain measures so they more accurately reflect the underlying biology and its changes. The PING data set used in the age prediction study were collected using real‐time prospective motion correction (PROMO), which has been shown to significantly reduce such artifacts in raw brain images, processed measures such as those used here, and in clinical radiological judgments.8, 12, 13 Despite these continuing challenges, carefully collected, localized brain activity measures that use new techniques like PROMO to combat artifacts should provide valuable physiological evidence that can be more directly linked to individual differences in information processing than anatomy alone.23, 24 This will provide us with even greater power to relate the developing neurobiology to developing psychological functions.
CONCLUSION
With the growing availability of a wide array of noninvasive experimental tools for measuring brain structure and function, our view of human brain development and our understanding of individual differences are rapidly evolving. Using these tools with developing children—from preschool age into early adulthood—we can now estimate an individual's chronological age within about one year using only measures of brain anatomy. This capability, which comes from the integrated consideration of many brain measures, comes as a bit of a surprise to those of us who have long been examining the development of brain features one measure at a time. The complex, multidimensional cascade of the brain's growing anatomy represents a developing phenotype that unfolds with systematic timing regardless of the great individual differences children may show within any single measure at any given age. There is clearly much left to discover about individual brain differences and similarities and how they relate to cognitive development.
ACKNOWLEDGMENTS
The author gratefully thanks the children, adolescents, parents, and adults who support this continuing research through their generous voluntary participation. The author also thanks the editors and reviewers for their thoughtful input on this manuscript. This work was supported by funding from the Eunice Kennedy Shriver National Institute of Child Health and Human Development (R24HD075489), the National Science Foundation (SMA1041755), and the National Institute on Drug Abuse (R01DA038958, RC2DA029475).
This article is part of a special collection on developmental systems designed to explore the powerful array of forces shaping the individual development of brains, bodies, and behavior. The collection was created and edited by Mark S. Blumberg (University of Iowa), John P. Spencer (University of East Anglia), and David Shenk (Author, The Genius in All of Us), in conjunction with the DeLTA Center at The University of Iowa. View the full collection: How We Develop – Developmental Systems and the Emergence of Complex Behaviors
Conflict of interest: The author has declared no conflicts of interest for this article.
References
FURTHER READINGS
- Brown TT, Jernigan TL. Brain development during the preschool years. Neuropsychol Rev 2012, 22:313–333. [DOI] [PMC free article] [PubMed] [Google Scholar]
- Casey BJ, Galvan A, Hare TA. Changes in cerebral functional organization during cognitive development. Curr Opin Neurobiol 2005, 15:239–244. [DOI] [PubMed] [Google Scholar]
- Casey BJ, Giedd JN, Thomas KM. Structural and functional brain development and its relation to cognitive development. Biol Psychol 2000, 54:241–257. [DOI] [PubMed] [Google Scholar]
- Elman JL et al. Rethinking Innateness: A Connectionist Perspective on Development. Boston, MA: MIT Press; 1996. [Google Scholar]
- Jernigan TL, Brown TT, Bartsch H, Dale AM. Toward an integrative science of the developing human mind and brain: Focus on the developing cortex. Dev Cogn Neurosci 2015, 18:2–11. doi:10.1016/j.dcn.2015.07.008. [DOI] [PMC free article] [PubMed] [Google Scholar]
- Johnson MH. Interactive specialization: a domain‐general framework for human functional brain development? Dev Cogn Neurosci 2011, 1:7–21. [DOI] [PMC free article] [PubMed] [Google Scholar]
- Lewis MD. Self‐organizing individual differences in brain development. Dev Rev 2005, 25:252–277. [Google Scholar]
- Scarr S. Developmental theories for the 1990s: development and individual differences. Child Dev 1992, 63:1–19. [PubMed] [Google Scholar]
- Stiles J, Jernigan TL. The basics of brain development. Neuropsychol Rev 2010, 20:327–348. [DOI] [PMC free article] [PubMed] [Google Scholar]
REFERENCES
- 1. Stiles J, Brown TT, Haist F, Jernigan TL. Brain and cognitive development In: lerner RM, ed. Handbook of Child Psychology and Developmental Science, vol. II 7th ed. New York, NY: John Wiley & Sons, Inc.; 2015. [Google Scholar]
- 2. Brown TT, Kuperman JM, Chung Y, Erhart M, McCabe C, Hagler DJ Jr, Venkatraman VK, Akshoomoff N, Amaral DG, Bloss CS, et al. Neuroanatomical assessment of biological maturity. Curr Biol 2012, 22:1693–1698. [DOI] [PMC free article] [PubMed] [Google Scholar]
- 3. Panizzon MS, Fennema‐Notestine C, Eyler LT, Jernigan TL, Prom‐Wormley E, Neale M, Jacobson K, Lyons MJ, Grant MD, Franz CE, et al. Distinct genetic influences on cortical surface area and cortical thickness. Cereb Cortex 2009, 19:2728–2735. [DOI] [PMC free article] [PubMed] [Google Scholar]
- 4. Bunge SA, Whitaker KJ. Brain imaging: your brain scan doesn't lie about your age. Curr Biol 2012, 22:R800–R801. [DOI] [PubMed] [Google Scholar]
- 5. Deoni SC, Dean DC 3rd, O'Muircheartaigh J, Dirks H, Jerskey BA. Investigating white matter development in infancy and early childhood using myelin water faction and relaxation time mapping. Neuroimage 2012, 63:1038–1053. [DOI] [PMC free article] [PubMed] [Google Scholar]
- 6. Jernigan TL, Brown TT, Hagler DJ Jr, Akshoomoff N, Bartsch H, Newman E, Thompson WK, Bloss CS, Murray SS, Schork N, et al. The pediatric imaging, neurocognition, and genetics (PING) data repository. Neuroimage 2015. (Epub ahead of print: May 1, 2015). [DOI] [PMC free article] [PubMed] [Google Scholar]
- 7. Walhovd KB, Fjell AM, Giedd J, Dale AM, Brown TT. Through thick and thin: A need to reconcile contradictory results on trajectories in human cortical development. Cereb Cortex. In press. doi:10.1093/cercor/bhv301. [DOI] [PMC free article] [PubMed] [Google Scholar]
- 8. Brown TT, Kuperman JM, Erhart M, White NS, Roddey JC, Shankaranarayanan A, Han ET, Rettmann D, Dale AM. Prospective motion correction of high‐resolution magnetic resonance imaging data in children. Neuroimage 2010, 53:139–145. [DOI] [PMC free article] [PubMed] [Google Scholar]
- 9. Brown TT, Lugar HM, Coalson RS, Miezin FM, Petersen SE, Schlaggar BL. Developmental changes in human cerebral functional organization for word generation. Cereb Cortex 2005, 15:275–290. [DOI] [PubMed] [Google Scholar]
- 10. Brown TT, Petersen SE, Schlaggar BL. Does human functional brain organization shift from diffuse to focal with development? Dev Sci 2006, 9:9–11. [DOI] [PubMed] [Google Scholar]
- 11. Irimia A, Erhart MJ, Brown TT. Variability of magnetoencephalographic sensor sensitivity measures as a function of age, brain volume and cortical area. Clin Neurophysiol 2014, 125:1973–1984. [DOI] [PMC free article] [PubMed] [Google Scholar]
- 12. Kuperman JM, Brown TT, Ahmadi ME, Erhart MJ, White NS, Roddey JC, Shankaranarayanan A, Han ET, Rettmann D, Dale AM. Prospective motion correction improves diagnostic utility of pediatric MRI scans. Pediatr Radiol 2011, 41:1578–1582. [DOI] [PMC free article] [PubMed] [Google Scholar]
- 13. White N, Roddey C, Shankaranarayanan A, Han E, Rettmann D, Santos J, Kuperman J, Dale AM. PROMO: real‐time prospective motion correction in MRI using image‐based tracking. Magn Res Med 2010, 63:91–105. [DOI] [PMC free article] [PubMed] [Google Scholar]
- 14. Murphy K, Garavan H. Artifactual fMRI group and condition differences driven by performance confounds. Neuroimage 2004, 21:219–228. [DOI] [PubMed] [Google Scholar]
- 15. Palmer ED, Brown TT, Petersen SE, Schlaggar BL. Investigation of the functional neuroanatomy of single word reading and its development. Sci Stud Read 2004, 8:203–223. [Google Scholar]
- 16. Power JD, Barnes KA, Snyder AZ, Schlaggar BL, Petersen SE. Spurious but systematic correlations in functional connectivity MRI networks arise from subject motion. Neuroimage 2012, 59:2142–2154. [DOI] [PMC free article] [PubMed] [Google Scholar]
- 17. Schlaggar BL, Brown TT, Lugar HM, Visscher KM, Miezin FM, Petersen SE. Functional neuroanatomical differences between adults and school‐age children in the processing of single words. Science 2002, 296:1476–1479. [DOI] [PubMed] [Google Scholar]
- 18. Brown TT, Petersen SE, Schlaggar BL. Functional neuroimaging approaches to the study of human brain development. Perspect Neurophysiol Neurogenic Speech Lang Disord 2003, 13:3–10. [Google Scholar]
- 19. Church JA, Petersen SE, Schlaggar BL. The "task B problem" and other considerations in developmental functional neuroimaging. Hum Brain Mapp 2010, 31:852–862. [DOI] [PMC free article] [PubMed] [Google Scholar]
- 20. Crone EA, Poldrack RA, Durston S. Challenges and methods in developmental neuroimaging. Hum Brain Mapp 2010, 31:835–837. [DOI] [PMC free article] [PubMed] [Google Scholar]
- 21. Poldrack RA. Interpreting developmental changes in neuroimaging signals. Hum Brain Mapp 2010, 31:872–878. [DOI] [PMC free article] [PubMed] [Google Scholar]
- 22. Van Dijk KRA, Sabuncu MR, Buckner RL. The influence of head motion on intrinsic functional connectivity MRI. Neuroimage 2012, 59:431–438. [DOI] [PMC free article] [PubMed] [Google Scholar]
- 23. Brown TT, Erhart M, Avesar D, Dale AM, Halgren E, Evans JL. Atypical right hemisphere specialization for object representations in an adolescent with specific language impairment. Front Hum Neurosci 2014, 8:82. [DOI] [PMC free article] [PubMed] [Google Scholar]
- 24. Fair DA, Brown TT, Petersen SE, Schlaggar BL. fMRI reveals novel functional neuroanatomy in a child with perinatal stroke. Neurology 2006, 67:2246–2249. [DOI] [PubMed] [Google Scholar]