Figure 3.
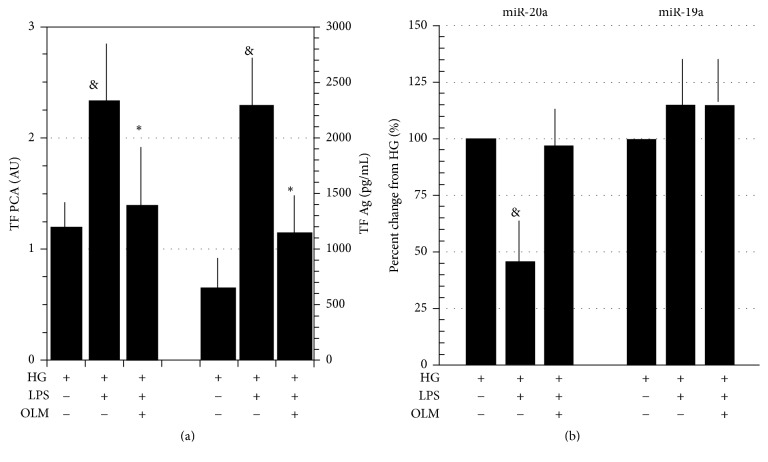
(a) LPS (100 ng/mL)-induced stimulation of TF PCA (left ordinate) (note the scale difference with the same parameter reported in Figure 2) and Ag (right ordinate) downregulation by AT1R blockade through Olmesartan (OLM, 10−6 M); PBMCs incubated in high glucose (HG, 50 mM). (b) Percent changes of miR-20a and miR-19a in LPS-stimulated PBMCs per se or in presence of OLM (10−6 M). Data expressed as percent changes from HG. Means ± SD, N = 9. &p < 0.001 LPS versus HG; ∗p < 0.001 LPS + OLM versus LPS.

