

Abstract
Having healthy adipose tissue is essential for metabolic fitness. This is clear from the obesity epidemic, which is unveiling a myriad of comorbidities associated with excess adipose tissue including type 2 diabetes, cardiovascular disease, and cancer. Lipodystrophy also causes insulin resistance emphasizing the importance of having a balanced amount fat. In cells, the mammalian target of rapamycin (mTOR) complexes (mTORC1 and mTORC2) link nutrient and hormonal signaling with metabolism, and recent studies are shedding new light on their in vivo roles in adipocytes. Here, we discuss how recent advances in adipose tissue and mTOR biology are converging to reveal new mechanisms that maintain healthy adipose tissue, and discuss ongoing mysteries of mTOR signaling, particularly for the less understood complex mTORC2.
Nutrient Sensing and Adipocyte Metabolism
The ability of biological systems to sense and respond to nutrient availability is crucial for survival. Consequently, animals are layered with multiple nutrient sensing mechanisms at the cell, organ, and organism level. Nutrient signaling biochemistry is best understood in cells where mTOR is the marquee intracellular kinase linking nutrient availability with metabolic control, and its deregulation is a hallmark of diabetes and cancer [1]. The functions of mTOR are split between two multi-subunit complexes, called mTOR complex 1 (mTORC1) and mTORC2 [Box 1]. The best-understood complex is mTORC1, which is a well-known engine of anabolic metabolism that functions downstream of an ancient amino acid sensing network superimposed by growth factor signaling in higher eukaryotes [Figure 1A][1, 2]. Its sibling, mTORC2 is less well-defined biochemically, but is emerging as a central regulator of glucose and lipid metabolism [Figure 1B]. The intracellular mechanics of mTOR signaling are being extensively defined in cell culture systems [3–6]; less understood are the in vivo organ-specific functions of mTOR and its role in organ-to-organ communication networks. Interest in mTOR is also driven by the fact that mTOR inhibitors are highly desirable pharmacological agents, particularly in oncology. Thus, understanding how mTOR’s diverse cellular functions are integrated at the organ and organism level is key challenge area.
Box 1. The mTOR Complexes: Composition and Structure.
mTOR forms two unique complexes called mTORC1 and mTORC2 that are defined by both common and specific regulatory subunits. The common subunits include a small WD-repeat containing protein called mammalian lethal with sec-13 (mLST8), and a DEP and PDZ domain containing protein called DEP domain-containing mTOR-interacting protein (DEPTOR). The function of mLST8 is unclear, and although tightly bound to mTOR, genetically deleting mLST8 phenocopies an mTORC2 KO in both mice and drosophila [48, 183]. DEPTOR is an mTOR inhibitor capable of interfering with both complexes [152, 184]. Regulator-associated protein of mTOR (RAPTOR) is an essential and unique subunit of mTORC1 that functions as a scaffold for assembly and for certain enzyme-substrate interactions. The 40kDa proline-rich AKT substrate (PRAS40) protein is also unique to mTORC1 and may be an inhibitory subunit targeted by AKT [21, 184–186]. The rapamycin-insensitive companion of mTOR (RICTOR) and mammalian stress-activated protein kinase interacting protein 1 (mSIN) subunits are unique and essential components of mTORC2. The protein observed with Rictor 1/2 (PROTOR 1/2) proteins are also unique to mTORC2 and their function is unclear [34, 149, 187]. Interestingly, several isoforms of mammalian SIN1 have been detected and at least three of them have been shown to define unique mTORC2 complexes with different sensitivities to growth factor stimulation [34].
Recent studies are beginning to unveil the 3D structures of the mTOR complexes. Multiple studies agree that mTORC1 exists in a dimeric complex, forming an elongated hollow structure with mLST8 and RAPTOR bound at the perimeter of the structure where RAPTOR helps stabilize mTOR the N-terminus [184, 188, 189]. High-resolution cryo-EM is also consistent with RAPTOR playing a role in substrate selectivity by reducing the width of the active site cleft to ~20Å [189]. The binding of the FKBP12-rapamycin complex to the FKBP12-rapamycin binding domain (FRB) further reduces the width to ~10Å, giving some insight on how rapamycin may limit mTORC1 activity [189]. Like mTORC1, mTORC2 (based on TORC2 in yeast) likely also exists in a dimeric rhomboid shape structure with a hollow center [190]. Here, Avo3/RICTOR, appears to have a scaffolding role in the stabilization of the complex [190]. A portion of Avo3/RICTOR localizes close to the FRB domain in, which could explain why mTORC2 is acutely insensitive to inhibition by the FKBP12-rapamycin complex. Furthermore, by truncating the C-terminal region of Avo3/RICTOR, the FRB is sufficiently exposed to allow this modified TORC2 complex to be susceptible to rapamycin [191]. Avo1/SIN1 localizes at the periphery of the complex and is may be important in tethering TORC2 to the plasma membrane Notably, RICTOR and mSIN1 have diverged more from their yeast counterparts than RAPTOR suggesting there may be species-specific regulatory functions.
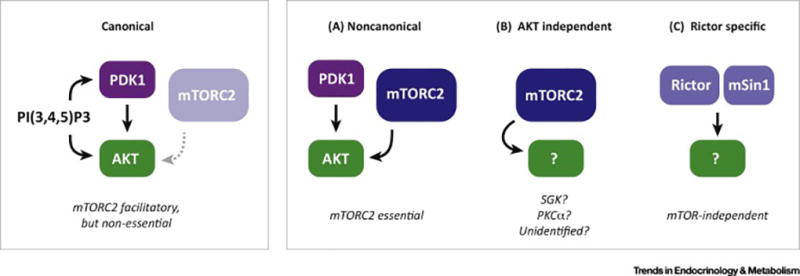
Figure 1. Current model of mTOR signaling pathways.
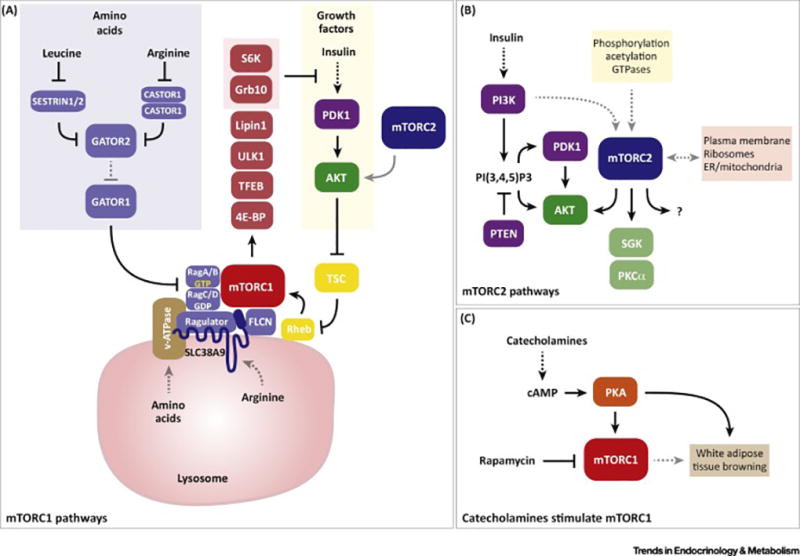
(A) Simplified view of mTORC1 signaling. Multiple inputs converge upon mTORC1; amino acids and growth factor signaling are the best described and are depicted here. In the cytoplasm, the Sestrin and Castor proteins function as sensors for leucine and arginine. In response to direct amino acid binding, they release a break on the Gator2 and Gator1 complexes, which promote mTORC1 localization to the lysosome by allowing activation of the Rag-GTPases. This requires RagA/B conversion to the GTP bound form and RagC/D conversion to the GDP bound form respectively. Insulin and other growth factors activate mTORC1 through AKT, which phosphorylates the TSC GAP complex and thereby activates the Rheb GTPase. mTORC2 directly phosphorylates AKT and is required for full AKT activity; however, many studies indicate that mTORC2 is not essential for mTORC1 activity. Therefore, we have illustrated the connection between mTORC2 and AKT with a grey arrow in this panel. The mTORC1 activator Rheb also resides at the lysosome. Thus, amino acid sufficiency enables growth factor-driven mTORC1 activation by putting mTORC1 in proximity to its activator. Mechanisms of amino acid sensing from within the lysosome through the Slc38A9 and v-ATPase have also been described. Once activated, mTORC1 phosphorylates many substrates involved in anabolic metabolism and cell growth. Some mTORC1 targets such as S6K and GRB10 can feedback and inhibit insulin signaling.
(B) Simplified view of mTORC2 signaling, which is less well understood. mTORC2 directly phosphorylates AKT at S473 in a C-terminal hydrophobic motif, which along with T308 phosphorylation by PDK1 in the kinase domain, is required for full AKT activity. These phosphosite locations correspond to AKT1; however, AKT exists in three isoforms (AKT1, AKT2, and AKT3) each containing structurally identical phosphorylation sites that are all thought to be regulated similarly by mTORC2. The classic model is that AKT is activated at the plasma membrane and this is facilitated by PI3K-generated PI(3,4,5)P3, which recruits PDK1 and AKT to the membrane through their PH domains. Traditionally, S473 phosphorylation was thought to be essential for subsequent T308 phosphorylation, which is critical for AKT kinase activity. However, genetic studies showed that a certain level of T308 phosphorylation can occur independently of S473 and that this is sufficient for AKT activity towards many downstream substrates including the TSC-Rheb-mTORC1 pathway. Thus, the essential role of AKT-S473 phosphorylation remains unclear. mTORC2 can also phosphorylate the SGK and PCKα kinases, which like AKT belong to the AGC kinase family. Unlike the case for AKT, mTORC2 is thought to be essential for all PKCα and SGK activity. It is unclear whether there are additional direct mTORC2 substrates though this has been speculated. Many upstream inputs to mTORC2 and potential intracellular sites of localization of mTORC2 have been described although a unifying mechanism of activation remains elusive. (C) Recent studies suggest that catecholamines might also stimulate mTORC1 through PKA signaling, and that this is important form promoting the browning of white adipose tissue.
As the obesity epidemic grows, so does interest in adipose tissue biology. Long considered a passive energy sink, adipose tissue is now recognized as a major nutrient sensing and endocrine organ that responds to circulating hormones (e.g. insulin, catecholamines) and metabolites (e.g. lipids, glucose), and secretes them (e.g. free fatty acids, glycerol, adipokines, lipokines) to regulate energy balance. The evolution of the adipocyte was probably a critical adaptation allowing early mammals to better tolerate bouts of famine. Today, adipocytes are perhaps better known for their ability to protect the body against lipotoxicity caused by over-nutrition. As obesity and its comorbidities are now epidemic, understanding adipose tissue biology is critical in the effort to combat today’s major medical challenges including type 2 diabetes, cardiovascular disease, and cancer.
Adipose tissue is often classified as either white adipose tissue (WAT) or brown adipose tissue (BAT), although this is an oversimplification as mounting evidence indicates different depots, and even individual adipocytes within depots, are heterogeneous with respect to development and function [7–9]. Both WAT and BAT depots are found in several anatomically defined locations in nearly all mammals [Figure 2, Middle]. WAT is unique in its incredible growth potential and energy storing capacity (as lipid), which is released by the process of lipolysis when dietary nutrients are unavailable. Some WAT depots, such as the subcutaneous WAT, can also readily switch between storing and burning energy e.g. in response to prolonged cold exposure or β-adrenergic receptor stimulation, which is often referred to as the “browning” of WAT based on shared characteristics with BAT [10]. The primary function of BAT is to generate heat (thermogenesis), which is an energy expending process mediated by uncoupling protein 1 (UCP1) [11, 12]. It recently became widely appreciated that BAT is present in adult humans and this has intensified interest in understanding brown adipocyte biology in parallel with the idea that stimulating BAT activity therapeutically may be a way to combat obesity or hyperglycemia and hyperlipidemia [13]. As appreciation for adipocyte dynamics grows, so has interest in understanding how mTOR controls them. In the following sections, we will explore recent studies that are advancing our understanding of mTOR signaling in adipocytes with an emphasis on in vivo work, and summarize key challenge areas for the future.
Figure 2. Adipose tissue specific Raptor (mTORC1) or Rictor (mTORC2) ablation causes severe but different metabolic complications.
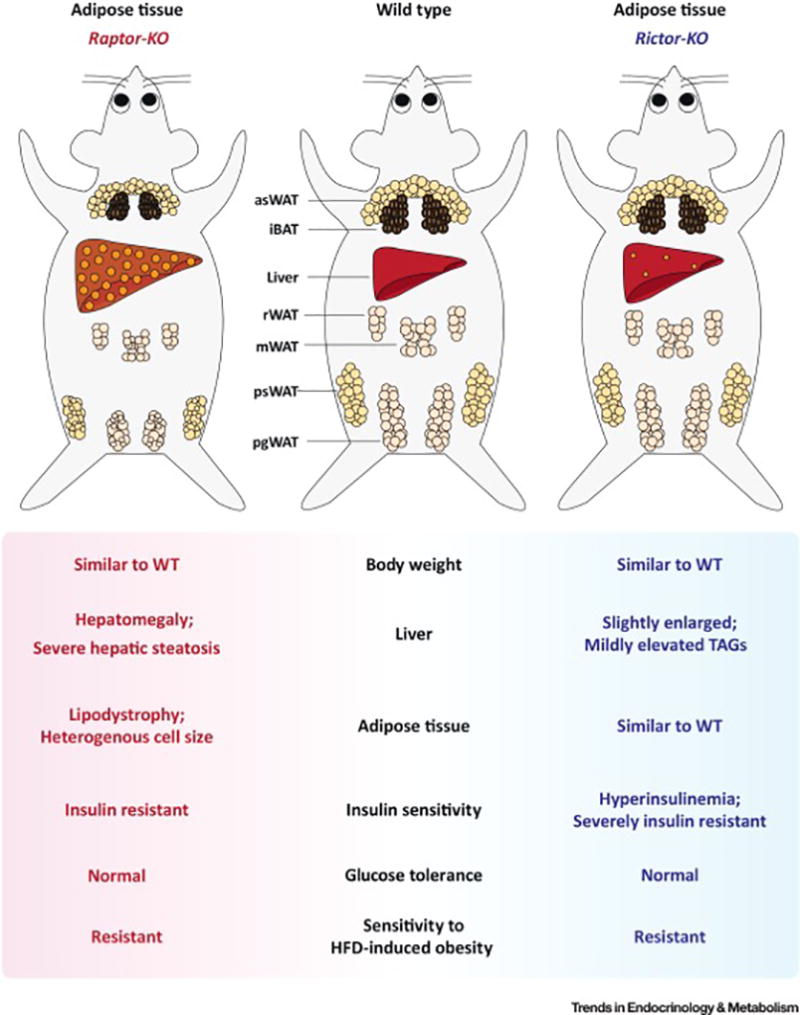
(Left) Congenital adipose tissue-specific Raptor/mTORC1 loss in mice progressively causes generalized lipodystrophy. At the cellular level, the depots are composed of heterogeneous adipocytes varying dramatically in cell size. Adipose tissue Raptor KO mice also have metabolic defects in other organs such as hepatomegaly, severe hepatic steatosis, insulin resistance, hyperphagy, and impaired gut lipid absorption.
(Right) Adipose specific Rictor/mTORC2 loss in mice has little effect on fat morphology under standard dietary conditions; however, these mice develop profound insulin resistance associated with hyperinsulinemia. These mice also have mild hepatomegaly and hepatic lipid accumulation. Moreover, their livers are insulin resistant and have elevated hepatic glucose production; however, insulin stimulated muscle glucose uptake is normal. Interestingly, both mouse models are resistant to high fat diet (HFD) induced obesity. [Abbreviations] iBAT, interscapular brown fat; asWAT, anterior subcutaneous WAT; psWAT, posterior subcutaneous WAT; mWAT, mesenteric WAT; rWAT, retroperitoneal WAT; pgWAT, perigonadal WAT.
The mTOR Signaling Basics
The complexity of mTORC1 signaling has been extensively described [1, 14]. To summarize, mTORC1 is mainly activated by combined inputs from amino acid sensing pathways and growth factor signaling such as the insulin and insulin like growth factor 1 (IGF1) pathways [Figure 1A]. Many additional inputs ranging from the energy sensing AMP-activated protein kinase (AMPK) signaling pathway to cellular stresses like hypoxia fine-tune mTORC1 activity essentially to optimize (or restrict) anabolic growth in coordination with the cell's nutrient and energy availability. Recent breakthroughs in understanding the amino acid sensing mTORC1 inputs reveal that cytoplasmic levels of leucine and arginine are directly sensed by the Sestrins and Castor proteins respectively, which promote the GTP loading of a small GTPase called RagA/B. The mechanistic link between Senstrins/Castor and RagA/B activation is poorly understood but involves two large protein complexes, the Gator2 (Mios, Seh1L, WDR24, WDR59, Sec13) and Gator1 (DEPDC5, Nprl2, Nprl3) complexes. Glutaminolysis, the breakdown to α-ketoglutarate, might also help facilitate leucine-dependent RagB loading [15]. RagA/B GTP loading promotes mTORC1 localization to lysosomes where it encounters its activator, the Rheb-GTPase. By mechanisms less clear, amino acids can also signal to mTORC1 from within the lysosomes through Slc38A9 and the v-ATPase [16, 17]. Elucidating the amino acid inputs to mTORC1 is an ongoing and exciting area of research in part because it may be possible to manipulate mTORC1 activity pharmacologically with amino acid analogs.
At the lysosome, Rheb directly activates mTORC1 [18–20]. Rheb activity is controlled by the TSC complex (TSC1, TSC2, TBC1D7), a GAP that is inhibited by insulin/AKT signaling forming the main convergence point between growth factor and amino acid regulation of mTORC1 [21, 22]. There are several known mTORC1 substrates that collectively promote anabolic growth [Table 1] including the classic mTORC1 effectors S6K1 and 4E-BP1, which regulate protein synthesis [1] Other effectors include Ulk1, a kinase involved in autophagy [23], and TFEB, a transcription factor protein also important in autophagy through its role in lysosomal biogenesis [24]. Additional evidence exists for mTORC1 being involved in lipid metabolism through phosphorylation of Lipin1 [25, 26], and Grb10, an adaptor protein in the insulin receptor pathway that may play a role in regulating lipolysis and thermogenesis in adipose tissue [27, 28]. Some substrates, such as S6K1 and Grb10 can also inhibit insulin signaling forming powerful negative feedback loops allowing for tight control of insulin/IGF signaling [29, 30].
Table 1.
Best described mTOR complex substrates
| Complex | Substrates | Reported Functions | Ref |
|---|---|---|---|
| mTORC1 | 4E-BP1 | Translation initiation; Cap-dependent translation | [171] |
| S6K | AGC family kinase that functions in protein synthesis, cell survival, and suppression of insulin/IGF signaling | [172] | |
| ULK1 | Autophagy and cellular starvation response; regulates autophagosome formation. | [173, 174] | |
| TFEB | Transcription factor; regulates lysosome biogenesis | [24] | |
| LIPIN1 | Triglyceride synthesis; may regulate SREBP-mediated expression of lipid synthesis genes | [25, 26] | |
| GRB10 | Negative regulator of receptor tyrosine kinase (RTK) signaling including insulin and IGF1 receptor signaling. | [27, 28] | |
| mTORC2 | AKT | AGC family kinase that functions in diverse signaling pathways that control cell growth, proliferation, survival and glucose/lipid metabolism | [6] |
| SGK1 | AGC family kinase that functions in sodium homeostasis and cellular stress responses | [145] | |
| PKCα | AGC family kinase that functions in diverse signaling pathways including cell migration, proliferation, apoptosis, and adhesion. | [45, 48, 126, 175] |
Compared to mTORC1, the mTORC2 signaling pathway is less understood. The conventional view is that mTORC2 collaborates with another kinase called PDK1 to phosphorylate and fully activate AKT (an AGC family kinase) in response to insulin and other growth factors that activate PI3-kinase [Figure 1B]. "AKT" exists in three isoforms (AKT1, AKT2, & AKT3) expressed from distinct loci. They share functional domains, including a plekstrin homology (PH) domain, kinase domain, and C-terminal hydrophobic motif. While AKT1 and AKT2 are expressed ubiquitously, AKT2 is more highly expressed in insulin target tissues, and AKT3 is more highly expressed in the brain and testes. [31–33]. All three isoforms are predicted to be regulated similarly by mTORC2. Classic AKT activation occurs at the plasma membrane and is mediated by PH-domains present both in AKT and PDK1, which co-localizes them at PI(3,4,5)P3 binding sites presumably in close proximity to mTORC2. One mTORC2 subunit (mSIN1) contains a PH-like domain that may function in this regard [34, 35] [Box 1]. Mechanistically, PDK1 phosphorylates AKT1 in a critical activation site at T308 (T309 in AKT2) in the activation loop of the kinase domain, while mTORC2 phosphorylates AKT on S473 (S474 in AKT2) in the C-terminal hydrophobic motif [6, 36]. Both T308 and S473 phosphorylation are considered to be indispensable for full activation of AKT [37]. However, in certain settings, T308 phosphorylation alone is sufficient for AKT activity to downstream effectors [38–44]. mTORC2 also promotes the co-translational phosphorylation of AKT1 at T450 (T451 in AKT2), which is a growth factor insensitive site of unclear function [45–47]. Thus, the exact functional significance of mTORC2-mediated phosphorylation of AKT (S450/S473) remains incompletely understood. Several genetic studies in fact have shown that many classic AKT effector pathways (including the TSC/Rheb/mTORC1 pathway) appear to be regulated normally in the absence of mTORC2 [38, 39, 44, 48, 49] indicating major gaps exist in our understanding of the mTORC2-AKT relationship (discussed below). Two other AGC family kinases are also mTORC2 substrates, SGK and PKCα [50, 51], but the broad significance of their regulation by mTORC2 in vivo is not as well defined. In addition to the phosphorylation sites described earlier [5, 46, 52, 53], several other post translational modifications of mTORC2 subunits have been identified such as acetylation sites [54, 55], but a concrete unifying picture of mTORC2 upstream activation remains elusive. Clues are also surfacing regarding the localization of mTORC2, although a unifying and definitive mechanism has also not emerged. These mysteries and recent insights will be discussed in more detail below.
mTORC1 in White Adipocytes
While mTORC1 is a critical regulator of cell growth and anabolic processes in cells, its tissue-specific roles in adipose tissue have not been extensively defined. Because mTOR is the catalytic subunit of both mTORC1 and mTORC2, tissue specific genetic analysis of each complex relies upon the selective deletion of essential regulatory subunits using Cre-Lox technology. For mTORC1, this is achieved by deleting Raptor [Box 1]. A previous genetic study of mTORC1 in adipose tissue utilized the aP2-Cre driver to delete Raptor [56]; however, aP2-Cre has fallen out of favor due to its inefficient targeting of adipocytes and “off-target” expression e.g. in endothelial and brain cells [57–59]. It is generally accepted now that Adiponectin-Cre is more specific and efficient at targeting mature adipocytes (though all Cre drivers should be used with caution). Adiponectin-Cre also targets all mature adipocytes, including both brown and white, therefore it cannot be used to conclusively distinguish the depot independent functions of a specific target.
Using Adiponectin-Cre to delete Raptor (RaptorAdipoq-Cre), a recent study finds that mice lacking mTORC1 in all mature adipocytes develop lipodystrophy [Figure 2, Left] [60]. Interestingly, although mTORC1 was ablated congenitally in this model, WAT growth appears normal until postnatal day 14, indicating mTORC1 is dispensable in very early adipocytes. However, as the mice age, their adipose depots fail to expand either when consuming a standard chow diet or when challenged with high fat diet (HFD). Curiously, the adipocytes that do form in RaptorAdipoq-Cre mice are heterogeneous in size following a bimodal distribution pattern in which they are either larger or smaller than normal. Similar to human lipodystrophy disorders, RaptorAdipoq-Cre mice also develop systemic metabolic disease including hepatomegaly, hepatic steatosis, insulin resistance, and a voracious appetite, which is more severe on HFD. Moreover, RaptorAdipoq-Cre mice appear to have normal energy expenditure but develop a dietary lipid absorption defect. These results are markedly different from RaptoraP2-Cre mice, which do not develop lipodystrophy or hepatic steatosis, and in fact have a mild metabolic benefit [56].
Growth factor signaling regulates mTORC1 activity through a pathway different from amino acids, and proteomic studies suggest that the global phosphorylation response to insulin is largely mTOR dependent [27]. Indeed, it was reported recently that mice lacking the insulin receptor (IR) in mature adipocytes (IRAdipoq-Cre mice) are phenotypically similar to RaptorAdipoq-Cre mice [61], while a fat-specific IR/IGFR double KO model results in a complete loss of adipose tissue and more severe metabolic disease [61]. However, knocking out all adipocyte AKT activity by simultaneously deleting AKT1 and AKT2 (i.e. AKT1;AKT2Adipoq-Cre double KO mice) also causes more severe lipodystrophy compared to RaptorAdipoq-Cre mice [62] indicating other insulin/AKT effectors in addition to mTORC1 are also critical for adipose tissue maintenance. Alternatively, losing mTORC1-dependent feedback inhibition of AKT might preserve some adipose tissue in the absence of Raptor. Consistent with the latter possibility, overexpressing the mTORC1/2 complex subunit DEPTOR promotes adipogenesis by dampening mTORC1 activity, which reduces mTORC1-mediated feedback inhibition of insulin signaling, and promotes AKT-PPARγ activity [63]. A similar effect was observed in cell culture where a conditional knockdown approach in 3T3-L1 cells that partially inhibits mTOR activity promotes adipogenesis by increasing AKT signaling [64]. One prediction of these observations is that inhibiting both mTORC1 and mTORC2 (because it phosphorylates AKT) might result in more severe loss of adipose tissue. However, mTORAdipoq-Cre mice are phenotypically similar to RaptorAdipoq-Cre mice [65] suggesting that mTORC2-independent AKT signaling may promote the maintenance of some, albeit smaller, fat depots in the RaptorAdipoq-Cre mice
The molecular basis for the underlying disease progression in RaptorAdipoq-Cre mice is unknown. Given the many downstream mTORC1 targets, there are multiple possibilities that are not necessarily mutually exclusive. Indeed, many mTORC1 effectors have reported roles in adipocytes [66, 67]. Because mTORC1 suppresses autophagy, one possibility is that Raptor loss in fat promotes lipid degradation by “lipophagy” [68]. In fact, from a human perspective, some types of congenital generalized lipodystrophy (CGL), may occur in part due to mutations that affect autophagic lipid degradation. For example, CGL has been linked to mutations in 1-Acylglycerol-3-Phosphate O-Acyltransferase 2 (AGPAT2) and SEIPIN, also known as Bernardinelli-Seip congenital lipodystrophy type 2 protein (BSCL2), both endoplasmic reticulum membrane proteins involved lipid biosynthesis that may also play a role in lipophagy [69, 70]. Additionally a recent study found that deleting AGPAT2 in adipose tissue increases autophagic structures. Interestingly, other recent work finds that SEIPIN can interact directly with both AGPAT2 and the mTORC1 substrate Lipin1 [71]. This potentially links human lipodystrophies and mTORC1 signaling as it has been shown that mTORC1 may regulate lipin1 localization and activity [25, 26]. Notably, mTORC1 is inhibited congenitally in RaptorAdipoq-Cre mice, therefore it is difficult to determine what is a primary consequence of mTORC1 loss versus an adaptation; thus, an important future question is whether acute mTORC1 ablation in adipocytes for example with tamoxifen or doxycyclin inducible Cre drivers has a similar effect.
mTORC1 in Brown Adipocytes and the “Browning of WAT”
Recent studies have also begun looking at the role of mTORC1 in BAT. Using RaptorAdipoq-Cre mice, one study looked carefully at how losing mTORC1 in all mature adipocytes affects BAT adaptation to cold [72]. In wild type mice, prolonged cold challenge significantly increases mTORC1 activity in BAT through sympathetic signaling and this correlates with increased BAT mass, mitochondrial biogenesis, and oxidative metabolism. Without Raptor, BAT cannot expand or metabolically adapt to cold. Deleting Raptor only in BAT with Ucp1-Cre (RaptorUcp1-Cre) also reduces BAT mass and lipid content [60], arguing that this is likely a tissue-autonomous effect. Further studies using BAT specific Cre drivers are needed to confirm the BAT-specific mTORC1 functions.
When mice are exposed to severe cold for prolonged periods of time, or treated with βAR agonists, some depots can metabolically reprogram to become characteristically more similar to brown adipocytes, for example they induce UCP1 expression [73, 74]. This is often referred to as the browning of WAT and may have therapeutic potential in humans by functioning as a glucose and energy sink in the setting of diabetes/obesity[75]. In two independent studies, it was recently found that the mTOR inhibitor rapamycin blocks WAT browning [76, 77]. Interpreting the effect of rapamycin is complex, because it is systemically delivered, it only partially inhibits mTORC1 [78, 79] and it can inhibit also mTORC2 following prolonged exposure [80]. To address the specificity of rapamycin’s effect in vivo, both studies used RaptorAdipoq-Cre mice to show that Ucp1 cannot be induced by cold [76, 77] or βAR3-agonists [76, 77] without functional mTORC1 in WAT. In agreement, another recent study finds that activating mTORC1 in WAT by deleting its negative regulator TSC1 (Tsc1Adipoq-Cre mice) elevates Ucp1, PGC-1α, and PPARα levels [81]. In cultured adipocytes, βAR agonists were also shown to stimulate S6K but not AKT phosphorylation, suggesting a link between mTORC1 and protein kinase A (PKA) signaling [77]. Indeed, a PKA inhibitor blocked this effect and this was attributed to direct phosphorylation of mTORC1 (on both mTOR and Raptor) by PKA [Figure 1C]. Thus, in addition to its regulation by insulin, a well-known antagonist of PKA signaling, mTORC1 might also respond to catecholamines in adipocytes. Concurrently, other studies have shown that adrenergic stimulation may also stimulate mTORC2 and AKT signaling in certain settings suggesting that catecholamine-stimulated mTOR activity may be complex [72, 82]. Defining how PKA activates mTOR and what downstream mTOR-dependent pathways promote browning is an important future goal.
mTORC2 in White Adipocytes
To specifically eliminate mTORC2 function in vivo the Rictor or Sin1 subunits are typically targeted, with most studies choosing to delete Rictor. Two earlier reports using aP2-cre to delete Rictor observed a significant increase in lean tissue mass in these mice but normal adipose tissue mass and morphology [38, 39]. Increased lean tissue mass was attributed to high levels of circulating IGF-1 generated by adipose tissue and liver leading to the conclusion that mTORC2 in adipose tissue regulates whole body growth [38]. Interestingly, this was not observed in a recent study using Adiponectin-Cre to target Rictor [41]. The discrepancy is likely due to the inefficient and off-target effects of the aP2-Cre as described above. However, there is some phenotypic overlap, as both models have insulin resistance, defects in adipocyte glucose uptake, elevated lipolysis, and mild steatosis, with the RictorAdipoq-Cre mice generally exhibiting the more severe phenotype. RictorAdipoq-Cre mice additionally have slightly enlarged livers and are resistant to weight gain on HFD, which was not observed with RictorAp2-Cre [41]. Under standard dietary conditions RictorAdipoq-Cre mice have normal white and brown adipose tissue mass and distribution, normal adipocyte size, and normal circulating lipid levels; however, they are hyperinsulinemic and severely insulin resistant [Figure 2] [41]. Based on data from the glucose clamp technique, the RictorAdipoq-Cre mice are specifically defective in hepatic glucose regulation because insulin-mediated suppression of hepatic glucose production (HGP) is impaired, while insulin-stimulated muscle glucose uptake is normal. These findings indicates that mTORC2 functions in WAT to control glucose and lipid handling and to regulate production of an extra hepatic signal that communicates to the liver to control glucose homeostasis.
Mechanistically, there are several possibilities that are not necessarily mutually exclusive that might explain how mTORC2 loss in adipose tissue impairs liver metabolism [Figure 3]. Firstly, RictorAdipoq-Cre WAT is defective in expressing the major regulators of de novo lipogenesis (DNL), mainly ATP citrate lyase (ACLY), Acetyl-CoA carboxylase (ACC), fatty acid synthase (FASN), and elongation of very long chain fatty acids protein 6 (Elovl6) [41]. This may be due to low charbohydrate responsive element binding protein-alpha (ChREBPα) transcriptional activity, which transcribes the ChREBPβ isoform—a potent inducer of DNL gene expression—from an alternative start site [83]. ChREBPβ activity may drive production and secretion of insulin sensitizing bioactive lipids (or lipokines) [83–85], which could be reduced in RictorAdipoq-Cre mice. Secondly, insulin fails to regulate lipolysis in fasted RictorAdipoq-Cre mice [39, 41]. Elevated lipolysis could increase lipid flux to the liver, which was reported recently to promote HGP independently of insulin signaling [53]. Thirdly, RictorAdipoq-Cre mice have reduced glucose uptake into adipocytes and this could increase carbohydrate flux to the liver, which was recently shown to promote hepatic ChREBP-mediated glucose and lipid production independently of insulin signaling [86]. The hepatic levels of ChREBPβ but not SREBP1 are in fact elevated in RictorAdipoq-Cre livers. Fourth, RictorAdipoq-Cre mice have hyperinsulinemia, which could drive hepatic insulin resistance. This brings up the additional possibility that adipose tissue and liver might not directly communicate but rather an intermediary tissue could be involved. Finally, deleting Rictor in adipose tissue globally remodels the lipid composition of both the fat and liver in a similar way, which is also similar to how HFD remodels hepatic lipid composition [41, 87, 88] and this could directly impact many hepatic lipid-signaling pathways.
Figure 3. Metabolic and Transcriptional pathways in white adipocytes that are regulated by mTORC2.
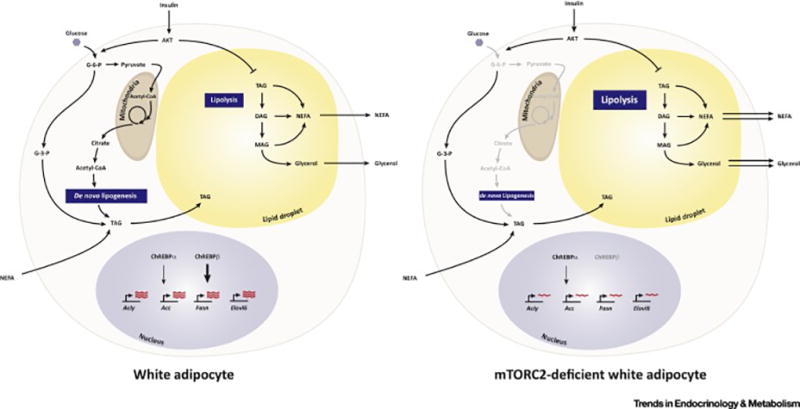
(Left) In normal white adipocytes, insulin simulates glucose uptake and its immediate conversion to glucose-6-phosphate (G-6-P). Some G-6-P is converted to pyruvate, which enters the mitochondria, and is converted to acetyl-CoA for entry into the TCA cycle. Some G-6-P is converted to glyceraldehyde-3-phosphate, which forms the glycerol backbone for triacylglycerol (TAG) synthesis. TAGs are stored in lipid droplets. When nutrients are plentiful, for example after a meal, TAGs are synthesized de novo from acetyl-CoA, which is exported from the mitochondria as citrate. The major enzymes that drive de novo lipogenesis, ATP-citrate Lyase (ACLY), ACC (Acetyl-CoA Carboxylase), FASN (Fatty Acid Synthase), and Elovl6 (Elongation of Very Long Chain Fatty Acids Protein 6) are transcriptionally regulated by the ChREBPα/β transcription factors. ChREBPβ is a more potent activator that is transcribed by ChREBPα in response to glucose uptake and metabolism. Non-esterified fatty acids are also taken up from circulation and converted to TAGs. When circulating nutrients are low, for example when fasting, TAGs and hydrolyzed through the process of lipolysis producing NEFAs and glycerol for release into circulation.
(Right) In vivo genetic studies indicate that in the chronic absence of mTORC2 in white fat, glucose uptake and de novo lipogenesis are reduced and this correlates with lack of Chrebpβ mRNA expression and a large reduction in expression of its target genes, acly, acc, fasn, and elovl6. Whether G-3-P production or NEFA fatty acid uptake and TAG conversion is impaired is not known. In addition, lipolysis is elevated. Insulin normally functions to promote glucose uptake and suppress lipolysis and these effects are thought to be largely mediated by the mTORC2-subsrate AKT. However, insulin-stimulated AKT signaling appears to be intact in mTORC2-deficient adipocytes. Thus, the mechanism by which mTORC2 loss alters adipocyte glucose uptake and metabolism remains unclear.
Whether decreased glucose uptake, decreased ChREBP activity and DNL gene expression and failure to suppress lipolysis reflect different mTORC2 outputs or a common pathway is currently unclear. Resolving this will be important to understanding the role of mTORC2 in organ communication networks. Moreover, the fact that mTORC2 promotes adipose tissue glucose uptake and ChREBP activity, which is tightly linked to insulin sensitivity, is intriguing because as may provide rationale for developing mTORC2 activators to treat insulin resistance.
Another unanswered question is how downstream mTORC2 signaling controls adipocyte metabolism. A simple biochemical explanation for the aforementioned phenotypes is that RictorAdipo-Cre mice have a defect in adipose tissue AKT signaling. Surprisingly however, AKT signaling to many of its classic substrates is normal including to AS160 (Akt substrate of 160 kDa), which regulates Glut4 translocation [89, 90], FoxO1 (Forkhead box protein O1), a transcription factor that regulates stress response and metabolism genes [91], GSK3β (Glycogen synthase kinase 3 beta), which regulates glycogen and lipid metabolism [92], and PRAS40 (Proline-rich akt-substrate 40), a negative regulator and component of mTORC1 [20, 93]. As mentioned above, the AKT1/AKT2Adipoq-Cre mice also develop severe lipodystrophy [62], quite different from RictorAdipo-Cre mice, clearly illustrating that mTORC2 is not essential in vivo for all AKT functions in adipose tissue. Thus it is interesting that RictorAdipoq-Cre mice have such profound metabolic complications despite seemingly normal AKT signaling.
Importantly, it is difficult with chronic loss-of function models to separate the primary defect from what might be an adaptation, and the use of inducible KO models may help address this. However, an interesting point is that the adipose tissue in RictorAdipoq-Cre mice is characteristically in a state of “selective insulin resistance” in that insulin-stimulated glucose uptake is decreased, but insulin stimulated AKT signaling is normal—which is a poorly understood paradox that is also associated with mammalian obesity models [88, 94–98]. For example, HFD-alone decreases insulin-stimulated glucose uptake and DNL gene expression independent of changes in AKT signaling [41, 99], raising the intriguing possibility that HFD could target the mTORC2-ChREBP-DNL pathway to cause insulin resistance or reduce adipose tissue expansion on HFD. In sum, it is clear that there are major gaps in our understanding of mTORC2 in AKT signaling and metabolic control. Possible mechanisms driving the RictorAdipoq-Cre phenotype are discussed below
mTORC2 in Brown Adipocytes
In classic brown adipocytes, mTORC2 is emerging as a critical mediator of the thermogenic program, though the mechanism is currently controversial [Figure 4]. Ablating Rictor with Myf5-Cre, which targets brown adipocyte precursors in development [40], results in small BAT depots associated with reduced lipid storage, decreased DNL gene expression, and increased mitochondrial size and oxidative capacity. Similar to what was observed in WAT lacking mTORC2, AKT signaling also appears to be normal in Rictor-deficient BAT, as well as in cultured brown adipocytes in which mTORC2 is more acutely inhibited [40]. Another recent study also finds that mTORC2 promotes glucose uptake in cultured brown adipocytes in an AKT-independent manner through regulating GLUT1 transporter translocation [100]; this needs further investigation in vivo. RictorMyf5-Cre mice are also resistant to diet-induced obesity and hepatic steatosis when living at thermoneutrality, an environmental condition more relevant to human metabolism [12, 41, 101–104]. This correlates with increased Ucp1 expression in classic BAT [40]. However, because Myf5-Cre expresses early in development, a developmental programming effect cannot be ruled out in this model. Moreover, Myf5-Cre also targets skeletal muscle and several white adipocytes, bones, and neurons and thus targeting of the non-BAT Myf5-derived tissues could also potentially complicate interpreting this phenotype [7, 105, 106]. Nevertheless, these findings suggest that inhibiting mTORC2 in BAT may stimulate thermogenesis under certain conditions.
Figure 4. Model of brown adipocyte pathways regulated by mTORC2.
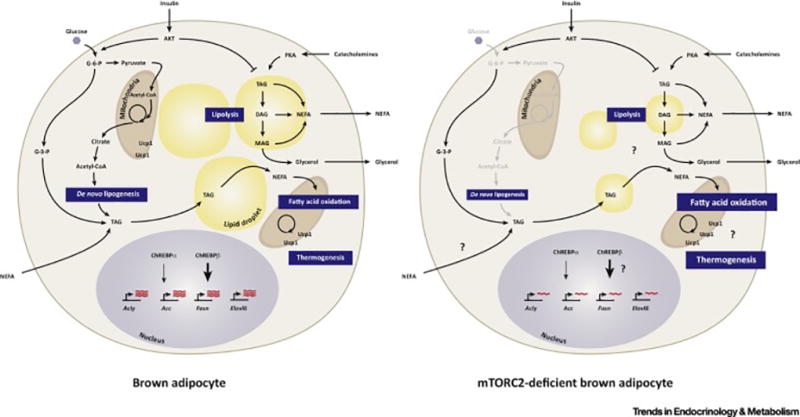
(Left) Brown adipocytes are specialized for adaptive thermogenesis, which is mediated by their unique expression of the mitochondrial localized uncoupling protein 1 (Ucp1) protein. Compared to white adipocytes, active brown adipocytes characteristically have multiple smaller lipid droplets (i.e. multi-locular), more mitochondria, increased glucose and lipid uptake, increased lipolysis and lipogenesis, and elevated fatty acid oxidation.
(Right) Mice in which the mTORC2 subunit Rictor is conditionally deleted in Myf5+ precursor cells (e.g. with Myf5-Cre), which give rise to the major brown fat depots in mice, results in decreased BAT size, decreased markers of lipogenesis, smaller lipid droplets, and increased characteristics of fatty acid oxidation and thermogenesis. This suggests mTORC2 loss in BAT may reprogram BAT metabolism in favor of energy expenditure over energy storage. However, Myf5+ precursors also give rise to skeletal muscle cells and many other non-brown adipocyte cell types, and moreover, Myf5-Cre deletes Rictor early in development prior to BAT specification, so many questions remain as to the specificity of this phenotype and the role that BAT mTORC2 plays in glucose and lipid uptake, ChREBP activity, lipolysis, and UCP1-mediated thermogenesis.
A seemingly contradictory study suggests mTORC2 is essential for BAT thermogenesis [82]. A caveat of this study is that it uses the RictoraP2-Cre mice; nevertheless, it reports that cold and β-adrenergic signaling stimulate AKT-S473 in brown adipose tissue in an mTORC2-dependent manner, that RictoraP2-Cre mice have slightly lower body temperature even under standard housing conditions (i.e. 22°C), and that they cannot maintain euthermia during an acute cold challenge (i.e. 4°C). Morphologically, the BAT in RictoraP2-Cre mice is quite different from that of RictorMyf5-Cre mice, exhibiting normal mass and lipid content [82]. Unlike RictorMyf5-Cre mice, mitochondria size and function also appear normal in RictoraP2-Cre mice. However, RictoraP2-Cre BAT has a glucose uptake deficiency that was attributed to decreased AKT signaling to hexokinase 2 [82]. Resolving the exact function of mTORC2 in BAT will require the generation of BAT-specific conditional KO mice for example with Ucp1-Cre.
The role of mTORC2 in WAT browning is currently unclear. A potential clue may come from the RictorMyf5-Cre mice, in which several white adipocytes in anterior subcutaneous and perirenal WAT depots also lack Rictor [40]. In this model the Rictor-deficient white adipocytes are small and multilocular, characteristics that are similar to brite/beige adipocytes. However, it cannot be ruled out that this phenotype is linked to an adipocyte developmental defect. Future studies need to address this.
Future Challenges
mTORC1: Amino Acid Sensing in vivo
A breakthrough in understanding mTORC1 regulation by amino acids (AAs) was the discovery that the Rag-GTPases promote mTORC1 localization to the lysosome in response to AA sufficiency, a necessary step that enables mTORC1 activation by Rheb, which also resides at the lysosome [Figure 1A] [107, 108]. The Rag-GTPases are tethered to the lysosome by the 5-subunit Ragulator complex (Lamtor 1–5), and ongoing efforts to fill in the gaps between AAs and Rag-GTPase activity suggests multiple upstream AA sensing mechanisms likely exist. For example, as discussed above, leucine and arginine interact directly with cytoplasmic Sestrin and Castor proteins respectively, and working in parallel, this activates the Rag-GTPases by removing an inhibitory signal mediated by the GATOR2-GATOR1 complexes [Figure 1A][3, 109]. In addition, there is an intra-lysosomal arginine sensing mechanism working through the SLC38A9 complex, and another working through the lysosomal v-ATPase [16, 110]. Glutamine also appears to regulate mTORC1 activity by a Rag-independent mechanism [111]; and additional AA sensing pathways likely exist [112, 113].
Adipose tissue is an important site of BCAA (leucine, isoleucine, valine) metabolism [114, 115] and BCAAs are carbon sources for lipogenesis during adipocyte differentiation in vitro [116]. Moreover, high serum BCAAs are associated with obesity and insulin resistance [117]. One model is that high BCAA levels could promote mTORC1 activity in peripheral tissues, which would feedback inhibit insulin signaling, and thereby cause insulin resistance [Figure 1A][117]. It is also reported that arginine can both enhance BAT growth and substrate oxidation and reduce WAT mass [118, 119]. However, whether AA sensing pathways to mTOR are critical for adipocyte function in vivo has not been explored. Genetic studies in mice show that RagA is essential for embryonic development and primary cells isolated from these mice show normal mTORC1 regulation by insulin but not AAs [120]. Moreover, RagA deletion in the liver greatly reduces mTORC1 activity in response to refeeding following and overnight fast [120]. These studies also revealed that RagB can partially compensate for loss of RagA. However, deleting both RagA and RagB in cardiomyoctes results in lysosomal defects that are seemingly independent of changes in mTORC1 activity [121]. Thus, a major challenge area for the future is to define the tissue-specific significance of the mTORC1 AA sensing pathways particularly in adipocytes.
mTORC2: Regulation and Downstream Functions
It is clear from in vivo studies that deleting Rictor globally in mature adipocytes profoundly affects both cell autonomous and systemic metabolism [38, 39, 41]; similar conclusions were drawn from liver Rictor knockout mice [122, 123]. However, fitting these observations into new paradigms of metabolic control is challenging because much less is understood about the biochemical regulation, structure, and function of mTORC2 [also see Box 1]. For additional opinions on this topic, we refer readers to an excellent recent review that also encompasses S. cerevisiae TORC2 [124]. One of the major challenges to understanding mTORC2 is that it is insensitive to acute rapamycin treatment, and no selective mTORC2 inhibitors currently exist. Developing new strategies to acutely and selectively target the complex is an important goal and sorting out the complexities of mTORC2 pathway biochemistry is a major challenge area for the future. Therefore, a brief discussion of mTORC2's biochemical mysteries is warranted.
Upstream Regulation
While upstream signals feeding into mTORC1 are well entrenched in the literature, the upstream signals regulating mTORC2 are more ambiguous. As indicated earlier, several post-translational modifications of mTORC2 subunits have been reported, including phosphorylation sites [5, 46, 52, 53] and acetylation sites [54, 55]. Some of these posttranslational modifications correlate with changes in mTORC2 activity in certain cells [5, 46, 52, 54, 55]. However, a unifying picture of their functional significance has yet to emerge. It is also unclear what cellular signals mTORC2 might sense, or whether it is regulated through other mechanisms such as localization. Early studies indicated that mTORC2 activity is stimulated by growth factors [125–127], and more recently glucose [55, 128–130] and glutamine levels [131, 132]. In addition, lipid-derived signal also may control mTORC2 signaling [133, 134]. But without a clear understanding of the intermediate steps it is difficult to know how direct the connections are. Interestingly, a proteomics screen in 3T3-L1 adipocytes recently identified Sin1 as an AKT substrate phosphorylated at T86 early in response to insulin stimulation [135]. Sin1-T86 phosphorylation occurs before AKT-S473 phosphorylation suggesting it may function as part of a positive feedback loop [136]. There are also clues that mTORC2 may be regulated by GTPases, including the presence of a Ras binding domain in the Sin1 subunit [35, 137], but these findings also await broad functional validation.
Another challenge to understanding mTORC2 is that less is known about where mTORC2 signaling occurs. The current view is that mTORC2 may live in many cellular compartments including the plasma membrane, the endoplasmic reticulum and mitochondria associated membranes (MAM), associated with ribosomes, the lysosome, and in yeast the actomyosin ring [138–144]. Thus, mTORC2 signaling may emanate from multiple cellular locations. However, most models indicate that AKT activation occurs at the plasma membrane, thus it remains mechanistically enigmatic how AKT activation by mTORC2, PDK1, and other AKT regulatory signals are coordinated in time and space. Notably, multiple versions of mTORC2 exist that can be defined by unique Sin1 isoforms [Box 1] [34] and an interesting possibility is that these different mTORC2 complexes might signal from distinct cellular locations and/or have different substrates. In fact, as mentioned earlier some Sin1 isoforms contain a domain similar to the PH domains found in AKT and PDK1, which may have regulatory capacity [5], but its broad role in mTORC2 signaling remains to be seen.
Downstream Effectors
Scanning most reviews on mTOR might leave the general impression that downstream mTORC2 signaling is resolved. Indeed it is clear that mTORC2 is the major kinase that directly phosphorylates AKT on the hydrophobic motif site [Figure 1B][6, 48] and it is also accepted that mTORC2 targets similar domains in SGK and PKCα [Table 1] [50, 51, 145]. However, in several culture systems including Rictor inducible-knockout preadipocytes [40, 41] and several tissue specific knockout models including brown and white adipose tissue[38–43, 48, 49, 122], the loss of mTORC2 does not translate to a broad or robust dampening of AKT signaling, which includes the classic AKT-TSC-mTORC1 paradigm [See Figure 1A]. Phosphorylation of a few AKT substrates, mainly FoxO1/3 and GSK3β, has shown some modest cell-type specific attenuation following mTORC2 loss [48, 122, 146], but this is not consistently observed [40–43, 48, 123, 147–150]. One caveat to the genetic studies is that AKT signaling is determined following chronic mTORC2 inhibition, and it is possible that under such conditions, compensatory mechanisms could sustain AKT activity. Nevertheless, these findings raise several interesting questions regarding the essentiality of mTORC2 for AKT signaling relevant to adipocytes.
What is the role of mTORC2 in AKT signaling?
One model of AKT activation is that—like other AGC family kinases—phosphorylation in the hydrophobic motif creates a docking site for PDK1. Indeed, in cultured cells inhibiting mTORC2-dependent AKT-S473 phosphorylation by knocking-down Rictor or treating cells with mTOR kinase inhibitors, acutely attenuates both S473 and T308 [6, 79, 151], consistent with these sites being linked. However, T308 phosphorylation and downstream AKT signaling rapidly recover in the cells treated with mTOR kinase inhibitors [151, 152], and in Rictor, mLst8, and mSin1 KO embryos and fibroblasts, AKT-T308 phosphorylation remains intact [48, 146] indicating T308 and S473 phosphorylation can also occur independently. Indeed, inducing Rictor deletion in brown or white preadipocytes—a more acute, selective, and isogenic model of mTORC2 loss—modestly reduces T308 phosphorylation but not downstream pan-AKT signaling [40, 41], which as discussed above is also true in vivo in white or brown adipose tissue Rictor deletion models [40, 41]. Thus, in adipocytes mTORC2 may facilitate maximum AKT phosphorylation in response to stimulation, but it does not appear to be essential for T308 phosphorylation, or all downstream AKT signaling. Two independent groups have also reported a lipid metabolism defect in mice with hepatic Rictor deletion, but they do not agree mechanistically [122, 123]; one group reports that some AKT effectors are less stimulated [123], while the other reports normal insulin-stimulated AKT signaling [122]. The growing picture from these and several other studies is that AKT signaling to many of its substrates can occur in the absence of mTORC2 in several settings. In adipocytes then, why does losing mTORC2 have such profound metabolic consequences if AKT signaling is intact?
One possibility is that mTORC2 may facilitate AKT activation by the canonical plasma membrane recruitment mechanism, but it is not essential perhaps because AKT signaling can reprogram to overcome mTORC2 dependency, or because AKT and PDK1 can be co-localized by their PH domains. However, mTORC2 may be essential for a non-canonical (e.g. PI(3,4,5)P3-independent) AKT pathway at another cellular location. In this model, PDK1 and AKT might be united by a PH-domain independent mechanism similar to the mechanism by which other AGC family kinases are thought to interact with PDK1 [153] [Figure 4]. Alternatively, a critical AKT-independent mTORC2 pathway could control metabolism. Interestingly, in glioblastoma cells it has been suggested that mTORC2 influences glycolysis independently of AKT [154]; dual specificity phosphatase 10 (DUSP10) and ATP citrate lyase (ACLY) have also been suggested to function downstream of mTORC2, independently of AKT [155, 156], as do SGK and PKCα, although genetic studies have not yet supported the latter possibility. [157, 158]. Of course, it could be a combination of these possibilities, or perhaps even Rictor loss independently of its association with mTOR, is the culprit. Sorting out the critical mTORC2 effector pathways in adipocytes and beyond is a critical future challenge transcending many fields due to the broad importance of PI3K/AKT/mTOR signaling in many human diseases.
In the Clinic: mTOR-Targeted Therapies and the role of Adipose Tissue
Pharmacological inhibitors of mTOR are highly desired agents in oncology and transplant medicine, thus understanding the mechanistic basis of their side effects could improve efficacy. Rapamycin (Sirolimus, INN/USAN) is a widely used immunosuppressant particularly in kidney transplantation. Mechanistically, rapamycin is an immunophillin that functions as an mTOR inhibitor only when bound to FKBP12. Patients on rapamycin often development new onset diabetes after transplantation (NODAT), which can increase post-transplant morbidity and mortality [159, 160]. The exact mechanisms by which NODAT develops is not understood [160–162]. Could rapamycin cause insulin resistance in part by inhibiting mTOR in adipose tissue? Rapamycin acutely inhibits mTORC1; however, as mentioned above, prolonged rapamycin exposure additionally inhibits mTORC2 [80, 163] by preventing new Rictor-mTOR interactions [80]. Moreover, very high doses of rapamycin are also capable of binding the FRB domain independently of FKB12 and inhibits mTORC2 [164]. As discussed genetic studies indicate that selectively losing either mTORC1 or mTORC2 in adipose tissue impairs insulin sensitivity, it is possible that rapamycin can compromise metabolic homeostasis by targeting either complex in the adipose tissue. Rapamycin’s ability to inhibit mTORC2 in the liver likely to its undesirable side effects in this tissue [163].
Given that many cancers have elevated mTOR signaling, there is also great interest in mTOR inhibitors for use in oncology [165–167]. Rapamycin and its analogs have been developed for this purpose but in many cases were met with limited success, in part due to incomplete mTOR inhibition, and negative feedback up-regulation of AKT and cell survival pathways. More recently, major investments have been made towards developing mTOR catalytic inhibitors that target the kinase domain. Several of these compounds, often referred to as generation mTOR inhibitors, are currently being tested in early clinical trials [Table 2]. While these 2nd generation inhibitors do a better job of complete mTOR inhibition, feedback pathways, drug resistance, and toxicity remain challenges [165]. More recently a novel “3rd generation” mTOR inhibitor (RapaLink) was created by crosslinking rapamycin with an mTOR kinase inhibitor, allowing for the drug to bind at both the FRB and the kinase domain. In preclinical studies, RapaLink has shown promise in overcoming some types of mutation mediated drug resistance [Table 2] [168]. Despite these significant advances, major hurdles still remain in understanding and overcoming mTOR inhibition related toxicity in normal tissues. Continued elucidation of mTORC1 and mTORC2’s mechanisms of action in metabolic tissues like adipose tissue, liver, and skeletal muscle is essential to understanding how to cope with the side effects of mTOR-targeted therapies.
Table 2.
mTOR inhibitors developed for clinical use
| Drug name | Advantage over previous generation |
Clinical Progress | Challenges | Ref |
|---|---|---|---|---|
|
| ||||
| 1st Generation Drugs | ||||
|
| ||||
| Rapamycin (sirolimus) Everolimus Temsirolimus | Currently used for immunosuppression in the context of allograft rejection. Chemotherapeutic in some cancers, such as renal cell carcinoma, and mantle cell lymphoma | Enhanced cell survival due to loss of mTORC1 mediated negative feedback on PI3K/AKT signaling. mTOR mutations in tumor cells leading to drug resistance | [176, 177] | |
|
| ||||
| 2nd Generation Drugs | ||||
|
| ||||
| Dual PI3K/mTOR inhibitors: Dactolisib GSK2126458 XL765 | Targeting kinase activity of mTOR, or both PI3K and mTOR, prevents the negative feedback mediated increase in AKT signaling. This allows for increased efficiency in activation of cell death pathways. | Several candidates in early clinical trials in the setting of various cancers, including solid tumors, which are one group of cancers that were not well targeted by first generation rapalogs. | Increased toxicity due to targeting of both mTORC1 and mTORC2 pathways. mTOR mutations leading to drug resistance is a challenge. | [178–182] |
| mTOR Kinase inhibitors: AZD8055 INK128 OSI027 | ||||
|
| ||||
| 3rd Generation Drugs | ||||
|
| ||||
| RapaLinks | Rapamycin crosslinked with an mTOR kinase inhibitor allows the compound to interact at both the FRB domain of mTOR, and the kinase domain at the same time. This allows for potent inhibition of mTORC1 and mTORC2 activity, even in the setting of drug resistance cell lines. | Currently being studied in a pre-clinical setting, in cell lines and mouse xenografts. | Clinical efficacy and toxicity in human patients unclear; may be significantly different than what is found in animal models. | [168] |
Concluding Remarks
WAT and BAT depots exist in a variety of unique anatomically defined locations in rodents and humans [See Figure 2] and it is increasingly being appreciated that different depots and even individual adipocytes within the same depot have unique metabolic properties and developmental origins [7, 59, 169]. Whether different populations of adipocytes within the same WAT (or BAT) depot have different metabolic functions, analogous to fast and slow twitch fibers in muscle, and different requirements for mTOR signaling, are interesting and open questions. Signals from the microenvironment also influence individual adipocyte metabolic properties [170], and how these signals might utilize mTOR in vivo to promote adipocyte identity and function remains to be seen.
At present, the ability to genetically explore depot-specific, and adipocyte-specific, metabolic functions is challenging because strategies to target specific depots or sub-populations within specific depots (e.g. with Cre-Lox technology) is limited [8]. This is problematic even when interpreting genetic results using Adiponectin-Cre, because it targets all mature brown and white adipocytes and therefore masks potential crosstalk between WAT and BAT depots or between anatomically and functionally distinct WAT depots. However, adipose tissue development is a young field advancing rapidly, and it has reached an inflection point in which the ability to combine physiological, genetic, and biochemical studies can be integrated like never before. Thus, understanding how signaling and metabolism intersect in the adipose tissue niche through pathways like the mTOR pathway and beyond will be critical to understanding fat expansion, organ-to-organ communication, and how adipose tissue controls metabolic homeostasis.
Figure 5. Potential downstream mechanisms of mTORC2 function.
(Left) Canonical mode of AKT activation in which PDK1 and AKT are co-localized at the plasma membrane through their N-terminal Pleckstrin Homology (PH) domains, which bind to PI(3,4,5)P3 (PIP3). At the plasma membrane PDK1 phosphorylates AKT at T308 in the kinase domain, which is critical for AKT activation. mTORC2 also functions at the plasma membrane to phosphorylate AKT at S473 in the C-terminal hydrophobic motif (HM), which is also required for full AKT activation. However, several studies (described in the text) suggest mTORC2 may be dispensable for pan-AKT signaling to all of its substrates, yet mTORC2 loss often has profound phenotypes.
(Right) Possible alternative models of mTORC2-associated signaling pathways that might explain some mTORC2 loss-of-function phenotypes. (a) A non-canonical PI(3,4,5)P3-independent AKT signaling pathway could exist at an intracellular location that is distinct from the plasma membrane in which mTORC2-dependent phosphorylation is essential for PDK1 activation of AKT towards a distinct set of substrates; (b) mTORC2 also directly phosphorylates other AGC group kinases, such as SGK, PKC-α, and possibly unidentified effector kinases, which could cause mTORC2 loss-of-function phenotypes; (C) Rictor and mSin1 may function independently of mTOR to control metabolism.
Box 1, Figure 1. The mTOR complexes and the domain structures of their individual subunits.
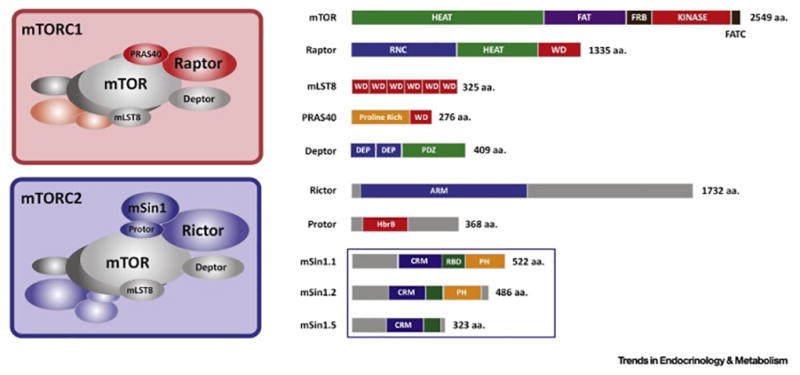
(Left) Graphical representation of the mTOR complex 1 and mTOR complex 2 structures, which exist as dimers. (Right) Domain structure and relative sizes of the individual mTORC1 and mTORC22 subunits. The amino acid length of each subunit is indicated to the right. The Sin1 subunit has been detected as multiple isoforms and biochemical studies have shown that at least three isoforms are expressed that can define three unique mTORC2 formations.
Outstanding Questions.
What is the role of amino acid sensing pathways upstream of mTORC1 in adipocytes?
Does amino acid activation of mTORC1 in adipocytes contribute to metabolic dysfunction, such as insulin resistance?
Is disruption of an mTORC1 effector pathway part of the underlying mechanism of certain human lipodystrophy disorders?
How does PKA signaling regulate mTORC1 and what mTORC1-effector pathways are PKA-dependent?
How does the adipose tissue communicate with other metabolic organs and what is the role of mTOR signaling in these pathways? Does mTOR signaling in adipose tissue regulate extrahepatic signals that control liver insulin sensitivity and hepatic glucose production?
Does mTOR signaling function in mature adipocytes to control the recruitment of new adipocytes in response to nutritional or hormonal cues?
What are the upstream and downstream targets of mTORC2 in adipocytes?
TRENDS BOX.
Advancements in the field of adipose tissue biology have allowed for the development of novel in vivo models designed to target the mTOR signaling pathways in mature adipocytes, unveiling critical roles for both mTORC1 and mTORC2 signaling pathways in metabolic regulation.
Recent studies have shown that the mTOR complexes are not only important in the maintenance of adipocyte metabolism, but they may also modulate organ-organ communication, and whole body metabolism.
In the pursuit of understanding the biology of white and brown adipose tissue, novel roles have been proposed for mTORC1 and mTORC2 in the regulation of the white-brown phenotypic switch of adipocytes.
While many gaps remain in the understanding of mTORC2 and its relationship with both upstream and downstream targets, adipocyte models have allowed for the proposal of novel signaling pathways involving mTORC2.
Acknowledgments
D.A.G. is supported by grants from the National Institutes of Health (R01DK094004 & R01CA196986) and a Leukemia and Lymphoma Society Career Development Award. P.L.L. is supported by a predoctoral fellowship from the National Institute on Alcohol Abuse and Alcoholism (1F30AA024385-01). We thank members of the Guertin lab for comments.
Glossary
- AGC kinases
A large family of kinases which mainly consist of protein kinase families A,G,C (PKA, PKG, PKC). The AGC kinases have important role in regulating a variety of cellular processes. Aberrant AGC activity is associated with many human diseases including cancer and diabetes.
- Autophagy
A physiological process by which a cell degrades and recycles cellular components. Autophagy is an ordered, regulated process, important in repair and response to cellular stresses such as nutrient starvation.
- Cre-Lox technology
A recombinase technology that relies on the DNA recombinase Cre protein to catalyze the recombination of DNA at specific sites marked by loxP sequences.
- GTPase activating protein (GAP)
Regulatory proteins capable of binding G proteins and inducing their GTPase activity.
- GTPase
Enzymes capable of binding and hydrolyzing guanosine triphosphate (GTP).
- Immunophillin
A conserved family of proteins that are cis-trans peptidyl-prolyl isomerases. They are commonly targeted by immunosuppressive drugs including rapamycin.
- Lysosomes
Intracellular organelles that contain enzymes responsible for breakdown of cellular structures. Lysosomes are important in the process of autophagy.
- Phosphoinositide 3-kinase (PI3K)
activated by wide range of upstream regulators such as tyrosine kinase receptors and G-protein coupled receptors, catalyzes phosphatidylinositol-4, 5-bisphosphate to generate phosphatidylinositol-3, 4, 5-triphosphate. PI3K has an important role for AKT activation in insulin receptor signaling.
- Phosphoinositide-dependent kinase-1 (PDK1)
A serine/threonine protein kinase crucial for many downstream effectors activation including AKT, PKC. In insulin-PI3K/AKT signaling, PDK1 phosphorylates Threonine 308 of AKT, indispensable for the full activation of AKT.
- Phosphatidylinositol-(3,4,5)-trisphosphate (PI(3,4,5)P3)
that can act as a second messenger for cell signal transduction. PIP3 provides docking site for downstream effector proteins harboring PH domain that binds to PIP3 with high affinity. This leads to downstream signal activation.
- Plekstrin homology (PH) domain
A protein domain of approximately 100–120 amino acids that can bind with high affinity to phosphatidylinositol lipids. The PH domain plays an important role in regulating protein localization to membranes, and site specific activation of downstream targets.
- Uncoupling protein 1 (UCP1)
a mitochondrial protein found in high abundance in brown adipose tissue (BAT). By uncoupling the respiratory chain, UCP1 is responsible for the unique heat-generating properties of BAT.
Footnotes
Publisher's Disclaimer: This is a PDF file of an unedited manuscript that has been accepted for publication. As a service to our customers we are providing this early version of the manuscript. The manuscript will undergo copyediting, typesetting, and review of the resulting proof before it is published in its final form. Please note that during the production process errors may be discovered which could affect the content, and all legal disclaimers that apply to the journal pertain.
References
- 1.Laplante M, Sabatini David M. mTOR Signaling in Growth Control and Disease. Cell. 2012;149(2):274–293. doi: 10.1016/j.cell.2012.03.017. [DOI] [PMC free article] [PubMed] [Google Scholar]
- 2.Wullschleger S, Loewith R, Hall MN. TOR Signaling in Growth and Metabolism. Cell. 2006;124(3):471–484. doi: 10.1016/j.cell.2006.01.016. [DOI] [PubMed] [Google Scholar]
- 3.Chantranupong L, et al. The CASTOR proteins are arginine sensors for the mTORC1 pathway. Cell. 2016;165(1):153–164. doi: 10.1016/j.cell.2016.02.035. [DOI] [PMC free article] [PubMed] [Google Scholar]
- 4.Ben-Sahra I, et al. mTORC1 induces purine synthesis through control of the mitochondrial tetrahydrofolate cycle. Science. 2016;351(6274):728–33. doi: 10.1126/science.aad0489. [DOI] [PMC free article] [PubMed] [Google Scholar]
- 5.Liu P, et al. Sin1 phosphorylation impairs mTORC2 complex integrity and inhibits downstream Akt signalling to suppress tumorigenesis. Nat Cell Biol. 2013;15(11):1340–50. doi: 10.1038/ncb2860. [DOI] [PMC free article] [PubMed] [Google Scholar]
- 6.Sarbassov DD, et al. Phosphorylation and regulation of Akt/PKB by the rictor-mTOR complex. Science. 2005;307(5712):1098–101. doi: 10.1126/science.1106148. [DOI] [PubMed] [Google Scholar]
- 7.Sanchez-Gurmaches J, Guertin DA. Adipocytes arise from multiple lineages that are heterogeneously and dynamically distributed. Nat Commun. 2014;5:4099. doi: 10.1038/ncomms5099. [DOI] [PMC free article] [PubMed] [Google Scholar]
- 8.Sanchez-Gurmaches J, Hsiao WY, Guertin DA. Highly selective in vivo labeling of subcutaneous white adipocyte precursors with Prx1-Cre. Stem Cell Reports. 2015;4(4):541–50. doi: 10.1016/j.stemcr.2015.02.008. [DOI] [PMC free article] [PubMed] [Google Scholar]
- 9.Berry R, Rodeheffer MS. Characterization of the adipocyte cellular lineage in vivo. Nat Cell Biol. 2013;15(3):302–8. doi: 10.1038/ncb2696. [DOI] [PMC free article] [PubMed] [Google Scholar]
- 10.Cohen P, Spiegelman BM. Brown and Beige Fat: Molecular Parts of a Thermogenic Machine. Diabetes. 2015;64(7):2346. doi: 10.2337/db15-0318. [DOI] [PMC free article] [PubMed] [Google Scholar]
- 11.Jacobsson A, et al. Mitochondrial uncoupling protein from mouse brown fat. Molecular cloning, genetic mapping, and mRNA expression. Journal of Biological Chemistry. 1985;260(30):16250–16254. [PubMed] [Google Scholar]
- 12.Cannon B, Nedergaard J. Brown adipose tissue: function and physiological significance. Physiol Rev. 2004;84(1):277–359. doi: 10.1152/physrev.00015.2003. [DOI] [PubMed] [Google Scholar]
- 13.Seale P, Lazar MA. Brown Fat in Humans: Turning up the Heat on Obesity. Diabetes. 2009;58(7):1482. doi: 10.2337/db09-0622. [DOI] [PMC free article] [PubMed] [Google Scholar]
- 14.Bar-Peled L, Sabatini DM. Regulation of mTORC1 by amino acids. Trends Cell Biol. 2014;24(7):400–6. doi: 10.1016/j.tcb.2014.03.003. [DOI] [PMC free article] [PubMed] [Google Scholar]
- 15.Duran RV, et al. Glutaminolysis activates Rag-mTORC1 signaling. Mol Cell. 2012;47(3):349–58. doi: 10.1016/j.molcel.2012.05.043. [DOI] [PubMed] [Google Scholar]
- 16.Wang S, et al. Lysosomal amino acid transporter SLC38A9 signals arginine sufficiency to mTORC1. Science. 2015;347(6218):188. doi: 10.1126/science.1257132. [DOI] [PMC free article] [PubMed] [Google Scholar]
- 17.Rebsamen M, et al. SLC38A9 is a component of the lysosomal amino acid sensing machinery that controls mTORC1. Nature. 2015;519(7544):477–481. doi: 10.1038/nature14107. [DOI] [PMC free article] [PubMed] [Google Scholar]
- 18.Inoki K, et al. Rheb GTPase is a direct target of TSC2 GAP activity and regulates mTOR signaling. Genes Dev. 2003;17(15):1829–34. doi: 10.1101/gad.1110003. [DOI] [PMC free article] [PubMed] [Google Scholar]
- 19.Tee AR, et al. Tuberous sclerosis complex gene products, Tuberin and Hamartin, control mTOR signaling by acting as a GTPase-activating protein complex toward Rheb. Curr Biol. 2003;13(15):1259–68. doi: 10.1016/s0960-9822(03)00506-2. [DOI] [PubMed] [Google Scholar]
- 20.Sancak Y, et al. PRAS40 is an insulin-regulated inhibitor of the mTORC1 protein kinase. Mol Cell. 2007;25(6):903–15. doi: 10.1016/j.molcel.2007.03.003. [DOI] [PubMed] [Google Scholar]
- 21.Jung J, Genau HM, Behrends C. Amino Acid-Dependent mTORC1 Regulation by the Lysosomal Membrane Protein SLC38A9. Molecular and Cellular Biology. 2015;35(14):2479–2494. doi: 10.1128/MCB.00125-15. [DOI] [PMC free article] [PubMed] [Google Scholar]
- 22.Groenewoud MJ, Zwartkruis FJ. Rheb and Rags come together at the lysosome to activate mTORC1. Biochem Soc Trans. 2013;41(4):951–5. doi: 10.1042/BST20130037. [DOI] [PubMed] [Google Scholar]
- 23.Kim J, et al. AMPK and mTOR regulate autophagy through direct phosphorylation of Ulk1. Nat Cell Biol. 2011;13(2):132–141. doi: 10.1038/ncb2152. [DOI] [PMC free article] [PubMed] [Google Scholar]
- 24.Roczniak-Ferguson A, et al. The transcription factor TFEB links mTORC1 signaling to transcriptional control of lysosome homeostasis. Sci Signal. 2012;5(228):ra42. doi: 10.1126/scisignal.2002790. [DOI] [PMC free article] [PubMed] [Google Scholar]
- 25.Huffman TA, Mothe-Satney I, Lawrence JC., Jr Insulin-stimulated phosphorylation of lipin mediated by the mammalian target of rapamycin. Proc Natl Acad Sci U S A. 2002;99(2):1047–52. doi: 10.1073/pnas.022634399. [DOI] [PMC free article] [PubMed] [Google Scholar]
- 26.Peterson TR, et al. mTOR complex 1 regulates lipin 1 localization to control the SREBP pathway. Cell. 2011;146(3):408–20. doi: 10.1016/j.cell.2011.06.034. [DOI] [PMC free article] [PubMed] [Google Scholar]
- 27.Hsu PP, et al. The mTOR-regulated phosphoproteome reveals a mechanism of mTORC1-mediated inhibition of growth factor signaling. Science. 2011;332(6035):1317–22. doi: 10.1126/science.1199498. [DOI] [PMC free article] [PubMed] [Google Scholar]
- 28.Yu Y, et al. Phosphoproteomic analysis identifies Grb10 as an mTORC1 substrate that negatively regulates insulin signaling. Science. 2011;332(6035):1322–6. doi: 10.1126/science.1199484. [DOI] [PMC free article] [PubMed] [Google Scholar]
- 29.Liu M, et al. Grb10 Promotes Lipolysis and Thermogenesis by Phosphorylation-dependent Feedback Inhibition of mTORC1. Cell metabolism. 2014;19(6):967–980. doi: 10.1016/j.cmet.2014.03.018. [DOI] [PMC free article] [PubMed] [Google Scholar]
- 30.O’Reilly KE, et al. mTOR Inhibition Induces Upstream Receptor Tyrosine Kinase Signaling and Activates Akt. Cancer research. 2006;66(3):1500–1508. doi: 10.1158/0008-5472.CAN-05-2925. [DOI] [PMC free article] [PubMed] [Google Scholar]
- 31.Coffer PJ, Woodgett JR. Molecular cloning and characterisation of a novel putative protein-serine kinase related to the cAMP-dependent and protein kinase C families. Eur J Biochem. 1991;201(2):475–81. doi: 10.1111/j.1432-1033.1991.tb16305.x. [DOI] [PubMed] [Google Scholar]
- 32.Jones PF, et al. Molecular cloning and identification of a serine/threonine protein kinase of the second-messenger subfamily. Proc Natl Acad Sci U S A. 1991;88(10):4171–5. doi: 10.1073/pnas.88.10.4171. [DOI] [PMC free article] [PubMed] [Google Scholar]
- 33.Nakatani K, et al. Identification of a human Akt3 (protein kinase B gamma) which contains the regulatory serine phosphorylation site. Biochem Biophys Res Commun. 1999;257(3):906–10. doi: 10.1006/bbrc.1999.0559. [DOI] [PubMed] [Google Scholar]
- 34.Frias MA, et al. mSin1 is necessary for Akt/PKB phosphorylation, and its isoforms define three distinct mTORC2s. Curr Biol. 2006;16(18):1865–70. doi: 10.1016/j.cub.2006.08.001. [DOI] [PubMed] [Google Scholar]
- 35.Schroder WA, et al. Human Sin1 contains Ras-binding and pleckstrin homology domains and suppresses Ras signalling. Cell Signal. 2007;19(6):1279–89. doi: 10.1016/j.cellsig.2007.01.013. [DOI] [PubMed] [Google Scholar]
- 36.Alessi DR, et al. Characterization of a 3-phosphoinositide-dependent protein kinase which phosphorylates and activates protein kinase Balpha. Curr Biol. 1997;7(4):261–9. doi: 10.1016/s0960-9822(06)00122-9. [DOI] [PubMed] [Google Scholar]
- 37.Manning BD, Cantley LC. AKT/PKB Signaling: Navigating Downstream. Cell. 2007;129(7):1261–1274. doi: 10.1016/j.cell.2007.06.009. [DOI] [PMC free article] [PubMed] [Google Scholar]
- 38.Cybulski N, et al. mTOR complex 2 in adipose tissue negatively controls whole-body growth. Proc Natl Acad Sci U S A. 2009;106(24):9902–7. doi: 10.1073/pnas.0811321106. [DOI] [PMC free article] [PubMed] [Google Scholar]
- 39.Kumar A, et al. Fat cell-specific ablation of rictor in mice impairs insulin-regulated fat cell and whole-body glucose and lipid metabolism. Diabetes. 2010;59(6):1397–406. doi: 10.2337/db09-1061. [DOI] [PMC free article] [PubMed] [Google Scholar]
- 40.Hung CM, et al. Rictor/mTORC2 loss in the Myf5 lineage reprograms brown fat metabolism and protects mice against obesity and metabolic disease. Cell Rep. 2014;8(1):256–71. doi: 10.1016/j.celrep.2014.06.007. [DOI] [PMC free article] [PubMed] [Google Scholar]
- 41.Tang Y, et al. Adipose tissue mTORC2 regulates ChREBP-driven de novo lipogenesis and hepatic glucose metabolism. Nature Communications. 2016;7:11365. doi: 10.1038/ncomms11365. [DOI] [PMC free article] [PubMed] [Google Scholar]
- 42.Bentzinger CF, et al. Skeletal muscle-specific ablation of raptor, but not of rictor, causes metabolic changes and results in muscle dystrophy. Cell Metab. 2008;8(5):411–24. doi: 10.1016/j.cmet.2008.10.002. [DOI] [PubMed] [Google Scholar]
- 43.Kumar A, et al. Muscle-specific deletion of rictor impairs insulin-stimulated glucose transport and enhances Basal glycogen synthase activity. Mol Cell Biol. 2008;28(1):61–70. doi: 10.1128/MCB.01405-07. [DOI] [PMC free article] [PubMed] [Google Scholar]
- 44.Moore SF, Hunter RW, Hers I. mTORC2 protein complex-mediated Akt (Protein Kinase B) Serine 473 Phosphorylation is not required for Akt1 activity in human platelets [corrected] J Biol Chem. 2011;286(28):24553–60. doi: 10.1074/jbc.M110.202341. [DOI] [PMC free article] [PubMed] [Google Scholar]
- 45.Ikenoue T, et al. Essential function of TORC2 in PKC and Akt turn motif phosphorylation, maturation and signalling. EMBO J. 2008;27(14):1919–31. doi: 10.1038/emboj.2008.119. [DOI] [PMC free article] [PubMed] [Google Scholar]
- 46.Oh WJ, et al. mTORC2 can associate with ribosomes to promote cotranslational phosphorylation and stability of nascent Akt polypeptide. EMBO J. 2010;29(23):3939–51. doi: 10.1038/emboj.2010.271. [DOI] [PMC free article] [PubMed] [Google Scholar]
- 47.Hiraoka D, Okumura E, Kishimoto T. Turn motif phosphorylation negatively regulates activation loop phosphorylation in Akt. Oncogene. 2011;30(44):4487–97. doi: 10.1038/onc.2011.155. [DOI] [PubMed] [Google Scholar]
- 48.Guertin DA, et al. Ablation in mice of the mTORC components raptor, rictor, or mLST8 reveals that mTORC2 is required for signaling to Akt-FOXO and PKCalpha, but not S6K1. Dev Cell. 2006;11(6):859–71. doi: 10.1016/j.devcel.2006.10.007. [DOI] [PubMed] [Google Scholar]
- 49.Festuccia WT, et al. Myeloid-specific Rictor deletion induces M1 macrophage polarization and potentiates in vivo pro-inflammatory response to lipopolysaccharide. PLoS One. 2014;9(4):e95432. doi: 10.1371/journal.pone.0095432. [DOI] [PMC free article] [PubMed] [Google Scholar]
- 50.Gan X, et al. PRR5L degradation promotes mTORC2-mediated PKC-delta phosphorylation and cell migration downstream of Galpha12. Nat Cell Biol. 2012;14(7):686–96. doi: 10.1038/ncb2507. [DOI] [PMC free article] [PubMed] [Google Scholar]
- 51.Mizunuma M, et al. mTORC2-SGK-1 acts in two environmentally responsive pathways with opposing effects on longevity. Aging Cell. 2014;13(5):869–78. doi: 10.1111/acel.12248. [DOI] [PMC free article] [PubMed] [Google Scholar]
- 52.Copp J, Manning G, Hunter T. TORC-specific phosphorylation of mammalian target of rapamycin (mTOR): phospho-Ser2481 is a marker for intact mTOR signaling complex 2. Cancer Res. 2009;69(5):1821–7. doi: 10.1158/0008-5472.CAN-08-3014. [DOI] [PMC free article] [PubMed] [Google Scholar]
- 53.Perry RJ, et al. Hepatic acetyl CoA links adipose tissue inflammation to hepatic insulin resistance and type 2 diabetes. Cell. 2015;160(4):745–58. doi: 10.1016/j.cell.2015.01.012. [DOI] [PMC free article] [PubMed] [Google Scholar]
- 54.Glidden EJ, et al. Multiple site acetylation of Rictor stimulates mammalian target of rapamycin complex 2 (mTORC2)-dependent phosphorylation of Akt protein. J Biol Chem. 2012;287(1):581–8. doi: 10.1074/jbc.M111.304337. [DOI] [PMC free article] [PubMed] [Google Scholar]
- 55.Masui K, et al. Glucose-dependent acetylation of Rictor promotes targeted cancer therapy resistance. Proc Natl Acad Sci U S A. 2015;112(30):9406–11. doi: 10.1073/pnas.1511759112. [DOI] [PMC free article] [PubMed] [Google Scholar]
- 56.Polak P, et al. Adipose-Specific Knockout of raptor Results in Lean Mice with Enhanced Mitochondrial Respiration. Cell Metabolism. 2008;8(5):399–410. doi: 10.1016/j.cmet.2008.09.003. [DOI] [PubMed] [Google Scholar]
- 57.Jeffery E, et al. Characterization of Cre recombinase models for the study of adipose tissue. Adipocyte. 2014;3(3):206–211. doi: 10.4161/adip.29674. [DOI] [PMC free article] [PubMed] [Google Scholar]
- 58.Wang F, et al. Lipoatrophy and severe metabolic disturbance in mice with fat-specific deletion of PPARgamma. Proc Natl Acad Sci U S A. 2013;110(46):18656–61. doi: 10.1073/pnas.1314863110. [DOI] [PMC free article] [PubMed] [Google Scholar]
- 59.Lee MJ, Wu Y, Fried SK. Adipose tissue heterogeneity: implication of depot differences in adipose tissue for obesity complications. Mol Aspects Med. 2013;34(1):1–11. doi: 10.1016/j.mam.2012.10.001. [DOI] [PMC free article] [PubMed] [Google Scholar]
- 60.Lee PL, et al. Raptor/mTORC1 loss in adipocytes causes progressive lipodystrophy and fatty liver disease. Mol Metab. 2016;5(6):422–32. doi: 10.1016/j.molmet.2016.04.001. [DOI] [PMC free article] [PubMed] [Google Scholar]
- 61.Softic S, et al. Lipodystrophy Due to Adipose Tissue–Specific Insulin Receptor Knockout Results in Progressive NAFLD. Diabetes. 2016;65(8):2187. doi: 10.2337/db16-0213. [DOI] [PMC free article] [PubMed] [Google Scholar]
- 62.Shearin AL, et al. Lack of AKT in adipocytes causes severe lipodystrophy. Mol Metab. 2016;5(7):472–9. doi: 10.1016/j.molmet.2016.05.006. [DOI] [PMC free article] [PubMed] [Google Scholar]
- 63.Laplante M, et al. DEPTOR cell-autonomously promotes adipogenesis, and its expression is associated with obesity. Cell Metab. 2012;16(2):202–12. doi: 10.1016/j.cmet.2012.07.008. [DOI] [PMC free article] [PubMed] [Google Scholar]
- 64.Yoon MS, et al. Mechanistic target of rapamycin controls homeostasis of adipogenesis. J Lipid Res. 2013;54(8):2166–73. doi: 10.1194/jlr.M037705. [DOI] [PMC free article] [PubMed] [Google Scholar]
- 65.Shan T, et al. Adipocyte-specific deletion of mTOR inhibits adipose tissue development and causes insulin resistance in mice. Diabetologia. 2016;59(9):1995–2004. doi: 10.1007/s00125-016-4006-4. [DOI] [PMC free article] [PubMed] [Google Scholar]
- 66.Carnevalli LS, et al. S6K1 Plays a Critical Role in Early Adipocyte Differentiation. Developmental cell. 2010;18(5):763–774. doi: 10.1016/j.devcel.2010.02.018. [DOI] [PMC free article] [PubMed] [Google Scholar]
- 67.Singh M, et al. 4E-BPs control fat storage by regulating the expression of Egr1 and ATGL. Journal of Biological Chemistry. 2015 doi: 10.1074/jbc.M114.631895. [DOI] [PMC free article] [PubMed] [Google Scholar]
- 68.Liu K, Czaja MJ. Regulation of lipid stores and metabolism by lipophagy. Cell Death Differ. 2013;20(1):3–11. doi: 10.1038/cdd.2012.63. [DOI] [PMC free article] [PubMed] [Google Scholar]
- 69.Agarwal AK, et al. AGPAT2 is mutated in congenital generalized lipodystrophy linked to chromosome 9q34. Nat Genet. 2002;31(1):21–3. doi: 10.1038/ng880. [DOI] [PubMed] [Google Scholar]
- 70.Miranda DM, et al. Novel mutations of the BSCL2 and AGPAT2 genes in 10 families with Berardinelli-Seip congenital generalized lipodystrophy syndrome. Clin Endocrinol (Oxf) 2009;71(4):512–7. doi: 10.1111/j.1365-2265.2009.03532.x. [DOI] [PubMed] [Google Scholar]
- 71.Talukder MMU, et al. Seipin oligomers can interact directly with AGPAT2 and lipin 1, physically scaffolding critical regulators of adipogenesis. Molecular Metabolism. 2015;4(3):199–209. doi: 10.1016/j.molmet.2014.12.013. [DOI] [PMC free article] [PubMed] [Google Scholar]
- 72.Labbé SM, et al. mTORC1 is Required for Brown Adipose Tissue Recruitment and Metabolic Adaptation to Cold. Scientific Reports. 2016;6:37223. doi: 10.1038/srep37223. [DOI] [PMC free article] [PubMed] [Google Scholar]
- 73.Nicholls DG, Locke RM. Thermogenic mechanisms in brown fat. Physiol Rev. 1984;64(1):1–64. doi: 10.1152/physrev.1984.64.1.1. [DOI] [PubMed] [Google Scholar]
- 74.Lo Kinyui A, Sun L. Turning WAT into BAT: a review on regulators controlling the browning of white adipocytes. Bioscience Reports. 2013;33(5):e00065. doi: 10.1042/BSR20130046. [DOI] [PMC free article] [PubMed] [Google Scholar]
- 75.Harms M, Seale P. Brown and beige fat: development, function and therapeutic potential. Nat Med. 2013;19(10):1252–1263. doi: 10.1038/nm.3361. [DOI] [PubMed] [Google Scholar]
- 76.Tran CM, et al. Rapamycin Blocks Induction of the Thermogenic Program in White Adipose Tissue. Diabetes. 2016;65(4):927–41. doi: 10.2337/db15-0502. [DOI] [PMC free article] [PubMed] [Google Scholar]
- 77.Liu D, et al. Activation of mTORC1 is essential for beta-adrenergic stimulation of adipose browning. J Clin Invest. 2016;126(5):1704–16. doi: 10.1172/JCI83532. [DOI] [PMC free article] [PubMed] [Google Scholar]
- 78.Li J, Kim SG, Blenis J. Rapamycin: one drug, many effects. Cell Metab. 2014;19(3):373–9. doi: 10.1016/j.cmet.2014.01.001. [DOI] [PMC free article] [PubMed] [Google Scholar]
- 79.Thoreen CC, Sabatini DM. Rapamycin inhibits mTORC1, but not completely. Autophagy. 2009;5(5):725–6. doi: 10.4161/auto.5.5.8504. [DOI] [PubMed] [Google Scholar]
- 80.Sarbassov DD, et al. Prolonged rapamycin treatment inhibits mTORC2 assembly and Akt/PKB. Mol Cell. 2006;22(2):159–68. doi: 10.1016/j.molcel.2006.03.029. [DOI] [PubMed] [Google Scholar]
- 81.Magdalon J, et al. Constitutive adipocyte mTORC1 activation enhances mitochondrial activity and reduces visceral adiposity in mice. Biochim Biophys Acta. 2016;1861(5):430–8. doi: 10.1016/j.bbalip.2016.02.023. [DOI] [PubMed] [Google Scholar]
- 82.Albert V, et al. mTORC2 sustains thermogenesis via Akt-induced glucose uptake and glycolysis in brown adipose tissue. EMBO Mol Med. 2016;8(3):232–46. doi: 10.15252/emmm.201505610. [DOI] [PMC free article] [PubMed] [Google Scholar]
- 83.Herman MA, et al. A novel ChREBP isoform in adipose tissue regulates systemic glucose metabolism. Nature. 2012;484(7394):333–8. doi: 10.1038/nature10986. [DOI] [PMC free article] [PubMed] [Google Scholar]
- 84.Cao H, et al. Identification of a lipokine, a lipid hormone linking adipose tissue to systemic metabolism. Cell. 2008;134(6):933–44. doi: 10.1016/j.cell.2008.07.048. [DOI] [PMC free article] [PubMed] [Google Scholar]
- 85.Eissing L, et al. De novo lipogenesis in human fat and liver is linked to ChREBP-beta and metabolic health. Nat Commun. 2013;4:1528. doi: 10.1038/ncomms2537. [DOI] [PMC free article] [PubMed] [Google Scholar]
- 86.Kim MS, et al. ChREBP regulates fructose-induced glucose production independently of insulin signaling. J Clin Invest. 2016;126(11):4372–4386. doi: 10.1172/JCI81993. [DOI] [PMC free article] [PubMed] [Google Scholar]
- 87.Oosterveer MH, et al. Fenofibrate simultaneously induces hepatic fatty acid oxidation, synthesis, and elongation in mice. J Biol Chem. 2009;284(49):34036–44. doi: 10.1074/jbc.M109.051052. [DOI] [PMC free article] [PubMed] [Google Scholar]
- 88.Turner N, et al. Distinct patterns of tissue-specific lipid accumulation during the induction of insulin resistance in mice by high-fat feeding. Diabetologia. 2013;56(7):1638–48. doi: 10.1007/s00125-013-2913-1. [DOI] [PubMed] [Google Scholar]
- 89.Eguez L, et al. Full intracellular retention of GLUT4 requires AS160 Rab GTPase activating protein. Cell Metab. 2005;2(4):263–72. doi: 10.1016/j.cmet.2005.09.005. [DOI] [PubMed] [Google Scholar]
- 90.Sano H, et al. Insulin-stimulated phosphorylation of a Rab GTPase-activating protein regulates GLUT4 translocation. J Biol Chem. 2003;278(17):14599–602. doi: 10.1074/jbc.C300063200. [DOI] [PubMed] [Google Scholar]
- 91.Accili D, Arden KC. FoxOs at the crossroads of cellular metabolism, differentiation, and transformation. Cell. 2004;117(4):421–6. doi: 10.1016/s0092-8674(04)00452-0. [DOI] [PubMed] [Google Scholar]
- 92.Sundqvist A, et al. Control of lipid metabolism by phosphorylation-dependent degradation of the SREBP family of transcription factors by SCF(Fbw7) Cell Metab. 2005;1(6):379–91. doi: 10.1016/j.cmet.2005.04.010. [DOI] [PubMed] [Google Scholar]
- 93.Vander Haar E, et al. Insulin signalling to mTOR mediated by the Akt/PKB substrate PRAS40. Nat Cell Biol. 2007;9(3):316–23. doi: 10.1038/ncb1547. [DOI] [PubMed] [Google Scholar]
- 94.Brown MS, Goldstein JL. Selective versus total insulin resistance: a pathogenic paradox. Cell Metab. 2008;7(2):95–6. doi: 10.1016/j.cmet.2007.12.009. [DOI] [PubMed] [Google Scholar]
- 95.Kullmann S, et al. Selective insulin resistance in homeostatic and cognitive control brain areas in overweight and obese adults. Diabetes Care. 2015;38(6):1044–50. doi: 10.2337/dc14-2319. [DOI] [PubMed] [Google Scholar]
- 96.Tan S-X, et al. Selective Insulin resistance in adipocytes. Journal of Biological Chemistry. 2015 doi: 10.1074/jbc.M114.623686. [DOI] [PMC free article] [PubMed] [Google Scholar]
- 97.Otero YF, Stafford JM, McGuinness OP. Pathway-selective insulin resistance and metabolic disease: the importance of nutrient flux. J Biol Chem. 2014;289(30):20462–9. doi: 10.1074/jbc.R114.576355. [DOI] [PMC free article] [PubMed] [Google Scholar]
- 98.Gonzalez E, et al. Hyperinsulinemia leads to uncoupled insulin regulation of the GLUT4 glucose transporter and the FoxO1 transcription factor. Proc Natl Acad Sci U S A. 2011;108(25):10162–7. doi: 10.1073/pnas.1019268108. [DOI] [PMC free article] [PubMed] [Google Scholar]
- 99.Marcelino H, et al. A role for adipose tissue de novo lipogenesis in glucose homeostasis during catch-up growth: a Randle cycle favoring fat storage. Diabetes. 2013;62(2):362–72. doi: 10.2337/db12-0255. [DOI] [PMC free article] [PubMed] [Google Scholar]
- 100.Olsen JM, et al. Glucose uptake in brown fat cells is dependent on mTOR complex 2-promoted GLUT1 translocation. J Cell Biol. 2014;207(3):365–74. doi: 10.1083/jcb.201403080. [DOI] [PMC free article] [PubMed] [Google Scholar]
- 101.Karp CL. Unstressing intemperate models: how cold stress undermines mouse modeling. J Exp Med. 2012;209(6):1069–74. doi: 10.1084/jem.20120988. [DOI] [PMC free article] [PubMed] [Google Scholar]
- 102.Abreu-Vieira G, et al. Integration of body temperature into the analysis of energy expenditure in the mouse. Mol Metab. 2015;4(6):461–70. doi: 10.1016/j.molmet.2015.03.001. [DOI] [PMC free article] [PubMed] [Google Scholar]
- 103.Feldmann HM, et al. UCP1 ablation induces obesity and abolishes diet-induced thermogenesis in mice exempt from thermal stress by living at thermoneutrality. Cell Metab. 2009;9(2):203–9. doi: 10.1016/j.cmet.2008.12.014. [DOI] [PubMed] [Google Scholar]
- 104.Cannon B, Nedergaard J. Nonshivering thermogenesis and its adequate measurement in metabolic studies. J Exp Biol. 2011;214(Pt 2):242–53. doi: 10.1242/jeb.050989. [DOI] [PubMed] [Google Scholar]
- 105.Daubas P, et al. Myf5 is a novel early axonal marker in the mouse brain and is subjected to post-transcriptional regulation in neurons. Development. 2000;127(2):319–31. doi: 10.1242/dev.127.2.319. [DOI] [PubMed] [Google Scholar]
- 106.Haldar M, et al. Two cell lineages, myf5 and myf5-independent, participate in mouse skeletal myogenesis. Dev Cell. 2008;14(3):437–45. doi: 10.1016/j.devcel.2008.01.002. [DOI] [PMC free article] [PubMed] [Google Scholar]
- 107.Sancak Y, Sabatini DM. Rag Proteins Regulate Amino Acid-Induced mTORC1 Signaling. Biochemical Society Transactions. 2009;37(Pt 1):289–290. doi: 10.1042/BST0370289. [DOI] [PMC free article] [PubMed] [Google Scholar]
- 108.Kim E, et al. Regulation of TORC1 by Rag GTPases in nutrient response. Nat Cell Biol. 2008;10(8):935–45. doi: 10.1038/ncb1753. [DOI] [PMC free article] [PubMed] [Google Scholar]
- 109.Wolfson RL, et al. Sestrin2 is a leucine sensor for the mTORC1 pathway. Science. 2015;351(6268):43. doi: 10.1126/science.aab2674. [DOI] [PMC free article] [PubMed] [Google Scholar]
- 110.Shimobayashi M, Hall MN. Multiple amino acid sensing inputs to mTORC1. Cell Res. 2016;26(1):7–20. doi: 10.1038/cr.2015.146. [DOI] [PMC free article] [PubMed] [Google Scholar]
- 111.Jewell JL, et al. Metabolism. Differential regulation of mTORC1 by leucine and glutamine. Science. 2015;347(6218):194–8. doi: 10.1126/science.1259472. [DOI] [PMC free article] [PubMed] [Google Scholar]
- 112.Petit CS, Roczniak-Ferguson A, Ferguson SM. Recruitment of folliculin to lysosomes supports the amino acid-dependent activation of Rag GTPases. J Cell Biol. 2013;202(7):1107–22. doi: 10.1083/jcb.201307084. [DOI] [PMC free article] [PubMed] [Google Scholar]
- 113.Tsun ZY, et al. The folliculin tumor suppressor is a GAP for the RagC/D GTPases that signal amino acid levels to mTORC1. Mol Cell. 2013;52(4):495–505. doi: 10.1016/j.molcel.2013.09.016. [DOI] [PMC free article] [PubMed] [Google Scholar]
- 114.Herman MA, et al. Adipose tissue branched chain amino acid (BCAA) metabolism modulates circulating BCAA levels. J Biol Chem. 2010;285(15):11348–56. doi: 10.1074/jbc.M109.075184. [DOI] [PMC free article] [PubMed] [Google Scholar]
- 115.She P, et al. Obesity-related elevations in plasma leucine are associated with alterations in enzymes involved in branched chain amino acid (BCAA) metabolism. American journal of physiology. Endocrinology and metabolism. 2007;293(6):E1552–E1563. doi: 10.1152/ajpendo.00134.2007. [DOI] [PMC free article] [PubMed] [Google Scholar]
- 116.Green CR, et al. Branched-chain amino acid catabolism fuels adipocyte differentiation and lipogenesis. Nat Chem Biol. 2016;12(1):15–21. doi: 10.1038/nchembio.1961. [DOI] [PMC free article] [PubMed] [Google Scholar]
- 117.Newgard CB, et al. A Branched-Chain Amino Acid-Related Metabolic Signature that Differentiates Obese and Lean Humans and Contributes to Insulin Resistance. Cell metabolism. 2009;9(4):311–326. doi: 10.1016/j.cmet.2009.02.002. [DOI] [PMC free article] [PubMed] [Google Scholar]
- 118.Wu Z, et al. Regulation of brown adipose tissue development and white fat reduction by L-arginine. Curr Opin Clin Nutr Metab Care. 2012;15(6):529–38. doi: 10.1097/MCO.0b013e3283595cff. [DOI] [PubMed] [Google Scholar]
- 119.Satterfield MC, et al. Arginine nutrition and fetal brown adipose tissue development in nutrient-restricted sheep. Amino Acids. 2013;45(3):489–99. doi: 10.1007/s00726-011-1168-8. [DOI] [PubMed] [Google Scholar]
- 120.Efeyan A, et al. RagA, but not RagB, is essential for embryonic development and adult mice. Developmental cell. 2014;29(3):321–329. doi: 10.1016/j.devcel.2014.03.017. [DOI] [PMC free article] [PubMed] [Google Scholar]
- 121.Kim YC, et al. Rag GTPases are cardioprotective by regulating lysosomal function. Nature Communications. 2014;5:4241. doi: 10.1038/ncomms5241. [DOI] [PMC free article] [PubMed] [Google Scholar]
- 122.Yuan M, et al. Identification of Akt-independent regulation of hepatic lipogenesis by mammalian target of rapamycin (mTOR) complex 2. J Biol Chem. 2012;287(35):29579–88. doi: 10.1074/jbc.M112.386854. [DOI] [PMC free article] [PubMed] [Google Scholar]
- 123.Hagiwara A, et al. Hepatic mTORC2 activates glycolysis and lipogenesis through Akt, glucokinase, and SREBP1c. Cell Metab. 2012;15(5):725–38. doi: 10.1016/j.cmet.2012.03.015. [DOI] [PubMed] [Google Scholar]
- 124.Gaubitz C, et al. TORC2 Structure and Function. Trends Biochem Sci. 2016;41(6):532–45. doi: 10.1016/j.tibs.2016.04.001. [DOI] [PubMed] [Google Scholar]
- 125.Jacinto E, et al. Mammalian TOR complex 2 controls the actin cytoskeleton and is rapamycin insensitive. Nat Cell Biol. 2004;6(11):1122–8. doi: 10.1038/ncb1183. [DOI] [PubMed] [Google Scholar]
- 126.Sarbassov DD, et al. Rictor, a novel binding partner of mTOR, defines a rapamycin-insensitive and raptor-independent pathway that regulates the cytoskeleton. Curr Biol. 2004;14(14):1296–302. doi: 10.1016/j.cub.2004.06.054. [DOI] [PubMed] [Google Scholar]
- 127.Loewith R, et al. Two TOR complexes, only one of which is rapamycin sensitive, have distinct roles in cell growth control. Mol Cell. 2002;10(3):457–68. doi: 10.1016/s1097-2765(02)00636-6. [DOI] [PubMed] [Google Scholar]
- 128.Hatano T, et al. Fission yeast Ryh1 GTPase activates TOR Complex 2 in response to glucose. Cell Cycle. 2015;14(6):848–56. doi: 10.1080/15384101.2014.1000215. [DOI] [PMC free article] [PubMed] [Google Scholar]
- 129.Khanna A, et al. The small GTPases Ras and Rap1 bind to and control TORC2 activity. Sci Rep. 2016;6:25823. doi: 10.1038/srep25823. [DOI] [PMC free article] [PubMed] [Google Scholar]
- 130.Vance JE. MAM (mitochondria-associated membranes) in mammalian cells: lipids and beyond. Biochim Biophys Acta. 2014;1841(4):595–609. doi: 10.1016/j.bbalip.2013.11.014. [DOI] [PubMed] [Google Scholar]
- 131.Arriola Apelo SI, Lamming DW. mTORC2 Puts Its Shoulder to Krebs' Wheel. Mol Cell. 2016;63(5):723–5. doi: 10.1016/j.molcel.2016.08.016. [DOI] [PubMed] [Google Scholar]
- 132.Moloughney JG, et al. mTORC2 Responds to Glutamine Catabolite Levels to Modulate the Hexosamine Biosynthesis Enzyme GFAT1. Mol Cell. 2016;63(5):811–26. doi: 10.1016/j.molcel.2016.07.015. [DOI] [PMC free article] [PubMed] [Google Scholar]
- 133.Mullins GR, et al. Catecholamine-induced lipolysis causes mTOR complex dissociation and inhibits glucose uptake in adipocytes. Proceedings of the National Academy of Sciences of the United States of America. 2014;111(49):17450–17455. doi: 10.1073/pnas.1410530111. [DOI] [PMC free article] [PubMed] [Google Scholar]
- 134.Zhang C, et al. Glycerolipid signals alter mTOR complex 2 (mTORC2) to diminish insulin signaling. Proc Natl Acad Sci U S A. 2012;109(5):1667–72. doi: 10.1073/pnas.1110730109. [DOI] [PMC free article] [PubMed] [Google Scholar]
- 135.Humphrey SJ, et al. Dynamic adipocyte phosphoproteome reveals that Akt directly regulates mTORC2. Cell Metab. 2013;17(6):1009–20. doi: 10.1016/j.cmet.2013.04.010. [DOI] [PMC free article] [PubMed] [Google Scholar]
- 136.Yang G, et al. A Positive Feedback Loop between Akt and mTORC2 via SIN1 Phosphorylation. Cell Rep. 2015;12(6):937–43. doi: 10.1016/j.celrep.2015.07.016. [DOI] [PubMed] [Google Scholar]
- 137.Saci A, Cantley LC, Carpenter CL. Rac1 regulates the activity of mTORC1 and mTORC2 and controls cellular size. Mol Cell. 2011;42(1):50–61. doi: 10.1016/j.molcel.2011.03.017. [DOI] [PMC free article] [PubMed] [Google Scholar]
- 138.Arias E. Lysosomal mTORC2/PHLPP1/Akt axis: a new point of control of chaperone-mediated autophagy. Oncotarget. 2015;6(34):35147–8. doi: 10.18632/oncotarget.5903. [DOI] [PMC free article] [PubMed] [Google Scholar]
- 139.Berchtold D, Walther TC. TORC2 plasma membrane localization is essential for cell viability and restricted to a distinct domain. Mol Biol Cell. 2009;20(5):1565–75. doi: 10.1091/mbc.E08-10-1001. [DOI] [PMC free article] [PubMed] [Google Scholar]
- 140.Betz C, et al. Feature Article: mTOR complex 2-Akt signaling at mitochondria-associated endoplasmic reticulum membranes (MAM) regulates mitochondrial physiology. Proc Natl Acad Sci U S A. 2013;110(31):12526–34. doi: 10.1073/pnas.1302455110. [DOI] [PMC free article] [PubMed] [Google Scholar]
- 141.Boulbes DR, Shaiken T, Sarbassov dos D. Endoplasmic reticulum is a main localization site of mTORC2. Biochem Biophys Res Commun. 2011;413(1):46–52. doi: 10.1016/j.bbrc.2011.08.034. [DOI] [PMC free article] [PubMed] [Google Scholar]
- 142.Zhou P, et al. Defining the Domain Arrangement of the Mammalian Target of Rapamycin Complex Component Rictor Protein. J Comput Biol. 2015;22(9):876–86. doi: 10.1089/cmb.2015.0103. [DOI] [PMC free article] [PubMed] [Google Scholar]
- 143.Zinzalla V, et al. Activation of mTORC2 by association with the ribosome. Cell. 2011;144(5):757–68. doi: 10.1016/j.cell.2011.02.014. [DOI] [PubMed] [Google Scholar]
- 144.Partovian C, et al. Syndecan-4 regulates subcellular localization of mTOR Complex2 and Akt activation in a PKCalpha-dependent manner in endothelial cells. Mol Cell. 2008;32(1):140–9. doi: 10.1016/j.molcel.2008.09.010. [DOI] [PMC free article] [PubMed] [Google Scholar]
- 145.Garcia-Martinez JM, Alessi DR. mTOR complex 2 (mTORC2) controls hydrophobic motif phosphorylation and activation of serum- and glucocorticoid-induced protein kinase 1 (SGK1) Biochem J. 2008;416(3):375–85. doi: 10.1042/BJ20081668. [DOI] [PubMed] [Google Scholar]
- 146.Jacinto E, et al. SIN1/MIP1 maintains rictor-mTOR complex integrity and regulates Akt phosphorylation and substrate specificity. Cell. 2006;127(1):125–37. doi: 10.1016/j.cell.2006.08.033. [DOI] [PubMed] [Google Scholar]
- 147.Duffy MA, et al. Ecological context influences epidemic size and parasite-driven evolution. Science. 2012;335(6076):1636–8. doi: 10.1126/science.1215429. [DOI] [PubMed] [Google Scholar]
- 148.Lazorchak AS, et al. Sin1-mTORC2 suppresses rag and il7r gene expression through Akt2 in B cells. Mol Cell. 2010;39(3):433–43. doi: 10.1016/j.molcel.2010.07.031. [DOI] [PMC free article] [PubMed] [Google Scholar]
- 149.Pearce LR, et al. Protor-1 is required for efficient mTORC2-mediated activation of SGK1 in the kidney. Biochem J. 2011;436(1):169–79. doi: 10.1042/BJ20102103. [DOI] [PubMed] [Google Scholar]
- 150.Zeng H, et al. mTORC1 and mTORC2 Kinase Signaling and Glucose Metabolism Drive Follicular Helper T Cell Differentiation. Immunity. 2016;45(3):540–54. doi: 10.1016/j.immuni.2016.08.017. [DOI] [PMC free article] [PubMed] [Google Scholar]
- 151.Rodrik-Outmezguine VS, et al. mTOR kinase inhibition causes feedback-dependent biphasic regulation of AKT signaling. Cancer Discov. 2011;1(3):248–59. doi: 10.1158/2159-8290.CD-11-0085. [DOI] [PMC free article] [PubMed] [Google Scholar]
- 152.Peterson TR, et al. DEPTOR Is an mTOR Inhibitor Frequently Overexpressed in Multiple Myeloma Cells and Required for Their Survival. Cell. 2009;137(5):873–886. doi: 10.1016/j.cell.2009.03.046. [DOI] [PMC free article] [PubMed] [Google Scholar]
- 153.Mora A, et al. PDK1, the master regulator of AGC kinase signal transduction. Semin Cell Dev Biol. 2004;15(2):161–70. doi: 10.1016/j.semcdb.2003.12.022. [DOI] [PubMed] [Google Scholar]
- 154.Masui K, et al. mTOR complex 2 controls glycolytic metabolism in glioblastoma through FoxO acetylation and upregulation of c-Myc. Cell Metab. 2013;18(5):726–39. doi: 10.1016/j.cmet.2013.09.013. [DOI] [PMC free article] [PubMed] [Google Scholar]
- 155.Benavides-Serrato A, et al. mTORC2 modulates feedback regulation of p38 MAPK activity via DUSP10/MKP5 to confer differential responses to PP242 in glioblastoma. Genes & Cancer. 2014;5(11–12):393–406. doi: 10.18632/genesandcancer.41. [DOI] [PMC free article] [PubMed] [Google Scholar]
- 156.Chen Y, et al. mTOR complex-2 stimulates acetyl-CoA and de novo lipogenesis through ATP citrate lyase in HER2/PIK3CA-hyperactive breast cancer. Oncotarget. 2016;7(18):25224–40. doi: 10.18632/oncotarget.8279. [DOI] [PMC free article] [PubMed] [Google Scholar]
- 157.Wulff P, et al. Impaired renal Na(+) retention in the sgk1-knockout mouse. J Clin Invest. 2002;110(9):1263–8. doi: 10.1172/JCI15696. [DOI] [PMC free article] [PubMed] [Google Scholar]
- 158.Leitges M, et al. Knockout of PKC alpha enhances insulin signaling through PI3K. Mol Endocrinol. 2002;16(4):847–58. doi: 10.1210/mend.16.4.0809. [DOI] [PubMed] [Google Scholar]
- 159.Ghisdal L, et al. New-Onset Diabetes After Renal Transplantation. Diabetes Care. 2011;35(1):181. doi: 10.2337/dc11-1230. [DOI] [PMC free article] [PubMed] [Google Scholar]
- 160.Palepu S, Prasad GV. New-onset diabetes mellitus after kidney transplantation: Current status and future directions. World J Diabetes. 2015;6(3):445–55. doi: 10.4239/wjd.v6.i3.445. [DOI] [PMC free article] [PubMed] [Google Scholar]
- 161.Johnston O, et al. Sirolimus Is Associated with New-Onset Diabetes in Kidney Transplant Recipients. Journal of the American Society of Nephrology : JASN. 2008;19(7):1411–1418. doi: 10.1681/ASN.2007111202. [DOI] [PMC free article] [PubMed] [Google Scholar]
- 162.Yilmaz VT, et al. New-Onset Diabetes Mellitus Associated with Sirolimus Use in Renal Transplant Recipients. The Eurasian Journal of Medicine. 2015;47(3):213–215. doi: 10.5152/eurasianjmed.2015.049. [DOI] [PMC free article] [PubMed] [Google Scholar]
- 163.Lamming DW, et al. Rapamycin-induced insulin resistance is mediated by mTORC2 loss and uncoupled from longevity. Science. 2012;335(6076):1638–43. doi: 10.1126/science.1215135. [DOI] [PMC free article] [PubMed] [Google Scholar]
- 164.Foster DA, Toschi A. Targeting mTOR with rapamycin: One dose does not fit all. Cell cycle (Georgetown, Tex.) 2009;8(7):1026–1029. doi: 10.4161/cc.8.7.8044. [DOI] [PMC free article] [PubMed] [Google Scholar]
- 165.Xie J, Wang X, Proud CG. mTOR inhibitors in cancer therapy. F1000Research. 2016;5 doi: 10.12688/f1000research.9207.1. p. F1000 Faculty Rev-2078. [DOI] [PMC free article] [PubMed] [Google Scholar]
- 166.Zaytseva YY, et al. mTOR inhibitors in cancer therapy. Cancer Letters. 2012;319(1):1–7. doi: 10.1016/j.canlet.2012.01.005. [DOI] [PubMed] [Google Scholar]
- 167.Forbes SA, et al. COSMIC: mining complete cancer genomes in the Catalogue of Somatic Mutations in Cancer. Nucleic Acids Res. 2011;39(Database issue):D945–50. doi: 10.1093/nar/gkq929. [DOI] [PMC free article] [PubMed] [Google Scholar]
- 168.Rodrik-Outmezguine VS, et al. Overcoming mTOR resistance mutations with a new-generation mTOR inhibitor. Nature. 2016;534(7606):272–276. doi: 10.1038/nature17963. [DOI] [PMC free article] [PubMed] [Google Scholar]
- 169.Esteve Rafols M. Adipose tissue: cell heterogeneity and functional diversity. Endocrinol Nutr. 2014;61(2):100–12. doi: 10.1016/j.endonu.2013.03.011. [DOI] [PubMed] [Google Scholar]
- 170.Jeffery E, et al. The Adipose Tissue Microenvironment Regulates Depot-Specific Adipogenesis in Obesity. Cell Metab. 2016;24(1):142–50. doi: 10.1016/j.cmet.2016.05.012. [DOI] [PMC free article] [PubMed] [Google Scholar]
- 171.Brunn GJ, et al. Phosphorylation of the Translational Repressor PHAS-I by the Mammalian Target of Rapamycin. Science. 1997;277(5322):99. doi: 10.1126/science.277.5322.99. [DOI] [PubMed] [Google Scholar]
- 172.Burnett PE, et al. RAFT1 phosphorylation of the translational regulators p70 S6 kinase and 4E-BP1. Proceedings of the National Academy of Sciences. 1998;95(4):1432–1437. doi: 10.1073/pnas.95.4.1432. [DOI] [PMC free article] [PubMed] [Google Scholar]
- 173.Ganley IG, et al. ULK1.ATG13.FIP200 complex mediates mTOR signaling and is essential for autophagy. J Biol Chem. 2009;284(18):12297–305. doi: 10.1074/jbc.M900573200. [DOI] [PMC free article] [PubMed] [Google Scholar]
- 174.Hosokawa N, et al. Nutrient-dependent mTORC1 association with the ULK1-Atg13-FIP200 complex required for autophagy. Mol Biol Cell. 2009;20(7):1981–91. doi: 10.1091/mbc.E08-12-1248. [DOI] [PMC free article] [PubMed] [Google Scholar]
- 175.Facchinetti V, et al. The mammalian target of rapamycin complex 2 controls folding and stability of Akt and protein kinase C. Embo j. 2008;27(14):1932–43. doi: 10.1038/emboj.2008.120. [DOI] [PMC free article] [PubMed] [Google Scholar]
- 176.Sehgal SN. Sirolimus: its discovery, biological properties, and mechanism of action. Transplant Proc. 2003;35(3 Suppl):7s–14s. doi: 10.1016/s0041-1345(03)00211-2. [DOI] [PubMed] [Google Scholar]
- 177.Geoerger B, et al. Antitumor activity of the rapamycin analog CCI-779 in human primitive neuroectodermal tumor/medulloblastoma models as single agent and in combination chemotherapy. Cancer Res. 2001;61(4):1527–32. [PubMed] [Google Scholar]
- 178.Di Maira G, et al. Protein kinase CK2 phosphorylates and upregulates Akt/PKB. Cell Death Differ. 2005;12(6):668–77. doi: 10.1038/sj.cdd.4401604. [DOI] [PubMed] [Google Scholar]
- 179.Knight ZA, Lin H, Shokat KM. Targeting the cancer kinome through polypharmacology. Nat Rev Cancer. 2010;10(2):130–137. doi: 10.1038/nrc2787. [DOI] [PMC free article] [PubMed] [Google Scholar]
- 180.Zhang J, et al. Epidermal growth factor receptor tyrosine kinase inhibitors in the treatment of central nerve system metastases from non-small cell lung cancer. Cancer Lett. 2014;351(1):6–12. doi: 10.1016/j.canlet.2014.04.019. [DOI] [PubMed] [Google Scholar]
- 181.Chresta CM, et al. AZD8055 is a potent, selective, and orally bioavailable ATP-competitive mammalian target of rapamycin kinase inhibitor with in vitro and in vivo antitumor activity. Cancer Res. 2010;70(1):288–98. doi: 10.1158/0008-5472.CAN-09-1751. [DOI] [PubMed] [Google Scholar]
- 182.Hsieh AC, et al. The translational landscape of mTOR signalling steers cancer initiation and metastasis. Nature. 2012;485(7396):55–61. doi: 10.1038/nature10912. [DOI] [PMC free article] [PubMed] [Google Scholar]
- 183.Wang T, et al. LST8 regulates cell growth via target-of-rapamycin complex 2 (TORC2) Mol Cell Biol. 2012;32(12):2203–13. doi: 10.1128/MCB.06474-11. [DOI] [PMC free article] [PubMed] [Google Scholar]
- 184.Yip CK, et al. Structure of the Human mTOR Complex I and Its Implications for Rapamycin Inhibition. Molecular Cell. 2010;38(5):768–774. doi: 10.1016/j.molcel.2010.05.017. [DOI] [PMC free article] [PubMed] [Google Scholar]
- 185.Wiza C, Nascimento EB, Ouwens DM. Role of PRAS40 in Akt and mTOR signaling in health and disease. Am J Physiol Endocrinol Metab. 2012;302(12):E1453–60. doi: 10.1152/ajpendo.00660.2011. [DOI] [PubMed] [Google Scholar]
- 186.Sancak Y, et al. Ragulator-Rag complex targets mTORC1 to the lysosomal surface and is necessary for its activation by amino acids. Cell. 2010;141(2):290–303. doi: 10.1016/j.cell.2010.02.024. [DOI] [PMC free article] [PubMed] [Google Scholar]
- 187.Pearce LR, et al. Identification of Protor as a novel Rictor-binding component of mTOR complex-2. Biochem J. 2007;405(3):513–22. doi: 10.1042/BJ20070540. [DOI] [PMC free article] [PubMed] [Google Scholar]
- 188.Yang H, et al. mTOR kinase structure, mechanism and regulation. Nature. 2013;497(7448):217–23. doi: 10.1038/nature12122. [DOI] [PMC free article] [PubMed] [Google Scholar]
- 189.Aylett CH, et al. Architecture of human mTOR complex 1. Science. 2016;351(6268):48–52. doi: 10.1126/science.aaa3870. [DOI] [PubMed] [Google Scholar]
- 190.Wullschleger S, et al. Molecular Organization of Target of Rapamycin Complex 2. Journal of Biological Chemistry. 2005;280(35):30697–30704. doi: 10.1074/jbc.M505553200. [DOI] [PubMed] [Google Scholar]
- 191.Gaubitz C, et al. Molecular Basis of the Rapamycin Insensitivity of Target Of Rapamycin Complex 2. Molecular Cell. 2015;58(6):977–988. doi: 10.1016/j.molcel.2015.04.031. [DOI] [PubMed] [Google Scholar]