Abstract
The present study highlights a sensing approach for opiates using acyclic cucurbituril (aCBs) sensors comprising four glycouril units terminated on both ends with naphthalene fluorophore walls. The connectivity between the glycourils and naphthalene rings largely defines the opening size of the cucurbituril cavity and its diameter. The large hydrophobic binding cavity is flexible and is able to adapt to guests of various size and topology. The recognition event between the aCBs and guests results in modification of the fluorescence of the terminal walls, a fluorescence response that can be used to sense the drugs of abuse morphine, heroin, and oxycodone as well as their metabolites. Molecular dynamics is employed to understand the nature of the binding interactions. A simple three sensor cross-reactive array enables the determination of drugs and their metabolites in water with high fidelity and low error. Quantitative experiments performed in urine using a new three-way calibration model allows for determination of drugs and their metabolites using one sensor from a single fluorescence reading.
INTRODUCTION
Drugs of abuse, both misused prescription and illicit drugs, have become a serious health issue and global problem during the last decades.1 Many analytical methods, based on diverse principles, have been developed for the detection of drugs of abuse, and some have become available in clinical, forensic and occupational toxicology. These include GC-MS,2 LC-MS,3 capillary electrophoresis (CE),4 infrared (IR),5 Raman6 and terahertz spectroscopy,7 and immunoassays,8 most of which are relatively expensive and require trained personnel. Stand-alone luminescence is less frequently used9 except as a detection modality in the above techniques. Luminescence-based methods that are rapid, sensitive, inexpensive and amenable to high-throughput screening of large number of samples are sought.
Supramolecular receptors and chemosensors for the detection and recognition of illicit drugs have been reported.10 However, direct turn-on fluorescent chemosensors that operate in water or in complex biological milieu such as urine are rare.11 Aiming to fill this gap, we decided to explore the potential of fluorescent acyclic cucurbituril (aCB) derivatives with a flexible cavity12 to bind opiate drugs (Figure 1) and their metabolites. The advantage of the aCBs is that they can adapt their flexible cavity to accommodate the drug by an induced fit mechanism, while also binding ammonium ions via ion-dipole interactions and hydrogen bonding to the C=O moieties of the ureidyl portals.13
Figure 1.
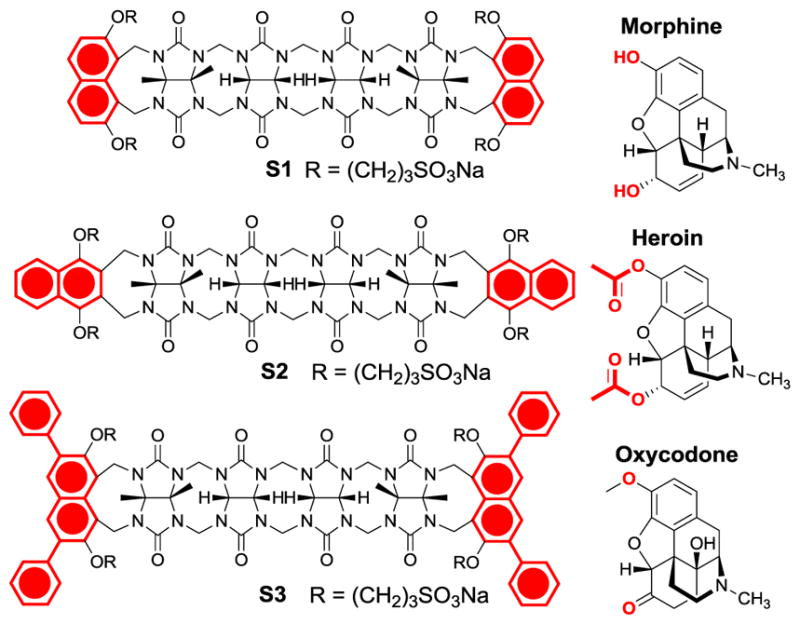
Structure of sensors (S1–S3) and main drugs used in this study.
RESULTS AND DISCUSSION
Here, we utilize three fluorescent aCBs that differ in the structure and steric demand of the terminal walls (Figure 1, substituted naphthalene moieties highlighted in red). The steric demand of the walls partly defines the diameter of the binding pocket and in turn also the preference for the size of the guests.14
As guests, three main drugs were used: Morphine (MOR), heroin (HER) and oxycodone (OXY) (Figure 1). Their selection was made because of their pharmaceutical and societal impact. Moreover, their main metabolites are well known and commercially available and could therefore be included in this study. Thus, the main metabolites of morphine are normorphine (NMOR) morphine-3-glucuronide (M3G) and morphine-6-glucuronide (M6G) (Figure 2, Top).15,16 The main metabolites of heroin16 are morphine (MOR), normorphine (NMOR) and 6-monoacetylmorphine (6-MAM). Finally, the metabolites of oxycodone16 are noroxycodone (NOXY) and oxymorphone (OXM) (Figure 2, Bottom).
Figure 2.
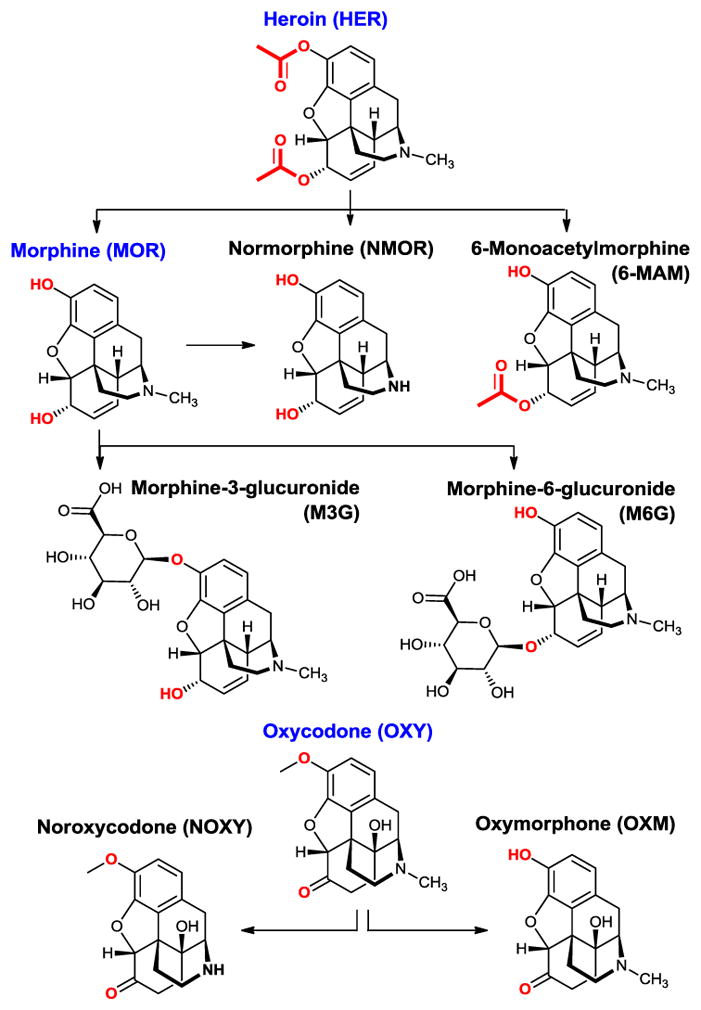
The guests used in this study are main metabolites of morphine, heroin and oxycodone.
All the guests used in this study are opiates comprising a common polycyclic skeleton. Indeed, the structural differences are relatively small, making the accurate recognition of these guests a challenge for supramolecular sensors. However, the relatively flexible nature of the aCBs enables them to wrap around the guests achieving surprisingly effective recognition events as suggested by the magnitude of the association constant. Also, an important factor is the strikingly different change of the sensor fluorescence in response to the presence of different guests. In most cases, the drug guests induce a “turn-on” response of the sensor. The fluorescence originates from the intramolecular chromophores (naphthalene walls) of the aCBs. The fluorescence amplification is, presumably, due to the increased rigidity of the sensor in the complex, which prevents intramolecular collisions between the fluorescent walls, which would otherwise result in non-radiative decay.17 The exception is oxycodone and its derivatives that comprise the cyclohexanone moiety, which quenches the fluorescence of the aCBs.18 This is not surprising since cyclohexanone, like other aliphatic ketones, is an effective quencher of the naphthalene singlet state.18b
The structure of S1 was studied in the solid state using X-ray diffraction. The complex of S1 with acetone is shown in Figure 3. Similarly to S2, S1 also adopts a C-shaped conformation attributed to the polycyclic nature of the glycoluril tetramer backbone with solubilizing propoxysulfonate side-chains pointing above and below the glycouril plane. The acetone molecule was found in the centre of the binding cavity with the glycouril moieties wrapped tightly around the acetone guest.
Figure 3.
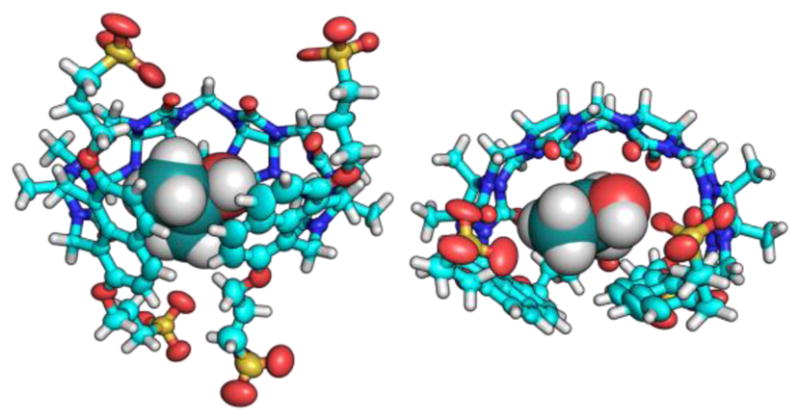
The x-ray crystal structure of the resting state of S1 with acetone molecule inside the cavity. Left: side view. Right: top view. Thermal ellipsoids are scaled to 50% probability level.
To gain further insight into the structure of the aCBs and host-guest interactions, we run molecular dynamics simulations. Computational modelling will allow us to visualize the sensor both in the presence and absence of the guest, and give insight into the mechanism of fluorescence amplification upon guest binding. The calculations were performed on reduced sensor models where the R group from Figure 1 is replaced by H. Bonds, angles, and torsions were parameterized using the generalized Amber force field (GAFF).19 Atomic charges for both the host and guest are obtained with the AM1-BCC20 protocol (charge model with simple additive bond charge corrections). The host, guest, and host-guest complex molecules were each solvated in a water solvent box including 1,500 water molecules, which is described with TIP3P (transferable intermolecular potential with 3-points) parameters21. Energy minimization was performed, followed by a 2 ns NVT (constant temperature/constant volume) simulation for thermal equilibration. A 40 ns NPT (constant temperature/constant pressure) ensemble was then run to estimate the average volume of the solvation box. Finally, this was followed by a 250 ns NVT production run, which was used to extract binding energies and find representative structures for the host-guest complex. Representative structures of S1, S2, and S3 with and without heroin are shown in Figure 4. Representative structures for the binding of S2 with other drugs and metabolites are also shown in Figure S20–S24 in the supporting information. Note that the “representative” structures were chosen as the lowest energy structures probed by the final 250 ns NVT trajectory. Analysis of the root mean square deviation (RMSD) of the structures along the trajectory from this minimum shows that the minimum structure is representative of the ensemble in almost all cases, except for S2+NOXY where there are larger variations in the RMSD (see SI figure S25–S32). We also use the molecular dynamics simulations to compute binding energies averaged over the 250 ns NVT simulation of the host-guest complex. To do this, we also ran similar dynamics using the same protocol described above, but this time looking at the solvated guest alone, the solvated host alone, and an empty 1500-water solvent box. Although binding energies are not supposed to be directly comparable to experiment due to the different substituent (R), we might expect similar trends. Indeed, computed binding energies are overall in good agreement with the experiment, the trend in binding energies for MOR, NOXY OXY, NMOR, and 6MAM with S2 is well reproduced (Table S6 and S7 in the SI).
Figure 4.
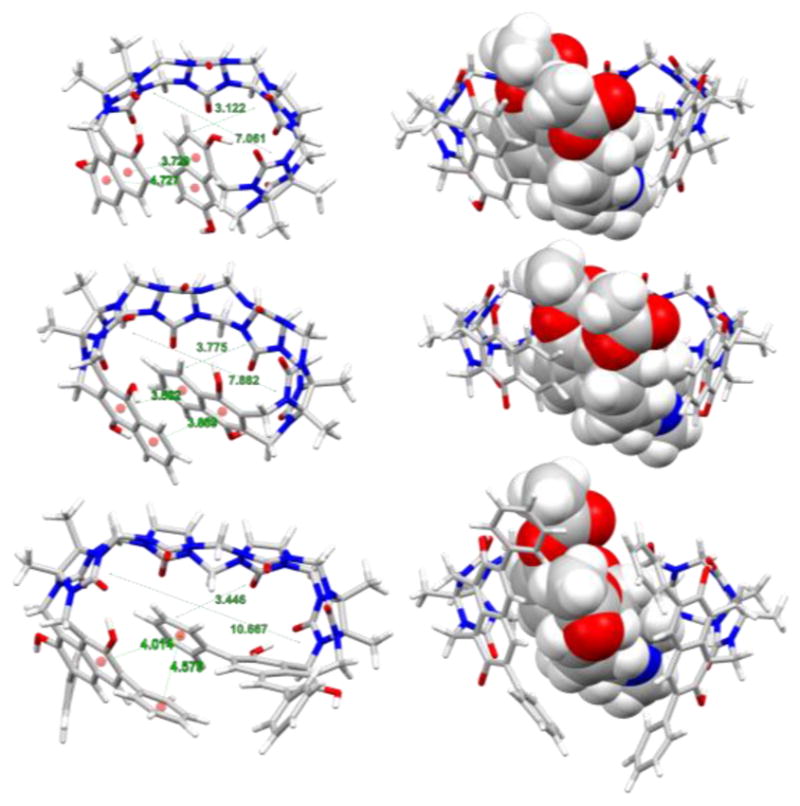
Minimum energy structures found along 200ns MD simulation. Left column: Sensors S1–S3 in the unbound state feature a weak displaced π-π interactions with centroid-centroid distances between 3.5 and 4.5 Å), Right column: Host-Guest complexes with encapsulated heroin molecules.
The molecular dynamics calculations above confirmed our hypothesis that the naphthalene terminals and their connection to the glycouril fragments define the shape and the topology of the aCB’s binding cavity in the unbound state (Figure 4), which we believe to be a decisive factor for fluorescence signal amplification as well as the guest uptake. Notably, Figure 4 shows that in the unbound state (Left column) the size of the cavity and volume of the aCB receptors increases from S1 to S3 while displaying weak displaced π-π stacking interactions of the fluorescent walls (naphthalene centroid-centroid distances were found to be between 3.5 and 4.5 Å, see Figure 4). This distance is not close enough to suggest π-π stacking, but it is close enough to cause strong intramolecular collisional quenching (end-to-end collision).17,22 Upon binding of the guest such as heroin, the binding cavity expands thereby bringing the naphthalene fluorophores out of the effective end-to-end collision range. This interaction of the wall moieties with relative stacking efficiency S1>S2>S3 also explains the general trend in morphine and heroin binding by the sensors characterized by the affinity constants (S1<S2<S3). The calculations also confirm that the guest inclusion drives the fluorescent walls further apart (Figure 3, Right column) thereby increasing the likelihood of generating fluorescence amplification. Figure 5 shows representative examples of the aCB S2 when titrated with opiate drugs. Figure 5 shows differential response of S1, S2 and S3 to heroin, morphine and oxycodone.
Figure 5.
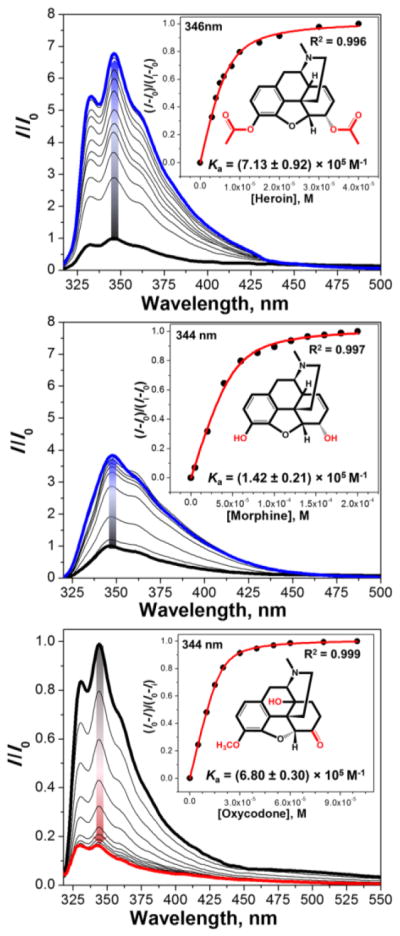
Fluorescence titration profiles of S2 (3 μM) with opiates in H2O (pH 3, HCl). Top: [heroin] = 0–40 μM, λex = 310 nm; Middle: [morphine] = 0–200 μM, λex = 305 nm; Bottom: [oxycodone] = 0–100 μM, λex= 290 nm; Graph insets show titration isotherms based on the change of fluorescence intensity at max. wavelength.
The guest-induced responses of sensors S1, S2 and S3 to the drugs of interest suggest that the sensors are cross-reactive. Fortunately, the responses of S1, S2 and S3 differ in the amplitude and saturation of the fluorescence change. Thus, each analyte-sensor binding event is characterized by a different binding isotherm and a corresponding affinity constant (Table 1). Affinity constants represented in Table 1 are comparable to the ones reported for antibodies based fluorescence immunoassays.23 To the best of our knowledge, there are no fluorescence-based sensors for opiates and their metabolites that successfully operate in water and urine.
Table 1.
Affinity constants Ka (× 105 M−1)a corresponding to sensor titrations with various opiate guests.
|
Ka (× 105 M−1)
| |||
|---|---|---|---|
| Guest | S1 | S2 | S3 |
| Morphine | 0.91 | 1.42 | 2.48 |
| Heroin | 6.40 | 7.13 | 7.01 |
| Oxycodon | 0.10 | 6.80 | 0.13 |
| M3G | 130 | 10.40 | 7.37 |
| Normorphine | 2.10 | 2.83 | 15.0 |
| 6-MAM | 4.80 | 3.18 | 2.86 |
The titrations recorded in H2O (pH 3, HCl) and Kas are calculated based on the change in fluorescence intensity upon addition of each guest, using non-linear least-squares. All errors were < 15%.
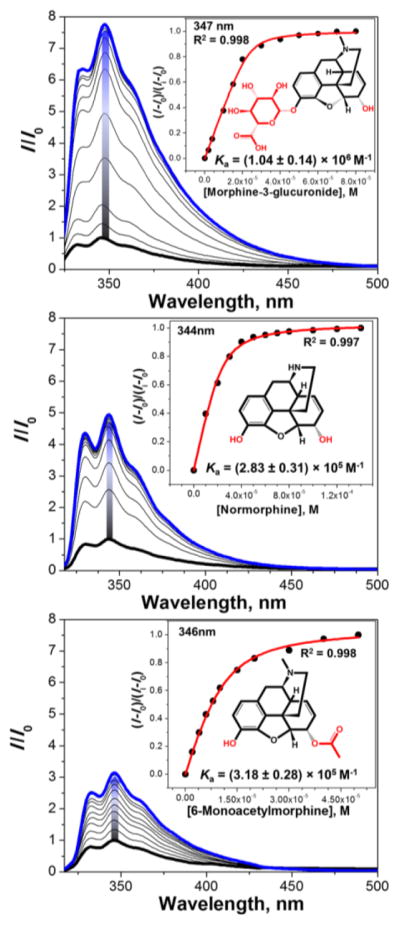
Importantly, the sensors S1, S2 and S3 respond differently to the parent drugs and their metabolites. This allows us to distinguish the metabolites from the parent drugs in both a qualitative and quantitative manner. Figure 6 shows S2 and metabolites of heroin (Figure 2), morphine-3-glucuronide (M3G), morphine (MOR) (Figure 2), normorphine (NMOR) and 6-monoacetylmorphine (6-MAM). One can also see that the degree of the fluorescence response correlates with the magnitude of the affinity constant.
Figure 6.
Fluorescence titration profiles of S2 (3 μM) with main metabolites of morphine and heroin in H2O (pH 3, HCl). Top: [morphine-3-glucuronide] = 0–80 μM, λex = 310 nm; Middle: [normorphine] = 0–140 μM, λex = 310 nm; Bottom: [6-monoacetylmorphine] = 0–50 μM, λex = 310 nm; Graph insets show titration isotherms based on the change of fluorescence intensity at maximum.
Thus, the qualitative assay was performed in a high-throughput fashion utilizing a 1536-well plate and commercial liquid dispensing/plate reader platforms. The fluorescence responses corresponding to the parent drugs (HER, MOR, OXY) and their main metabolites were analysed using linear discriminant analysis (LDA).24 LDA is a supervised pattern recognition method for reduction of dimensionality and classification of the multivariate data. LDA models the similarity by maximizing the distance between the classes and minimizing the distance between the trials. Cross-validation is performed to ascertain the level of correct classification of the observations within the clusters. The LDA shown in Figure 7 bottom panel shows response space defined by the first three canonical factors combining the fluorescence responses from the three sensors.
Figure 7.
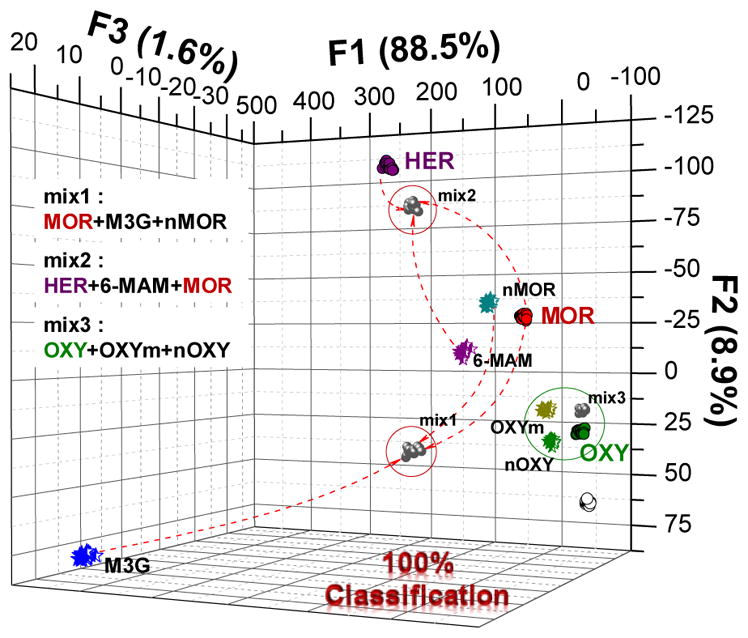
Qualitative linear discriminant analysis (LDA) of heroin (purple), morphine (red) and oxycodone (green) and their main metabolites, and mixtures (black) in H2O. Mix1: MOR+M3G+nMOR; mix2: HER+6-MAM+MOR; mix3: OXY+OXYm+nOXY. [S1] = 3 μM, [S2] = 3 μM, [S3] = 0.3 μM, [analyte] = 5 μM.
The greatest discriminatory power is espoused by S1 and S2 (over S3). Based on the LDA, it is difficult to compare the contributions of both sensors to the individual canonical factors. It appears that S1 contributes most to the discrimination of the structurally similar drugs from their metabolites (as reflected in the canonical factor F1). Because of the highly variable signal originating from fluorescence changes in S1, S1 has a high impact on the information carried by F1. On the other hand, S2 discriminates between the parent drugs and their metabolite groups (as reflected by F2) (Figure 7).
The LDA shows that the analytes form three clusters: Heroin and its metabolites, morphine and derivatives and oxycodone and metabolites. Also, three mixtures (mix 1–3) comprising the parent drug and two main metabolites were found clustering in a close vicinity of the components indicating that the response is a linear combination of effects of the components. This feature is very important for the quantitative analysis of complex mixtures.
Following the qualitative recognition of the opiates by array of sensors S1–S3 we have performed also a quantitative analysis of ternary mixtures of morphine and metabolites in aqueous media and a direct urinalysis.16
In the real samples the MOR concentration decreases while the M3G metabolite is formed fastest and the NMOR is formed at a significantly lower rate. Therefore, the following experiment was set up in the similar manner using the concentrations of drugs frequently observed in biological samples as they are eliminated from the organism within eight hours following the administration.15 First, ternary mixtures (combination of MOR, NMOR and M3G) were prepared in pure water in a way that the concentrations of M3G and nMOR were increasing (from 0 to 3.85 ppm and from 0 to 0.28 ppm, respectively) as the concentration of parent MOR was decreasing (from 0.7 to 0 ppm). For each mixture, 20 repetitions were measured, and the standard deviation (< 4%) was calculated. The LDA was performed to provide insight into the clustering and progression of the changes in the sensor response. The step-wise changes of the mixtures components result in a smooth response curve, reflecting the gradual changes in mixture composition. This suggests that the described method would be able to analyse ternary mixtures and may be of use in metabolite determination. The three-probe array yielded a very accurate quantitative regression analysis of the ternary mixtures using a support vector machine (SVM) algorithm (Figure 8, also see SI p. S15–S18). The corresponding correlation graph between the predicted and the actual concentration of MOR (Figure 8) was characterized by a regression (R2) of 1, 0.999989, and 0.997589 for calibration, cross-validation and prediction, respectively.
Figure 8.
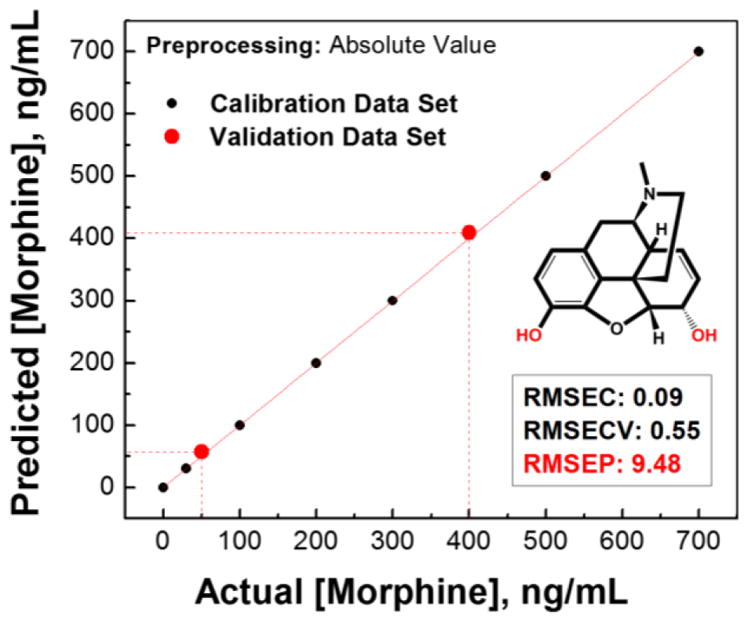
The results of simultaneous quantitative linear regression analysis of the morphine in ternary mixtures of morphine and its metabolites using support vector machine (SVM) algorithm, with 2 components of partial least squares regression (PLS) for multivariate X-block data compression. The root-mean-square errors (RMSEs) of calibration (C), cross-validation (CV), and prediction (P) attest to the quality of the model and prediction. Two unknown/validation samples (red circle
 ) were simultaneously correctly analyzed for MOR (50 and 400 ng/mL).
Limits of detection (LOD) in aqueous media were determined as 82.5 ppb for M3G, 2.78 ppb for nMOR, and 0.07 ppb for MOR.
In practice, drugs of abuse are usually determined in urine or blood. To demonstrate the potential of our method for drug analysis, we selected urine as an analyte. Human urine is a complex medium comprising electrolytes, small molecules (urea, aminoacids, hormones, etc.) and up to 1500 different proteins,25 which can make the analysis less effective, as for example, albumin is an important carrier for opioids.26 For the routine analysis we were interested in direct urinalysis, i.e. without the solid phase extraction. A sample of human urine (for the concentration of the urine components see the SI p. S26) was spiked with ternary mixtures of MOR, M3G and nMOR. The concentration of MOR was decreasing from 1 to 0.02 ppm whereas M3G and nMOR were increasing from 8.7 to 44 and 0.56 to 3.2 ppm, respectively. To demonstrate the power of the present method, we selected only one sensor, S1, and performed the analysis. Results of direct urinalysis using only sensor S1 are shown in Figure 9. Here, we were able to develop a general calibration model that allows for determination of morphine and two metabolites from a single fluorescence reading. This is possible because the overall fluorescence intensity in every point corresponds to a unique combination of the three contributors (MOR, M3G and nMOR). The resulting three-way calibration plot (Figure 9) shows fluorescence intensity (FI) plotted on the Y axis, vs. concentrations of each component of the ternary mixtures (MOR, M3G and nMOR) in ppm along the X axis. The fluorescence response to total mixtures concentration suggests the estimation of the concentration of each mixture component using standard curve an excellent linear correlation (R2≥0.990). The concentrations of each component of the mixtures in controls (validation samples) and unknowns can be determined by interpolation of their fluorescence reading on the graph. This experiment confirmed that MOR and its metabolites can be quantified in human urine (LODM3G = 972 ppb, LODMOR = 27.5 ppb, LODnMOR = 71.3 ppb, which is lower than reported for solid phase extraction (SPE)-HPLC).27–31
Figure 9.
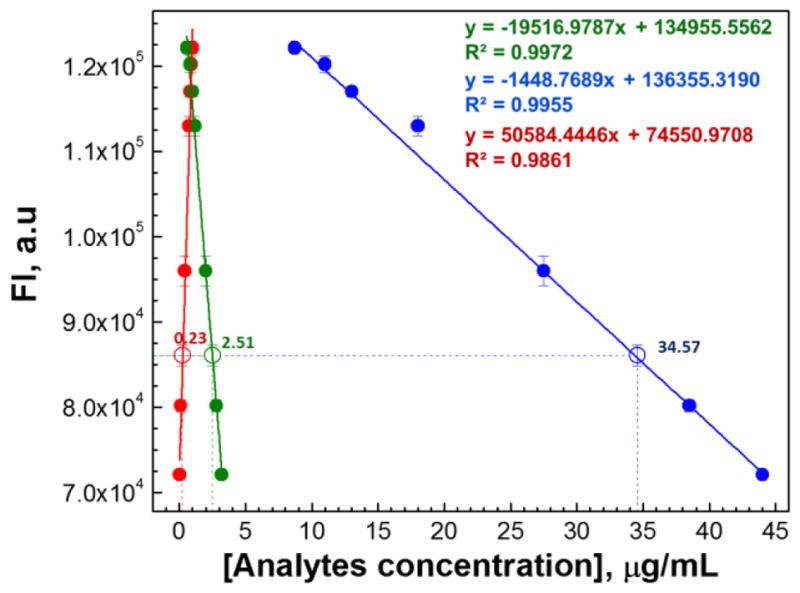
Quantitative three-way linear calibration model derived from HT analysis of human urine for monitoring of morphine metabolism using single fluorescent sensor (S1). Standard curves represent the evolution of the responses from MOR (
 ), M3G (
 ) and nMOR (
 ) reflecting the changes in concentrations of morphine metabolites in ternary mixtures in human urine. Concentrations of each component of unknown sample were predicted with high precision (MOR 0.23 ppm (0.20 ppm actual), M3G 34.57 ppm (35.0 ppm actual), and nMOR 2.51 ppm (2.50 ppm actual).
CONCLUSIONS
We have shown that fluorescent acyclic cucurbiturils (aCBs) with flexible cavity and fluorescent walls are effective hosts for opiates and are capable of acting as chemosensors for opiate drugs such as heroin, morphine and oxycodone as well as their metabolites. As shown in theoretical calculations, the present fluorescent aCBs S1, S2 and S3 differ in the orientation and size of the fluorescence walls. This makes their hydrophobic cavity able to accommodate the guests of varying size, albeit with different affinities. The aCB-drug recognition event is reflected in differential fluorescence response specific to an aCB•guest pair which can be used to sense drugs of abuse and their metabolites. Spectroscopic investigations revealed the sensitivity of the S1, S2 and S3 and confirmed that the magnitudes and type of the response correlates with the magnitude of the affinity constant. This enabled the successful qualitative analysis of heroin, morphine and oxycodone and their main metabolites. We demonstrated that a simple three-sensor array enables the determination of 12 analytes (11+control) with high fidelity and low error. Importantly, quantitative analyses of ternary mixtures of parent drugs and two metabolites were also successful. Finally, drug/metabolite analyses of ternary mixtures in human urine were also performed. Here, a single sensor (S1) was used to generate a three-way calibration model for successful determination of analytes in ternary mixtures (MOR, M3G and nMOR). The sensitivity, and LOD surpasses the current methods that generally also require analyte extraction. We have also demonstrated that the present method is suitable for a high-throughput assay performed in standard 1536-well format utilizing common liquid dispensing and fluorescence reading instrumentation.
Overall, these results show that fluorescent acyclic cucurbituril sensors are supramolecular hosts well suited for the development of high-throughput assays for opiates and their metabolites, and may have potentially high impact in high throughput clinical settings.
Supplementary Material
Acknowledgments
P.A. acknowledges support from Bowling Green State University (Building Strength award 33000211). L.I. thanks the National Institutes of Health (CA168365) for financial support. SG acknowledges the Extreme Science and Engineering Discovery Environment (XSEDE) for computer time. XSEDE is supported by the National Science Foundation grant number ACI-1548562.
Footnotes
Author Contributions
All authors have given approval to the final version of the manuscript.
Notes
The authors declare no competing financial interest.
Fluorescence spectra, experimental detail of microarray, canonical scores plots, complexation energies and results of MD simulation. This material is available free of charge via the Internet at http://pubs.acs.org.
References
- 1.Maisto SA, Galizio M, Connors GJ. Drug Use and Abuse. 7. Cengage Learning; Stamford, CT: 2015. [Google Scholar]; (b) Gahlinger PM. Illegal Drugs: A Complete Guide to their History, Chemistry, Use, and Abuse. Plume Publishers, Penguin Group; New York: 2004. [Google Scholar]
- 2.Srogi K. Anal Lett. 2006;39:231. [Google Scholar]
- 3.Remane D, Wissenbach DK, Peters FT. Clin Biochem. 2016;49:1051. doi: 10.1016/j.clinbiochem.2016.07.010. [DOI] [PubMed] [Google Scholar]
- 4.Baciu T, Botello I, Borrull F, Calull M, Aguilar C. TrAC, Trends Anal Chem. 2015;74:89. [Google Scholar]
- 5.Chalmers JM, Edwards HG, Hargreaves MD. Infrared and Raman Spectroscopy in Forensic Science. 2012:339. [Google Scholar]
- 6.Penido CA, Pacheco MTT, Lednev IK, Silveira L., Jr J Raman Spectr. 2016;47:28. [Google Scholar]
- 7.Burnett AD, Fan W, Upadhya PC, Cunningham JE, Hargreaves MD, Munshi T, Edwards HGM, Linfield EH, Davies AG. The Analyst. 2009;134:1658–1668. doi: 10.1039/b817839a. [DOI] [PubMed] [Google Scholar]
- 8.Dinis-Oliveira RJ. Bioanalysis. 2014;6:2877. doi: 10.4155/bio.14.208. [DOI] [PubMed] [Google Scholar]
- 9.(a) Chantada-Vázquez MP, Sánchez-González J, Peña-Vázquez E, Tabernero MJ, Bermejo AM, Bermejo-Barrera P, Moreda-Piñeiro A. Anal Chem. 2016;88:2734. doi: 10.1021/acs.analchem.5b04250. [DOI] [PubMed] [Google Scholar]; (b) He M, Li Z, Ge Y, Liu Anal Chem. 2016;88:1530. doi: 10.1021/acs.analchem.5b04863. [DOI] [PubMed] [Google Scholar]
- 10.(a) Reviriego F, Rodríguez-Franco MI, Navarro P, Garcia-España E, Liu-González M, Verdejo B, Domènech A. J Am Chem Soc. 2006;128:16458. doi: 10.1021/ja064657h. [DOI] [PubMed] [Google Scholar]; (b) Baumes LA, Buaki Sogo M, Montes-Navajas P, Corma A, García H. Chem - Eur J. 2010;16:4489. doi: 10.1002/chem.200903127. [DOI] [PubMed] [Google Scholar]; (c) Moreno D, Díaz de Greñu B, Garcia B, Ibeas S, Torroba T. Chem Commun. 2012;48:2994. doi: 10.1039/c2cc17823k. [DOI] [PubMed] [Google Scholar]; (d) Masseroni D, Biavardi E, Genovese D, Rampazzo E, Prodi L, Dalcanale E. Chem Commun. 2015;51:12799. doi: 10.1039/c5cc04760a. [DOI] [PubMed] [Google Scholar]
- 11.(a) Minami T, Esipenko NA, Akdeniz A, Zhang B, Isaacs LD, Anzenbacher P., Jr J Am Chem Soc. 2013;135:15238. doi: 10.1021/ja407722a. [DOI] [PubMed] [Google Scholar]; (b) Ganapati S, Grabitz SD, Murkli S, Scheffenbichler F, Rudolph MI, Zavalij PY, Eikermann M, Isaacs L. ChemBioChem. 2017 doi: 10.1002/cbic.201700289. [DOI] [PMC free article] [PubMed] [Google Scholar]
- 12.(a) Ma D, Hettiarachchi G, Nguyen D, Zhang B, Wittenberg JB, Zavalij PY, Briken V, Isaacs L. Nature Chem. 2012;4:503. doi: 10.1038/nchem.1326. [DOI] [PubMed] [Google Scholar]; (b) Lucas D, Minami T, Iannuzzi G, Cao L, Wittenberg JB, Anzenbacher P, Jr, Isaacs L. J Am Chem Soc. 2011;133:17966. doi: 10.1021/ja208229d. [DOI] [PubMed] [Google Scholar]; (c) Minami T, Esipenko NA, Zhang V, Kozelkova ME, Isaacs L, Nishiyabu R, Kubo Y, Anzenbacher P., Jr J Am Chem Soc. 2012;134:20021. doi: 10.1021/ja3102192. [DOI] [PubMed] [Google Scholar]
- 13.Lagona J, Mukhopadhyay P, Chakrabarti S, Isaacs L. Angew Chem Int Ed. 2005;44:4844. doi: 10.1002/anie.200460675. [DOI] [PubMed] [Google Scholar]
- 14.Zhang B, Isaacs L. J Med Chem. 2014;57:9554. doi: 10.1021/jm501276u. [DOI] [PMC free article] [PubMed] [Google Scholar]
- 15.De Gregori S, De Gregori M, Ranzani GN, Allegri M, Minella C, Regazzi M. Metab Brain Dis. 2012;27:1. doi: 10.1007/s11011-011-9274-6. [DOI] [PMC free article] [PubMed] [Google Scholar]
- 16.Smith HS. Mayo Clin Proc. 2009;84:613. doi: 10.1016/S0025-6196(11)60750-7. [DOI] [PMC free article] [PubMed] [Google Scholar]
- 17.Lakowicz JR. Principles of Fluorescence Spectroscopy. 3. Springer; New York: 2006. [Google Scholar]
- 18.(a) Bagheri H, Creaser CA. Anal Chim Acta. 1990;233:303. [Google Scholar]; (b) Augustyniak W. J Photochem. 1980;13:99. [Google Scholar]
- 19.Wang J, Wolf RM, Caldwell JW, Kollman PA, Case DA. J Comput Chem. 2004;25:1157. doi: 10.1002/jcc.20035. [DOI] [PubMed] [Google Scholar]
- 20.Jakalian A, Bush BL, Jack DB, Bayly CI. J Comput Chem. 2000;21:132. doi: 10.1002/jcc.10128. [DOI] [PubMed] [Google Scholar]
- 21.Jorgensen WL, Chandrasekhar J, Madura JD, Impey RW, Klein ML. J Chem Phys. 1983;79:926. [Google Scholar]
- 22.Wang X, Nau WM. J Am Chem Soc. 2004;126:808. doi: 10.1021/ja038263r. [DOI] [PubMed] [Google Scholar]
- 23.Gandhi S, Sharma P, Capalash N, Verma RS, Raman Suri C. Anal Bioanal Chem. 2008;392:215–222. doi: 10.1007/s00216-008-2256-9. [DOI] [PubMed] [Google Scholar]
- 24.Brereton RG. Applied Chemometrics for Scientists. Wiley; Chichester: 2007. [Google Scholar]
- 25.Adachi J, Kumar C, Zhang Y, Olsen JV, Mann M. Genome Biol. 2006;7:R80. doi: 10.1186/gb-2006-7-9-r80. [DOI] [PMC free article] [PubMed] [Google Scholar]
- 26.Olsen GD. Clin Pharmacol Ther. 1975;17:31. doi: 10.1002/cpt197517131. [DOI] [PubMed] [Google Scholar]
- 27.Rook EJ, van Ree JM, van den Brink W, Hillebrand MJX, Huitema ADR, Hendriks VM, Beijnen JH. Basic Clin Pharmacol Toxicol. 2006;98:86. doi: 10.1111/j.1742-7843.2006.pto_233.x. [DOI] [PubMed] [Google Scholar]
- 28.Rook EJ, Huitema ADR, van den Brink W, van Ree JM, Beijnen JH. Curr Clin Pharmacol. 2006;1:109. doi: 10.2174/157488406775268219. [DOI] [PubMed] [Google Scholar]
- 29.Yuan C, Heideloff C, Kozak M, Wang S. Clin Chem Lab Med. 2012;50:95. doi: 10.1515/CCLM.2011.739. [DOI] [PubMed] [Google Scholar]
- 30.Lee YJ, Suh SY, Song J, Lee SS, Seo AR, Ahn HY, Lee MA, Kim CM, Klepstad P. BMC Palliat Care. 2015;14:53. doi: 10.1186/s12904-015-0052-9. [DOI] [PMC free article] [PubMed] [Google Scholar]
- 31.Moriya F, Chan KM, Hashimoto Y. Leg Med. 1999;1:140. doi: 10.1016/s1344-6223(99)80026-1. [DOI] [PubMed] [Google Scholar]
Associated Data
This section collects any data citations, data availability statements, or supplementary materials included in this article.


