

Abstract
We recently described a new class of long noncoding RNA defined by especially tight chromatin association, whose presence is strongly correlated with expression of nearby genes in HEK293 cells. Here we critically examine the generality and cis-enhancer mechanism of this class of chromatin enriched RNA (cheRNA). CheRNA are largely cell-type specific, and remain the most effective chromatin signature for predicting cis-gene transcription in all cell types examined. Targeted depletion of three cheRNAs decreases gene expression of their neighbors, indicating potential co-activator function. Single-molecule FISH of one cheRNA-distal target gene pair suggests spatial overlap consistent with a role in chromosome looping. In another example, the cheRNA HIDALGO stimulates the fetal hemoglobin HBG1 gene during erythroid differentiation by promoting contacts to a downstream enhancer. Our results suggest that many cheRNAs activate proximal, lineage-specific gene transcription.
Noncoding RNA can promote transcriptional initiation of coding genes by recruiting histone modifying complexes1–4, stabilizing transcription factor or mediator binding2,5–7, and increasing the strength of promoter-enhancer looping2,5,8–10. In light of the recently appreciated promiscuity of lncRNA-protein interfaces11, how lncRNA interactions can achieve any of their implicated roles with such limited specificity has become a central question. One possible resolution to this conundrum could be immobilization and action of certain lncRNA at the sites of their production, as has previously been observed in a small number of cases5,8–10,12,13. Consistent with this being a more widespread phenomenon, we reported cheRNA, a new class of several thousand lncRNAs in HEK293 cells defined by high chromatin-enrichment as a consequence of their ongoing transcription. Although cheRNA are molecularly distinct from canonical enhancer RNA (eRNA), they exhibited a strong correlation to proximal gene expression14. Further supporting the idea that biochemical enrichment of chromatin RNA is a powerful approach to identify functional molecules that act locally, a subset of eRNA that activate nearby genes in response to epidermal growth factor are more prominent in the chromatin fraction10. Yet many important questions remain regarding cheRNAs and their relationship to nearby genes: How general are cheRNAs in terms of their properties and functional correlations? To what extent are they shared between different cell types versus tissue-restricted in their expression? Do cheRNA molecules promote neighboring gene transcription, or are they inert by-products of enhancer transcriptional activity (both cases have been observed for other noncoding RNA classes5,8–10,15–18)? Finally, how might these regulatory modules have evolved?
To begin to address these questions, we undertook a more comprehensive examination of cheRNAs in other cellular contexts and explored the functional consequences of their perturbation. By quantitative chromatin-enrichment of nuclear RNA from three distinct cell types, we find that the great majority of cheRNAs are cell-type specific. Yet in each cell type, we find that proximity to a cheRNA is a more effective predictor of cis-gene expression than putative enhancers derived from chromatin signatures, previously annotated long noncoding RNA or eRNA. Our prior work established that most cheRNAs remain attached to chromatin through the intermediacy of RNAP II14. We now directly measure the spatial distribution of one cheRNA relative to its site of transcription and putative target gene, and find them to be remarkably co-localized despite >50 kb spacing along the chromosomal coordinate. In functional tests by targeted depletion of several candidate cheRNAs, we observe significant decreases in neighboring gene expression for 75% of the loci examined, establishing cheRNAs as transcriptional activators. In a further in-depth example, we find the cheRNA molecule HIDALGO is required for full stimulation of Hemoglobin subunit Gamma 1 (HBG1) during erythroid differentiation, and disruption of HIDALGO reduces contacts between the HBG1 promoter with a downstream enhancer. Finally, virtually all cheRNAs reside within class I transposable elements, providing a plausible evolutionary path for this form of regulation.
RESULTS
Chromatin enriched noncoding RNAs are lineage-specific and correlated with proximal gene transcription
To discover chromatin-enriched RNAs in additional cell lines, we performed biochemical fractionation of nuclei from human embryonic stem cells (H1 ESC) and myeloid leukemia cells (K562) coupled to calibrated RNA-seq14,19,20. These two are the most divergent tier 1 ENCODE cell types, and have a good deal of extant chromatin and RNA characterization data available21. By sub-nuclear compartment quantification of de novo assembled transcripts (Supplementary Fig. 1a–c), we observe 3,293 and 1,136 cheRNA in K562 cells and H1 hESCs, respectively (Fig. 1a, Supplementary Fig. 2a,b, Bioinformatics Supplementary Note). This recapitulation of our prior HEK293 results14 in other cell types demonstrates the generality of cheRNAs across diverse cell lineages, and provides a resource for future exploration of lncRNA mechanisms operating at the chromatin interface (Source Data for Fig 1). While previously annotated lncRNAs and eRNAs also exhibit modest chromatin enrichment, consistent with many of their associated functions1,2,5–10,22, they are less enriched than cheRNAs (Fig. 1b).
Figure 1.
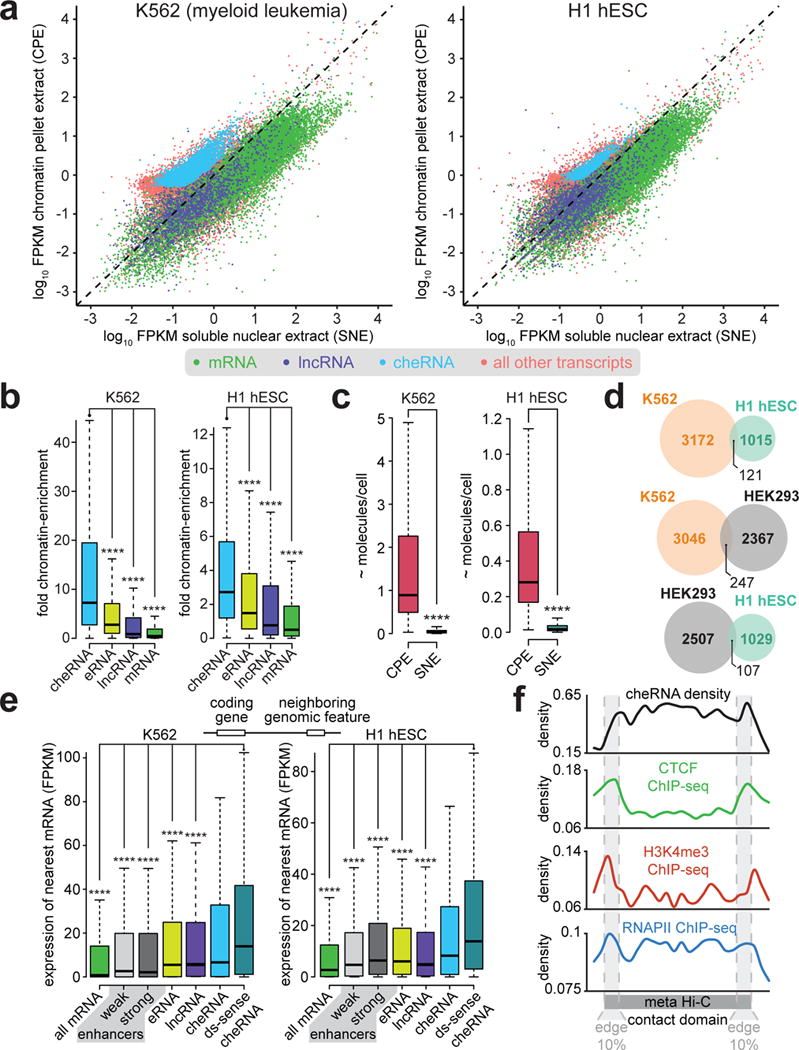
The generality, tissue-specificity and cis-gene activity correlation of cheRNAs. a, Scatterplot of de novo assembled transcripts after forcing nuclear fractionation coupled to RNA-seq14 depicts chromatin pellet (CP) versus soluble nuclear extract (SN) enrichment for K562 and H1 hESCs cells (Gencode annotation of mRNA and lncRNA59, with new cheRNA species in cyan, and all remaining transcripts in orange). b, Fold chromatin enrichment (CP FPKM/SN FPKM) for the indicated RNA classes. Boxes span the lower to upper quartile boundaries, median is indicated with black line, p-values are calculated by Mann-Whitney U test, **** p < 2×10−16.c, CheRNA molecules per fraction, determined by calibration with spiked-in in vitro transcribed standards (Supplementary Fig. 1). d, Overlap of cheRNAs from K562, H1, and the prior HEK29314 datasets demonstrate they are largely unique to each cell line. e, K562 and H1 expression of nearest genes to indicated genomic features: all mRNA, weak and strong enhancers as annotated by chromatin signatures26, expressed lncRNA60, expressed eRNA loci29, cheRNA loci, and cheRNA downstream and in the same sense as their neighbor (ds-sense cheRNA). More extensive comparisons are available in (Supplementary Fig. 2c), p-values calculated by Mann-Whitney U test, **** p < 2×10⁻¹⁶. f, Average density of cheRNA versus CTCF, RNAPII and H3K4me3 ChIP-seq21, contoured over a ‘meta’ Hi-C contact domain comprising of all TADs33 that contain cheRNAs in K562 cells, with edge deciles indicated (see methods).
Calibrated RNA-seq also provides a rough measure of the copy number per nucleus and the distribution between sub-nuclear compartments. We measured 120 ± 40 copies of XIST RNA in chromatin, as compared to 2.5 ± 0.4 copies in the soluble nuclear extract per human K562 cell, congruent with previous estimates of murine Xist (~50–200 per cell)23. Due to incomplete recovery during nuclear fractionation, we estimate most cheRNAs are present at ~1–10 copies/cell (Fig. 1c), consistent with single molecule fluorescent in situ hybridization (smFISH) measurements for other lncRNA in a variety of cell types1,24.
A comparison between cheRNA species isolated from our previous HEK293 data set with K562 and H1 hESCs reveals the majority of cheRNAs display cell type-specific expression (Fig. 1d), are largely unique from other annotated ncRNA species in each cell type, and display little coding potential (Supplementary Fig. 2a–b). This strongly restricted expression is in contrast to the related ncRNA-a class of cis-activating lncRNAs, wherein the majority of those reported are thought to be shared between three disparate cell types25.
Analogous to HEK293s14, in K562 and H1 hESCs, the presence of a proximal cheRNA is highly-correlated to nearby gene expression–significantly more coupled to cis-gene expression than neighboring enhancers annotated by chromatin signatures26–28 or transcriptionally active eRNA loci29 (Fig. 1e, Supplementary Fig. 2c). This correlation is even more pronounced for cheRNAs that are downstream and in the same sense as their coding neighbor. In some cases cheRNA biogenesis may be linked to their upstream coding gene30, or distinct as defined by a 5’-cap (Supplementary Fig. 2d) and canonical promoter chromatin hallmarks14. CheRNA-proximal coding genes also appear to be specifically expressed in their respective cell types, such as the ERK1/2 cascade in H1 hESCs31 and JAK-STAT signaling in K56232 (Supplementary Fig. 2e), hinting at a role for cheRNAs in cell type specific gene expression rather than basal function.
To investigate where cheRNAs reside in the 3-dimensional architecture of the genome, we analyzed cheRNA positions relative to annotated topologically associating domains (TADs) in K562 cells33. CheRNA density displays local peaks at TAD boundaries (Fig. 1f), congruent with a recent model suggesting that noncoding RNA transcription can serve as focal points for chromosome domain contacts17. Furthermore, the cheRNA correlation to proximal gene expression applies to all genes within a given TAD (Supplementary Fig. 2c).
Single molecule RNA-FISH indicates that a cheRNA can act locally near its site of production
Although the bulk of cheRNA are tightly chromatin associated through the act of ongoing or stalled RNAPII transcription14, our prior measurements did not provide spatial information about the site of attachment. We sought to quantify the physical proximity of a cheRNA molecule relative to its site of production and presumptive neighboring gene target by single molecule RNA fluorescence in situ hybridization (smFISH). The PVT1 gene, which frequently co-occurs in tandem with MYC amplification tumors in patients34, encodes a highly chromatin-enriched noncoding RNA in HEK293 and K562 cells, meriting cheRNA classification (Fig. 2a,c). There are multiple enhancers of MYC transcription resident within PVT1 (e1–4)35, each of which produce chromatin-enriched RNA (Fig. 2c). Curiously, the latter two enhancers reside in a region in PVT1 that is resistant to inhibition by RNAPII elongation inhibitor DRB (Fig. 2b,c).
Figure 2.
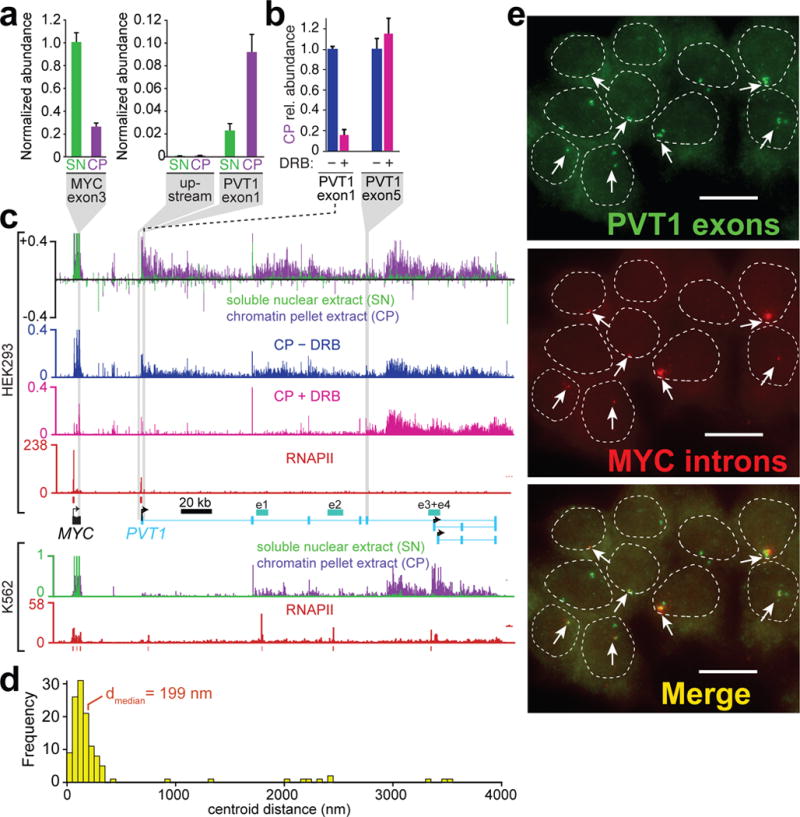
The cheRNA PVT1 bridges the site of its production to its target gene MYC. a, Abundance of MYC and PVT1 transcripts in the soluble nuclear extract (SN) and chromatin pellet extract (CP) measured by RT-qPCR, normalized to 18S rRNA. Also included is a region upstream of PVT1 to demonstrate that this RNA is not derived from inefficient MYC transcriptional termination. b, Relative abundance of PVT1 exons 1 and 5 in the chromatin pellet (CP) with transcriptional inhibition by DRB (100 μM) for 2 hours, normalized to the untreated conditions. c, RNA-seq of chromatin pellet fraction (CP, purple), soluble nuclear fraction (SN, green) from HEK293 cells (top) and K562 (bottom) at the MYC-PVT1 locus. RNA-seq of the chromatin pellet ± DRB (blue, pink) from HEK293 cells, and RNAPII ChIP-seq (red)21 from each cell line are depicted with called peaks (red bars), and enhancers of MYC determined by a CRISPRi tiling screen (cyan, e1–4)35. RNA Single-Molecule Fluorescence In Situ Hybridization (smFISH) of PVT1 and MYC introns. d, Frequency of overlap in nuclei exhibiting fluorescent puncta in both channels was quantified by measuring centroid distance differences of nearest neighbors, plotted as a histogram. e, Representative field of HEK293 cells from a compressed Z-stack in smFISH experiment with nuclei from DIC outlined (white dash) and MYC intron foci indicated with white arrows, scale bar represents 15 μm. In total, 50 cells were examined from 8 images.
We simultaneously targeted MYC introns and PVT1 exons with specific probes in two-color smFISH (Supplementary Table 1), to query the location of all PVT1 forms as compared to the nascent pool of MYC transcripts still resident at the MYC locus (Fig. 2d–e)19. We observe that PVT1 exon staining is largely resident in the nucleus, distributed into only a few discrete puncta per cell (mean = 1.6 ± 0.4, Fig 2e). Similarly MYC intronic RNA, indicative of local transcription at the MYC locus, is restricted to approximately one nucleus-resident body per cell, yet many cells did not display any focal staining. Analysis of nuclei that contain at least one of each color focus, demonstrates that PVT1 RNA is strikingly co-localized with ongoing transcription from the MYC gene (Fig. 2d,e), predominantly overlapping within the optical diffraction limit for these dyes. Specifically, the median distance between the nearest PVT1 and MYC foci for a given nucleus, 199 nm, is far closer than the minimum spacing between the sites of RNA biogenesis in extended conformation (the distance range from a notional 30 nm to 10 nm fiber would be ~420–7700 nm for 55 kb)36. Our results provide new and orthogonal single-cell evidence that the PVT1 enhancers are in close proximity to the MYC locus, consistent with physical contact observed by RNAPII ChIA-PET37, while arguing that the PVT1 cheRNA stays largely resident at the site of its production.
Functional tests of the role of cheRNA transcription on neighboring gene expression
Due to the high correlation of active gene expression neighboring cheRNA loci, and other examples of noncoding RNA acting in cis1,2,5,8–10,25, we sought to test whether cheRNAs play a causal role in promoting local gene expression. We used CRISPRi38 in K562 cells to inhibit transcription of two cheRNAs located 67kb and 71kb downstream of their nearest coding genes B3GNT2 and PDCD6IP, and one 19kb upstream of its nearest neighbor IL6. These pairs were chosen from the most highly expressed cheRNAs in K562 cells. Consistent with our metagene analysis (Fig. 1f), each of these cheRNA-gene pairs fell on the edge of a chromosome contact domain33, although they were not selected for study on this basis (Supplementary Fig. 3d–f). Several guide RNAs (sgRNAs) targeting the promoter of each cheRNA (Supplementary Table 1) reduced cheRNA levels by 60–95%, which led to proportional expression decrements from their most proximal gene in two out of three cases (p < 0.05, t-test, Fig. 3). Despite effective targeting of PAINE, none of the sgRNAs employed produced significant changes in PDCD6IP expression, arguing that not all cheRNAs are likely to be functional on their nearest-neighbor gene.
Figure 3.

Examination of several cheRNA-gene pairs for cis-enhancer activity. a-c, Density of RNA-seq reads from K562 soluble-nuclear (green) and chromatin pellet (purple) extract contoured over the indicated chromosomal region of origin, encompassing a cheRNA (cyan) and nearby gene (red) pair. d-f, RT-qPCR for the cheRNA and its neighboring gene corresponding to panels a-c, after CRISPRi knockdowns targeting each cheRNA. Up to three distinct sgRNAs were designed for each cheRNA locus at the indicated positions. Fold difference values represent mean 2ΔΔCt relative to a non-targeting negative control sgRNA38 (“–”), with normalization to the PPIB reference gene and adjustment for primer-specific amplification factors; error bars correspond to S.E.M. from 3–4 independent targeting or 6–7 independent negative control experiments (or for 3f sgRNAs 5–6, 1 targeting and 2 negative control independent experiments, see Online Methods), where for targeting samples this S.E.M. includes the propagated uncertainty of the mean negative control expression level used for scaling expression levels relative to negative control samples; * p < 0.05, ** p < 0.005, *** p << 0.001 relative to negative control (Welch’s two-tailed t-test).
We conclude that the CRISPRi effects are on-target, as distinct sgRNAs display similar perturbations, sgRNAs targeting sites between B3GNT2 and its neighboring cheRNA BONIFACIO did not significantly effect B3GNT2 expression, and no consistent perturbations were observed for the housekeeping gene GAPDH (Supplementary Fig. 3a). Moreover, the same sgRNAs transfected in HEK293 CRISPRi cells, which more modestly express PDCD6IP and B3GNT2 but not the corresponding cheRNAs, did not lead to knockdown of these genes (Supplementary Fig. 3b,c). Collectively, these data indicate that cheRNA loci can act as transcriptional activators in cis, although they do not distinguish whether the act of transcription or the cheRNA molecule itself is responsible for the effect. We sought to explore this important distinction in the context of a developmentally induced gene-cheRNA pair in the next section.
The cheRNA HIDALGO couples an enhancer to the promoter of HBG1, activating HBG1 transcription
To determine if cheRNAs play a role in differentiation, we induced K562 cells toward the erythroid lineage with the small molecule hemin for 48 hours39, and repeated nuclear fractionation and sequencing. Unlike comparisons between distinct cell lines, the majority (75%) of cheRNA were shared with un-induced K562 cells (Supplementary Fig. 4a). Of the 172 significantly up-regulated coding genes, 27 were flanked by a cheRNA within 100 kb– a slight overrepresentation over chance expectation (p < 0.02, Fisher’s exact test, two-tailed).
We analyzed an erythroid cheRNA-gene pair to better understand cheRNA biogenesis and putative enhancer mechanisms in differentiation. One of the hallmarks of definitive erythroid commitment is the up-regulation of two chains of fetal hemoglobin (γ-globin) encoded by HBG1 and HBG2, for which hemin-induction of K562 cells is an effective model system39. We observed chromatin-enriched transcription extending 3.7kb beyond HBG1 in both un-induced and induced states in a region previously identified to provide enhancer activity in reporter assays40,41(Fig. 4a), whereas there is no transcription at this locus in H1 cells (Supplementary Fig. 4b). ChIP-seq data21 in this region reveals chromatin features of an unannotated promoter just downstream of HBG1, with a cryptic TATA box and notable peaks of transcription factor binding sites (TFBS), H3K4me3, H3K27ac, RNAPII, DNaseI hypersensitivity and a CAGE peak (Fig. 4b). Intriguingly, transcription of this cheRNA, hereafter called HIDALGO for “hemin-induced cheRNA downstream of fetal hemoglobin,” is induced early in erythroid differentiation, peaking within 2–4 hours after addition of hemin, then returning to basal levels within two days (Fig. 4c).
Figure 4.
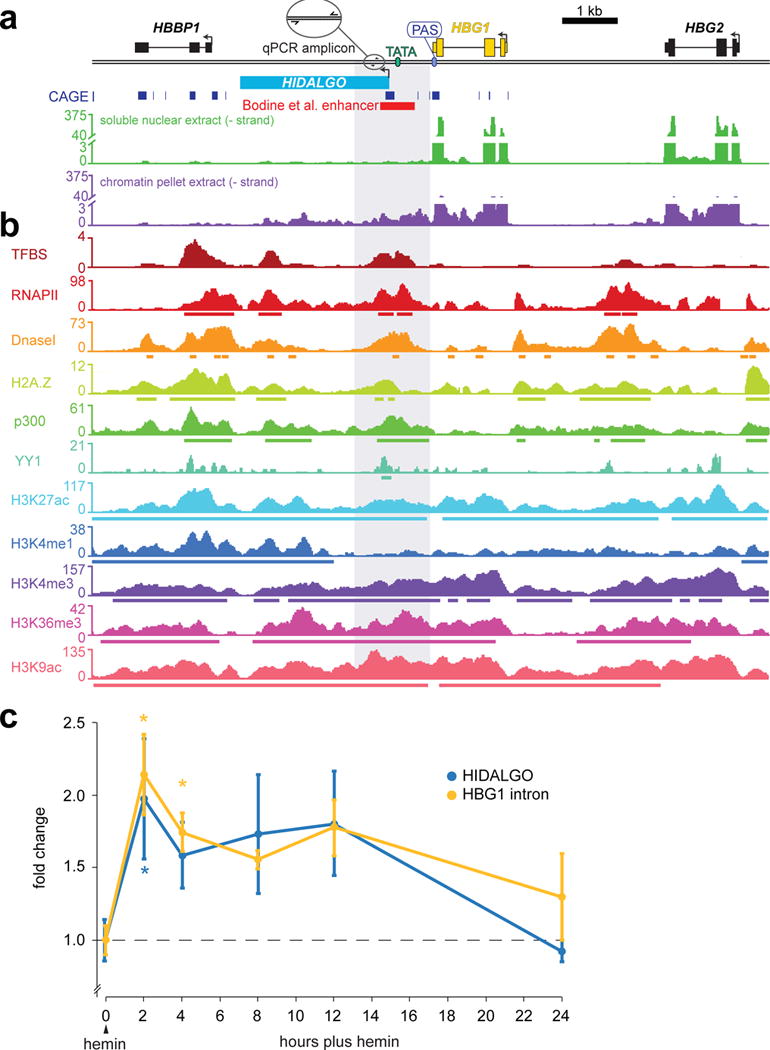
Hemin-induced cheRNA downstream of fetal hemoglobin (HIDALGO), exhibits molecular hallmarks of a promoter and is induced with fetal-hemoglobin (HBG1) in erythrogenesis. a, RNA-seq of K562 chromatin (purple) and soluble-nuclear extract (green) contoured over the HBG1 locus and flanking regions, CAGE peaks63 arising from 5’-capped transcripts are indicted, and a previously identified enhancer element40,41. b, Chromatin signatures from ChIP-seq and DNAase I hypersensitivity measurements in K56221 indicate a regulatory region downstream of HBG1 where HIDALGO, a novel cheRNA, is transcribed (called peaks are depicted as colored bars beneath the coverage track). c, A time course measuring the levels of fetal hemoglobin RNA (HBG1) with intron-specific primers and HIDALGO cheRNA by RT-qPCR after the addition of 50 μM hemin to induce erythroid differentiation. Y-axis represents mean fold change (2ΔΔCt) by RT-qPCR relative to time t = 0 and 18S rRNA. For t > 0, error bars correspond to S.E.M from 3–4 independent experiments and include the propagated uncertainty in the t = 0 value used for fold change calculations; for t = 0, error bars correspond to S.E.M. from qPCR technical replicates, summed in quadrature across all independent experiments (* p < 0.05 vs. t = 0, Welch’s two-tailed t-test).
We examined the biogenesis of HIDALGO RNA with 5’ RACE, which revealed a complex set of transcripts emanating both from the TSS of HBG1, and a location downstream near our predicted HIDALGO TSS (Fig. 5a). While one transcript that originates from the HBG1 TSS represents read-through of HBG1 premature RNA that escapes polyadenylation (#2), two others are isoforms that are out of frame and riddled with stop-codons, seemingly due to errant or alternative splicing (Fig. 5a, Supplementary Fig. 4c). By virtue of incomplete processing and chromatin tethering, all of these transcripts are de facto cheRNAs, and we refer to them as HIDALGO isoforms herein. To assess the proportion of HBG1 TSS transcripts that escape polyadenylation we performed 3’ RACE on HBG1, which revealed that >83% of transcripts are processed at the normal polyadenylation site (PAS) to become mature mRNA (Supplementary Fig. 4d). Read-through from the HBG1 promoter, particularly isoforms #1–2, compose the majority (90–95%) of HIDALGO transcripts at basal levels (Supplementary Fig. 4e,f). Hemin induces all four RACE transcripts, although the transcript emanating from the cryptic TATA box (#4) represents the greatest-fold change, ranging from negligible levels to comprise ~15% of HIDALGO RNA at two-hours post-induction (Supplementary Fig. 4e,f).
Figure 5.
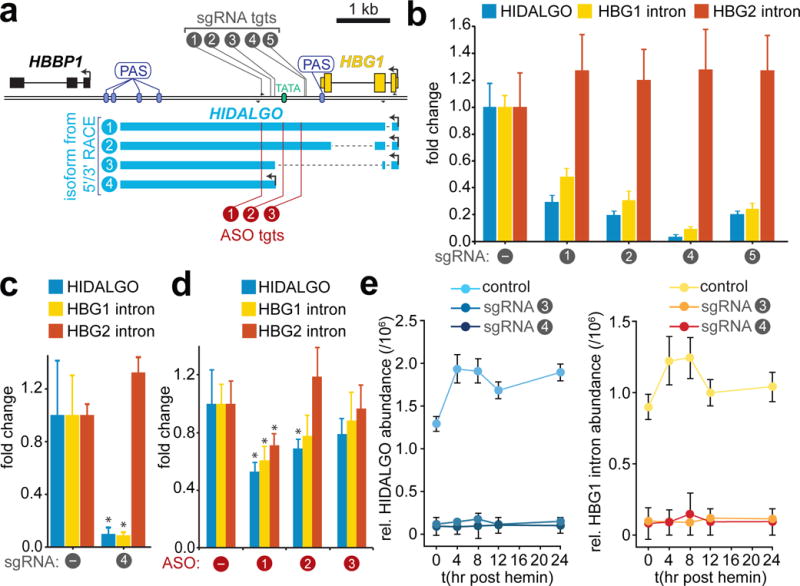
The cheRNA HIDALGO promotes HBG1 expression. a, Diagram of HIDALGO 5´ and 3´ RACE products and location of CRISPRi sgRNAs and antisense oligonucleotide (ASO) target sites used. b, Knockdown of HIDALGO by CRISPRi with four distinct gRNAs decreases HBG1 transcription proportionally. Fold change is measured relative to a non-targeting negative control sgRNA (“-” sgRNA) and to 18S RNA by RT-qPCR (n = 1). Mean 2ΔΔCt and error bars (S.D.) are from 3–4 qPCR technical replicates. c, Independent biological replicate CRISPRi with sgRNA4 and S.E.M. error bars (n = 3, *p<0.05, Welch’s t-test). d, Knockdown of HIDALGO RNA with three different ASOs causes a decrease in HBG1 expression, Error bars represent S.E.M. (n = 4, *p<0.05, Welch’s t-test). ASO #1 also has a 15–16 bp match to a similar region downstream of HBG2, and also decreased HBG2 expression. e, Time course of HIDALGO and HBG1 induction upon erythrogenesis in dCas9-Krab K562 cells or polyclonal stable integrants of sgRNA3 or sgRNA4 in this background (n = 1, each). Y-axis represents mean expression relative to 18S rRNA measured by RT-qPCR, Error bars represent S.D. from 4 qPCR technical replicates.
We used CRISPRi to inhibit read-through transcription from the HBG1 gene and initiation from the downstream TATA box (Fig. 5a). As both fetal hemoglobin genes are only 3.5 kb apart on chromosome 11 and are > 99% identical at the mature RNA level, HBG2 transcripts serve as an excellent control for readout of HBG1-specific effects. To this end, we have deployed primer sets that target unique intronic or 3’UTR sequences to distinguish these RNA species (Supplementary Fig. 5b,f and Supplementary Fig. 6). Each of the sgRNAs employed led to a decrease in transcription of HBG1, but not HBG2, proportional to the level of cheRNA knockdown (Fig. 5b–c, Supplementary Fig. 4g). As a control, we confirmed that a gene without a nearby cheRNA could be not be suppressed by CRISPRi the same distance downstream as sgRNA4 is from HBG1 (Supplementary Fig. 5a). Moreover, 3’ RACE of HBG1 demonstrates that the majority of transcripts are processed immediately following the PAS (Supplementary Fig. 4d), so any possible effect is restricted to the fewer than 17% of transcripts that escape 3’ processing, and could not account for the 88% decrease in HBG1 observed (Fig. 5b,c).
While our CRISPRi experiments demonstrate the HIDALGO locus is a functional activator of HBG1, they do not distinguish between the act of transcription through HIDALGO or the RNA molecule itself playing a role17,18. To test the latter mechanism, we used antisense oligonucleotides (ASOs), which specifically degrade complementary RNA through nuclear RNaseH-initiated cleavage42. With modest ASO-mediated HIDALGO depletion, we observed decreases in HBG1 transcription commensurate to the degree of HIDALGO knockdown. ASO-1 yielded a significant effect on both HIDALGO and HBG1 (p < 0.05, t-test), demonstrating that the RNA molecule plays a functional cis-regulatory role (Fig. 5d). Finally, inhibiting HIDALGO during erythroid differentiation with Hemin prevents induction of HBG1 (Fig. 5e), suggesting a role for this cheRNA in developmental transcriptional plasticity.
As several lncRNA and eRNA have been shown to play are role in chromatin looping that facilitates contact between promoter and enhancer DNA elements2,5,8–10, we sought to test whether a similar model is operant at the HIDALGO-HBG1 locus. Chromatin confirmation capture (3C)43 demonstrates that the promoter of HBG1 forms contacts with HBG1 exon 2 and the HIDALGO #4 TSS, both of which are diminished by ASO (Fig. 6a) or CRISPRi depletion of HIDALGO (Supplementary Fig. 5c). Although each of these perturbations to HIDALGO acts by distinct mechanisms, as reflected by distinct changes in the histone modification patterns (Fig. 6b), the consequences for contact frequency are similar. CRISPRi targeting of promoters is thought to act by recruiting the Set1DB methyltransferase to install the H3K9me3 mark44. Remarkably, our ICeChIP quantification45 demonstrates H3K9me3 approaches saturation (100%) proximal to the site of dCAS9-KRAB-sgRNA3 binding near the TSS of HIDALGO #4, with concomitant slight increases at the HBG1 promoter. In contrast, antisense oligonucleotide targeting of the HIDALGO molecule does not substantially alter the pattern of H3K4me3 and H3K9me3 at the two sites queried. Yet there is a slight increase in H3K27me3 at the HBG1 promoter, perhaps indicating spreading of this mark46 due to altered chromatin looping. Crucially, the TSS of HIDALGO #4 close to the 3C contact is a potent transcriptional activator in luciferase assays, consistent with it serving an enhancer role in this system modulated by the HIDALGO cheRNA and with prior findings of enhancer elements in this region40,41 (Fig. 6c). Taken together, our results indicate that the HIDALGO RNA molecule confers cis-activation of HBG1 seemingly by mediating a contact with this downstream enhancer element (Fig. 6d), and this mechanism is important for HBG1 induction during the early stages of erythroid differentiation.
Figure 6.
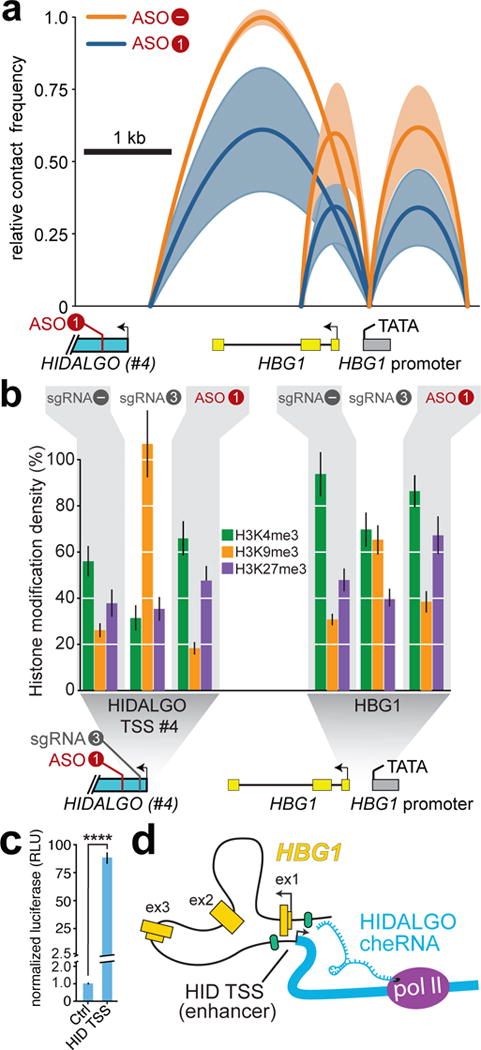
The cheRNA HIDALGO couples an enhancer at its TSS to the promoter of HBG1. a, Chromatin confirmation capture (3C) in ASO-transfected K562 cells after sorting reveals a HIDALGO-sensitive contact between the HBG1 promoter and a region near the HIDALGO transcript #4 TSS (n = 4, see Online Methods). Line arcs depict average relative contact frequency of the two vertices, with S.D. indicated in lighter color. The analogous experiment using CRISPRi can be found in Supplementary Fig. 5c. b, ICeChIP-qPCR quantification of the amounts of the three indicated histone lysine methyl-marks at the HIDALGO TSS #4 and HBG promoter, comparing sgRNA3 and ASO1 mediated HIDALGO perturbations to control (“–” sgRNA). For simplicity, ASO “–” control is omitted, but can be found in Supplementary Fig. 5e. Error bars represent S.E.M. from 3–4 qPCR technical replicates (n = 1 independent experiment for each ICeChIP). c, Enhancer assay by relative luciferase activity of the HIDALGO TSS#4 (HID TSS) in K562 cells. HID TSS firefly luciferase activity normalized to co-transfected Renilla luciferase vector. Luciferase (n = 5 independent experiments, error bars represent S.E.M., **** p < 10−4, Welch’s t-test). d, Model of HIDALGO activation of HBG1 by bridging between the enhancer (HID TSS) to the promoter of HBG1.
DISCUSSION
CheRNAs are operationally defined by statistically significant enrichment in chromatin after biochemical fraction of nuclei. We find that cheRNAs are largely unique to each of the queried human cell types, and their correlation with cis-gene expression is higher than all other metrics of enhancer annotation. The genes that cheRNAs abut are also largely tissue-restricted, arguing for roles in linage differentiation or maintenance. Beyond this correlation, we have also demonstrated a functional role for several cheRNAs in promoting proximal gene expression.
Notwithstanding modest overlap between cheRNA, eRNA and lncRNA (Supplementary Fig. 2a), our approach may also capture the cis-acting subpopulations of these other two classes of molecules. Many lines of evidence are converging on the concept of cis-regulatory element transcription playing an important role in enhancer activity5,9,10,14,47–50. Whether apparent ncRNA distinctions such as length and bi-directional transcription are arbitrary classifications or functionally consequential remain a crucial question for the field. Given the stronger correlation to cis-gene transcription of molecules biochemically isolated from chromatin10,14 and data presented herein, functional classification based on chromatin enrichment may prove the most effective metric of chromatin-based function and could be a powerful adjunct to other chromatin signatures26–28 in de novo enhancer prediction.
Chromatin looping from cheRNAs to tether enhancers to target promoters
The high correlation of gene activation with downstream-sense cheRNAs suggests a general model where pioneering rounds of transcription that bypass normal termination serve to potentiate transcription of a downstream enhancer. The cheRNA product could facilitate looping from the now active enhancer to the gene promoter (Fig. 6d), setting up a feed-forward loop for stable expression analogous to gene-loops described in yeast51. Including prior experiments with PVT135 knockdown of three out of four cheRNAs in the downstream-sense orientation using CRISPRi led to a decrease in expression of their upstream neighbors. However, activation of IL6 transcription by the upstream divergent ILYICH cheRNA indicates this orientation is not an absolute requirement. Our more detailed analysis of the HBG1-HIDALGO locus supports the model of pioneering read-through transcription of the coding gene to potentiate downstream enhancer transcription. The granular kinetics of transcriptional activation through the HBG1-HIDALGO locus upon erythroid differentiation, where both transcripts increase seemingly in lockstep is consistent with this model. In particular, ASO depletion of the cheRNA HIDALGO, some of which represents read-through transcripts from the upstream HBG1 promoter, led to a decrease of HBG1 transcripts far greater than can be accounted for by depletion of only the read-through pool. By targeting the cheRNA molecule for cleavage without altering its transcription or changing the underlying DNA sequence, we demonstrate that, at least in this scenario, the RNA molecule itself is also important in promoting cis-enhancer activity. Knockdown of HIDALGO by ASO and CRISPRi both led to decreased chromatin contacts between the enhancer40,41 at the TSS of one of the HIDALGO isoforms with the promoter of HBG1, supporting a role for the RNA in bridging the 3’ enhancer with the promoter to facilitate successive rounds of transcription.
The most analogous paradigm to HIDALGO-HBG1 in the literature are several oestrogen inducible eRNA molecules tethered near a distal enhancer that promote transcriptional activation of target genes9. Like HIDALGO, locus architecture changes occur in response to both small molecule activation and depletion of eRNA using ASOs. Looping is an implied function of several lncRNA-coding gene mechanistic paradigms as well, yet direct evidence of the transcript acting in cis has remained elusive. The class of molecules termed “ncRNA-a” play important roles in chromatin looping through mediator and integrator5,10, however we observed no requirement for these factors or several others in HIDALGO function (Supplementary Fig. 7). Moreover the susceptibility of neighboring transcriptional effects of ncRNA-a and related lncRNA to RNAi1,5,6,10,25 suggests that they may operate in trans42,52, consistent with intermediate levels of chromatin enrichment compared to cheRNAs. Rather than altering the local chromatin loop structure, other lncRNAs act to promote neighboring gene transcription by recruiting methyltransferase complexes to install the transcriptionally activating histone modification H3K4me31. Yet in the case of the transcriptional and architectural perturbations of HIDALGO by ASOs, the HBG1 promoter levels of H3K4me3 do not appreciably change (Fig. 6b), arguing similar mechanisms are not operant.
Our data is consonant with the promoters of lncRNA potentially acting as enhancer elements, as observed with recent elegant allele-specific engineering of 5 lncRNA loci that act in cis to enhance proximal gene expression13. However, unlike the HIDALGO-HBG1 gene pair, the mechanisms described are all seemingly independent of the RNA molecule itself. We infer putative cis activity of cheRNA from the consilience of a number of independent observations: they are predominantly attached to chromatin by the act of their ongoing transcription14, we observe one cheRNA still linked to its site of production (Fig. 2), perturbations of cheRNA transcription often negatively impact neighboring gene transcription (Fig. 3, 5), and in the one example closely examined, chromatin contact architecture coupling an enhancer to the target gene’s promoter is perturbed when the HIDALGO RNA molecule is cleaved. Yet conclusive proof of cis-activity of HIDALGO and other cheRNAs await analogous allele-specific engineering and readout. Future investigations will also be needed to more concretely define individual mechanisms by which cheRNAs promote neighboring gene activation, as well as explore potential repressive functions for those proximal to silent genes, akin to other lncRNAs4,52–54.
Despite average correlation to gene activation, cheRNAs are also likely not uniform in their function and mechanism. One of the cheRNAs examined, PAINE, does not significantly affect its closest neighbor’s transcription. With present data, we cannot definitively rule out a role in activating a more distal locus, or the possibility that it plays no transcriptional activation role whatsoever. Nevertheless, in combination with the prior CRISPRi depletion of PVT138, four out of five cheRNAs functionally tested do potentiate transcription of their neighboring gene, arguing that these mechanisms are indeed more widespread.
A possible evolutionary origin for cheRNA transcription
Class I transposable elements (TEs) carry their own promoters, and might provide an evolutionary origin to cheRNAs as has been suggested for other lncRNAs55,56. Indeed, 96% of K562 and 98% of H1 CAGE-supported cheRNA overlap with class I TEs (greater than chance expectation, empirical p < 0.001), although this class I TE enrichment is similar to Gencode lncRNAs bearing CAGE-peaks (Supplementary Fig. 8b). Whereas there is only modest correspondence with enhancers annotated by chromatin signatures (7–38%) or eRNAs (9–15%) (Supplementary Fig. 8b). Intriguingly, we also identified a ~800 bp region in HIDALGO that corresponds to the insertion of three primate-specific class I TEs (L1PA11, MER41A, and L1P3) during the split between simians (old or new world monkeys and apes), and prosimians(Supplementary Fig. 8a,c) ~35–55 million years ago. Hemoglobin γ subunits transition to β during fetal to infant development only in simian primates57. It is possible that these endogenous retroviruses introduced regulatory elements that contributed to fetal hemoglobin switching, similar to a recently described contribution to innate immune response58. In support of this hypothesis, a reporter construct containing the promoter of HIDALGO exhibited >80-fold induction of luciferase (Fig. 6c), however a longer construct also containing these TEs not only erased this induction, but led to a 4.4-fold decrease in luciferase expression(Supplementary Fig. 8d). Future experiments should address whether these elements indeed contain repressor sequences that are responsible for fetal hemoglobin regulation changes during primate evolution.
Online Methods
Cell culture and Nuclear Fractionation
H1 hESCs were grown feeder free on Matrigel (BD Bioscience) in StemPro media (Invitrogen), and K562 cells were maintained at ~0.1–1 ×10⁶ cells/ml in RPMI 1640 (Gibco), 2mM Glutamine, 10% FBS, 1% penicillin/streptomycin. ‘Plus Hemin’ cells were treated with freshly prepared 50 μM hemin (Chem IMPEX International) at indicated time-points. H1 cells were provided by V. Galat, and K562 cells were provided by J. Weissman. Cell lysis, nuclear fractionation, and RNA isolation were performed as previously described on three independent cultures of 107 K562 cells and H1 hESCs14. Briefly, purified nuclei were extracted with 0.5M Urea and 0.5% NP-40 substitute to solubilize loosely bound factors from chromatin, and then fractionated by centrifugation. RNA from both the chromatin pellet (CP) and soluble nuclear extract (SN) were obtained by Trizol extraction (Life Technologies) and further purified by RNA-Clean and Concentrator columns (Zymo Research) with in-column DNase I digestion as described in the manufacturers protocol. In vitro transcribed RNA standards (see below) were added to purified chromatin pellet and soluble nuclear extract RNA isolates, then ribosomal RNA was depleted using Ribo-Zero Gold (Illumina), and stranded cDNA libraries were made using NEBNext Ultra Directional DNA Library Prep Kit for Illumina, and sequenced on an Illumina HiSeq2000. K562 and H1 hESC libraries were sequenced by single-end 100bp reads, while two replicates of hemin treated K562 cell libraries were sequenced with single-end 50 bp reads.
Calibrated RNA-seq
Spike-in standards were in vitro transcribed with recombinant T7 polymerase61, and were selected based on lack of homology to human genes and approximately similar lengths within the set (777–1290 nucleotides, Supplementary Fig. 1a). RNA was purified with Zymo RNA-Clean and Concentrator columns, and serially diluted in a buffer containing 50 mM NaCl, 0.01% NP-40 substitute, 100 ng/μl pUC19, 10 mM Tris-HCl ph 7.5, and 1 mM EDTA before adding to CP and SN RNA prior to rRNA depletion with Ribo-Zero Gold (Illumina). The four RNA standards were added at 2.7×10⁶, 9×10⁵, 3×10⁵, and 1×10⁵ copies per K562 library, and 9×10⁵, 3×10⁵, 1×10⁵, and 3×10⁴ copies per H1 library to create calibration curves. We performed linear regression of the absolute read counts from RNA-seq versus the number of molecules of RNA standard added per cell number equivalent to each library (calculated from the number of cells that each extract was derived from, Supplementary Fig. 1b). The resulting linear fit equation was then used to compute the approximate molecules per cell for cheRNAs based on their absolute read counts for each pool (soluble, chromatin pellet) for each biological triplicate (Supplementary Fig. 1c), and to confirm chromatin vs. soluble nuclear extract enrichment. *See Bioinformatics Supplementary Note for computational analysis.
Reverse Transcription and RT-qPCR
Reverse transcription of isolated total RNA was performed in 20 μL reactions using 0.5 ug (LNA ASO, HIDALGO KD experiments) or 1 ug (all other experiments) total RNA with 100 ng random hexamers (IDT) and 100 U MMLV-HP Reverse Transcriptase (Epicentre) according to manufacturer’s instructions. RNA was then degraded by 100 mM KOH + 13.3 mM Tris base (final concentration) and incubation at 95°C for 10 minutes; afterwards, pH was adjusted to ~8.0 using 150 mM HCl, and samples were diluted with 50–200 uL TE buffer (10mM Tris•HCl + 1mM EDTA•NaOH, pH 8.0). Real time quantitative PCR (RT-qPCR) was performed with Power SYBR Green PCR Master Mix (Applied Biosystems) and 2–4 μL cDNA per reaction, with 250 nM each primer on a Bio-Rad CFX384 instrument. 3–4 technical replicates of each reaction were performed, and all independent replicate targeting and negative control samples corresponding to the same experiment were queried simultaneously on the same plate.
For CRISPRi Figure 3, a total of six unique reference gene candidates (18S rRNA, GAPDH, PGK1, PPIB, TBP, SDHA were evaluated for their relative stability via calculation of the geNorm M value62 parameter (qbase+ software, Biogazelle). Although these genes exhibit differing absolute stability ranks between the aforementioned groups of samples (i.e. BONIFACIO-targeting samples vs. ILYICH-targeting samples), the scale of differences between these candidates across different samples was generally small, and the relative relationships of target genes of interest between samples were generally robust to the reference gene choice. PPIB was ultimately chosen for use across all Figure 3 sample groups on the basis of the relative expression level (2ΔCt) consistency across negative control independent experiments. The amplification efficiency and factor of all primers corresponding to Figure 3 were measured using a 5–10 point 2-fold dilution series of select cDNA samples, where for PPIB three independent dilution series replicates were performed and the amplification factor was calculated as the average across replicates. The measured amplification factor of each primer set was used as the base for exponentiation of the respective amplicon’s mean Ct value when calculating “2ΔCt”. 18S rRNA was used as the reference gene for all other RT-qPCR displayed.
Fold-differences (2ΔΔCt) of targeting samples were calculated relative to the respective negative control samples, with scaling of the mean negative control expression level to 1. Throughout figures displaying relative fold changes, the SEM displayed for targeting samples includes the propagated uncertainty of the mean negative control expression level used for calculating fold-differences.
Statistics
For data presented in Figure 1, p-values were calculated via the Mann-Whitney-Wilcoxon Test in R. For data presented in Figures 3, 4c, 5c–d, and Supplementary Figure 6c–d, p-values were calculated via two-tailed Welch’s t-test in R. Except for Figure 5c–d, distributions of raw RT-qPCR data (2ΔCt, in all instances averaged from 3–4 technical qPCR replicates per plate) from all measurements of all independent experiments, prior to conversion to fold-change values, were compared for significance testing. For Figure 5c–d, the compared distributions consisted of data following conversion to relative fold-change values. Data shown in Figures 3d and 3f are calculated from averaging across all independent experiments and two (3d & 3f, sgRNAs 1–4 & “-“) or four (3f, sgRNAs 5–6 & “-“) independent qPCR plates assaying these experiments. Otherwise, data from multiple independent experiments are calculated from averaging of single qPCR plate measurements across the replicate experiments alone (i.e. Figures 3e & 4c), or across qPCR technical replicates only if only single independent experiments were performed (i.e. Figure 5b & 5e). Figures 3d and 3e correspond to the n=3 and n=6 targeting and negative control experiment counts, respectively, in the stated Figure 3 n range; Figure 3f corresponds to the stated n=4 and n=7, or n=1 and n=2, experiment counts. For Figure 4c and Supplementary Figure 6c–d, t = 0, 2, and 4 hour data points correspond to four independent experiments, while t = 8, 12, and 24 hour data points correspond to three independent experiments.
Characterization of HIDALGO transcripts
The initial evidence for several HIDALGO transcripts from our CPE sequencing and splice sites detected therein, was further supported by 5′ and 3′-RACE using gene specific primers, CAGE-seq peaks60, and RT-qPCR. 5′ RACE was performed using SMARTER 5’/3’ RACE kit (Clontech) following manufacturers protocols. In brief, reverse transcription was performed with random-hexamer primers, then PCR was performed with Clontech adapters, and imaged on a 1% agarose gel stained with ethidum bromide. RACE was performed on either total RNA or chromatin pellet, which yielded similar results. Relative HIDALGO transcript amounts were assessed by RT-qPCR with several primer sets (Supplementary Fig. 4c,e,f), some of which are isoform specific in that they span spatially disparate exon-exon junctions, and some of which should detect all isoforms. Measurement of relative isoform abundance requires synthesis of direct and indirect evidence: primer sets that detect both isoforms #1–2, isoform #3 alone, and the composite of #1–4, respectively. As there are no unique splice sites within HIDALGO isoform #4 that enable selective detection, its levels are inferred by comparison of primer set #1–4 to those that detect #1–2 and #3.
The consensus TATA-box is “TATAWAWR” (where W= A/T, R=A/G63) and there is support for binding of this motif by TFIIB of the PIC 10–30 bp upstream of the exact site of initiation with 0 or 1 mismatches64. The cryptic TATA box for HIDALGO TSS#4 is “TATAAGTA” which has one purine→purine mismatch relative to consensus, and both 5’-RACE evidence (Supplementary Fig. 4e) and CAGE-seq (Fig. 4a) suggest that this element is 137 bp upstream of the +1 base. Moreover, the hallmarks of transcriptional initiation21,63,65 are present at this site in ENCODE datasets (H3K4me3, a pol II peak, DNAse I hypersensitivity, histone acetylation, TF binding sites, Figure 4a).
cheRNA knockdowns
CRISPRi was performed in K562 or HEK293 cells with dCas9-KRAB integrated in the genome38,66. K562 CRISPRi cells were generously provided by Luke Gilbert and Jonathan Weissman, and HEK293 CRISPRi cells were generated by Lipofectamine 2000 (Invitrogen) transfection of a modified dCas9-KRAB vector flanked by an FRT site and containing a hygromycin resistance gene, into HEK293 Flp-In (Invitrogen) cells, followed by greater than two weeks of continual hygromycin resistance (100 μg/ml). sgRNAs were designed by eCRISP(http://www.e-crisp.org/), cloned into a modified px33038,67 vector containing eGFP and a modified stem loop designed to increase binding to dCas968, and verified by Sanger sequencing. Twenty-four hours prior to transfection, cells were seeded to 6-well plates with 5.0–8.0 × 10⁵ cells/well (K562 CRISPRi) or 1.2 × 10⁶ cells/well (HEK293 CRISPRi) in either RPMI 1640 (Mediatech Inc./Corning Cellgro), 2mM Glutamine, 10% FB Essence (Seradigm), 1% penicillin/streptomycin for K562 CRISPRi cells, or DMEM (Gibco) 10% FB Essence (Seradigm), 1% penicillin/streptomycin for HEK293 CRISPRi. For each transfection, 10 μl of Lipofectamine 2000 reagent was diluted in 250 μl Opti-MEM Reduced Serum Media (Gibco), and 4 μg of plasmid DNA was diluted in 250 μl Opti-MEM. Diluted Lipofectamine and DNA were combined, mixed by pipetting, and incubated for 10 minutes at room temperature, then added drop-wise to cells without removing media. After two days cells were re-plated on 10 cm plates.
Four to six days post-transfection cells were removed from plates (we found this an optimal time-span for knock-down; before which there may not have been enough time, and after which there were too few remaining GFP+ cells for subsequent experiments (i.e. RT-qPCR, ChIP), centrifuged 5 minutes 500 × g, 4° C, and re-suspended in 1–2 ml fresh media, then GFP positive cells were isolated by FACS (Aria II/III, BD). Transfection conditions, outgrowth and sorting for a given experiment with all relevant controls were performed identically side-by-side. The majority of K562 CRISPRi experiments were GFP+ sorted and harvested five days post-transfection.
Sorted cells were pelleted (5 min, 500 × g, 4° C, and re-suspended in 500 μl Trizol (Life Technologies). The aqueous layer from Trizol extraction was applied to RNA Clean & Concentrator-25 columns (Zymo Research), and then converted into cDNA as described above. Polyclonal K562 cell-lines with sgRNAs incorporated into the genome were transfected as above with Lipofecatmine 2000 with the same vector used for transient transfections except eGFP was replaced with a puromycin resistance gene. Selection was performed with puromycin (6.7 μg/ml) two days after transfection and continued for two weeks. All comparisons (Fig. 3, 5 and 6, and Supplementary Fig. 3a–c, Supplementary Fig. 5c–d) were made relative to an off-target 21 nt negative control sgRNA referred to as “negative control 1” in Gilbert et al. 2014, and referred to in figures in this manuscript as “-”, except fig. 5e were hemin-induction of stable cell lines were made relative to “normal” K562 cells. The closest match to the negative control sgRNA is 15 nt of hybridization to a protocadherin (PCDH17), that is missing a PAM sequence and is not expressed in K562 cells.
ASO knock-downs were performed with 50 nM (final concentration) LNA-FAM gapmers (Exiqon) transfected with Lipofectamine 2000. Oligos were diluted in 250 μl Opti-MEM, then incubated 10 minutes room temperature with 10 μl Lipofecatmine 2000 reagent diluted in 250 μl Opti-MEM (500 μl final) prior to adding to 3 ml of cells in RPMI 1640 media in 6-well culture plates. Similar to CRISPRi transfections, cells were passaged to 10 cm plates in 10 ml fresh media after two days, and then grown for 3 more days (5 total post-transfection). GFP positive cells were FACS-sorted on the FAM channel (Aria II/III, BD), and subjected to RNA isolation, ChIP, or 3C. Subtle effects on HBG2 were also observed for ASO-1, potentially attributable to substantial sequence similarity between the two mRNAs, a similar transcribed region of homology (15/16 bp match) downstream of HBG2 (Fig. 4a), or more widespread effects of HIDALGO. All ASO comparisons are made relative to a non-targeting LNA-FAM (Exiqon) that was transfected in parallel, referred to as “ASO –” in figures and Supplementary Table 1.
Chromosome Conformation Capture (3C)
3C was performed on LNA ASO HIDALGO KD samples (Figure 6A) mostly as described69 with the following modifications. K562 cell samples were crosslinked with 2% (w/v) formaldehyde (made fresh from paraformaldehyde, Sigma-Aldrich P6148) in 1× PBS supplemented with 10% (v/v) FB Essence (Seradigm) at room temperature for 10 minutes. After quenching with 125 mM glycine, cells were pelleted (225 rcf, 8 min, 4°C) and lysed via resuspension and incubation in ice-cold lysis buffer (10 mM Tris-HCl pH 7.5, 10 mM NaCl, 5 mM MgCl2, 0.1 mM EDTA, 0.1% Triton X-100, 1× Roche Protease Inhibitor Cocktail) for 10 minutes on ice. Nuclei were pelleted (400 rcf, 5 min, 4°C), frozen in liquid nitrogen, and stored at -80°C. Thawed nuclei pellets were resuspended in 0.5 mL Buffer A (10 mM HEPES pH 7.9, 10 mM KCl, 4 mM MgCl2, 340 mM sucrose, 10% (v/v) glycerol, 1 mM DTT, 1× Roche Protease Inhibitor Cocktail) + 0.12% (w/v) SDS and incubated at 37°C for 1 hour while shaking at 900 rpm. Triton X-100 was added to 1% (v/v) final and samples were incubated at 37°C (1 hour, 900 rpm in Eppendorf Thermomixer). Homogeneity of the nuclei suspension was maintained via pipetting every 20 minutes during both detergent incubations. Nuclei were pelleted (500 rcf, 10 min, room temperature), and 0.4 mL of the supernatant was removed. The pellet and remaining volume of supernatant were resuspended in 0.25 mL final of 0.5× Buffer A + 1× CutSmart Buffer (NEB) with the concentration of protease inhibitor adjusted to 1× final. DNA digestion was performed at 37°C (12 hours, 900 rpm) with initially 100 units of NspI (NEB), plus 20 more units after 1.5 hours.
Following digestion, SDS was added to 1.6% (w/v) final and samples were incubated at 65°C (25 min, 900 rpm). Each sample volume was then mixed with 3.063 mL of 1.15× T4 DNA Ligase Reaction Buffer (NEB, 1× = 50 mM Tris-HCl pH 7.5, 10 mM MgCl2, 1 mM ATP, 10 mM DTT) + 1% (v/v) final Triton X-100 and incubated at 37°C for 1 hour with rotation. Ligation was performed at 16°C for 4 hours followed by a 30 minute incubation at room temperature using, initially, 100 units of T4 DNA Ligase (Promega HC), plus 30 units more after 2 hours. After ligation, the volume of each sample was increased to 7.0 mL with 50 mM Tris-HCl pH 8.0, with addition of EDTA pH 8.0 to a final concentration of 5 mM and adjustment of SDS concentration to 0.5% (w/v). De-crosslinking was performed with 300 ug Proteinase K (Invitrogen) and incubation at 60°C for 14 hours, plus another 300 ug Proteinase K after the first 3 hours (600 ug total). No RNase step was performed.
Afterwards, samples were frozen in liquid nitrogen and lyophilized. Lyophilized samples were resuspended in 1 mL 10 mM Tris-HCl pH 8.0 and heated briefly at 65°C until fully solubilized. DNA was purified via phenol-chloroform extraction, with three chloroform back-extractions of the aqueous phase, and subsequent ethanol precipitation with glycogen. A second ethanol precipitation of the resuspended pellet was required to eliminate residual contaminating species with absorbance near 230 nm.
RT-qPCR was performed using 200 ng per reaction of this material in triplicate, with normalization to GAPDH amplicon. GAPDH reactions were performed using Power SYBR Green PCR Master Mix (Applied Biosystems) and final primer concentrations of 250 nM (each). Ligation products were detected using a TaqMan probe that anneals to a common region and differing primer pairs corresponding to the different contact loci (see Supplementary Table 1 for all sequences). TaqMan reactions were performed using TaqMan Gene Expression Master Mix (Applied Biosystems) with final primer and probe concentrations of 500 nM and 250 nM, respectively. 3C was performed using four independent experiments of each the HIDALGO-targeting ASO and non-targeting negative control ASO (“ASO 1” and “ASO –”, respectively, see Supplementary Table 1), and a single “ASO 1” outlier was detected and excluded at 95% confidence using Dixon’s Q test. Shaded regions of each curve in Figure 6A correspond to SEM from independent experiments (solid line is arithmetic mean), where for the “ASO 1” curves this SEM includes the propagated uncertainty of the “ASO –” mean value used for conversion of the contact frequencies into relative values (with scaling of the maximum “ASO -” mean value to 1).
3C was performed on CRISPRi HIDALGO KD samples (Supplementary Figure 5C) as described above with the following differences. Following the first 0.12% (w/v) SDS and 1% (v/v) Triton X-100 incubations, nuclei were spun through a 5 mL sucrose cushion (10 mM HEPES•KOH, pH 7.9, 30% (w/v) sucrose, 4 mM MgCl2), then resuspended in 0.5× Buffer A + 1× CutSmart Buffer (NEB). De-crosslinking was performed with addition of 200 ug Proteinase K (Invitrogen) and incubation at 65°C for 5 hours. Samples were then treated with 150 ug RNase A for 45 minutes at 37°C. Ethanol precipitation was performed as described69.
Single molecule FISH
HEK293 cells were grown on acid-washed coverslips in 6 well plates. Stellaris FISH Probes (Biosearch Technologies, Inc., Petaluma, CA) against PVT1 exons and the two MYC introns, labeled with Cy5 and Cy3, respectively, were designed with the Stellaris FISH Probe Designer (www.biosearchtech.com/stellarisdesigner). HEK293 cells were hybridized with the PVT1 and MYC intron smFISH Probe sets following the manufacturer’s instructions available online at www.biosearchtech.com/stellarisprotocols, and imaged on a Zeiss Axiovert 200M inverted wide-field microscope in the UChicago Microscopy Core Facility. Three-dimensional Z-stacks of images were flattened and background-subtracted using ImageJ software. Foci were identified as local maxima, then regions of interest were drawn around cells containing MYC intron or PVT1 foci. Cells that contained an apparent MYC intron were recorded and compared to cells containing PVT1 foci. In cells bearing foci for each of the RNA, distances between centers of mass of each MYC intron 2 focus and the nearest PVT1 foci were measured using Object-based methods in the JACoP plugin70, and a histogram of nearest-distances was plotted in R.
Luciferase assays
Luciferase response assays were performed as previously described71. Candidate elements were amplified from HEK293T genomic DNA or synthesized via Gibson Assembly. Sequence was verified and then cloned into the pGL4.23 enhancer luciferase response vector with minimal promoter. K562 immortalized cells were co-transfected with luciferase response vector and a pRL renilla luciferase control using Lipofectamine 3000, cultured for 48 hours after transfection, then lysed and assayed using the Dual-Luciferase Reporter Assay system (Promega).
ICeChIP
ICeChIP was conducted as previously described45, with some modifications. Sorted cell pellets (see cheRNA knockdowns), once harvested, were washed with 1 mL ice-cold PBS, then with 1 ml ice-cold Buffer N (15 mM Tris-HCl pH 7.5, 15 mM NaCl, 60 mM KCl, 8.5% w/v sucrose, 5 mM MgCl2, 1 mM CaCl2, 1 mM DTT, 200 uM PMSF, 50 ug/mL BSA, 1× Roche Protease Inhibitor Cocktail) and pelleted at 500g for 5 minutes at 4°C. The cell pellets were then resuspended in 2 volumes of Buffer N and lysed by adding 1 volume (i.e. 3 PCV) of 2× Lysis Buffer (Buffer N supplemented with 0.6% v/v NP-40 Substitute [Sigma]) and incubating for 10 minutes at 4°C. Following lysis, nuclei were pelleted at 500g for 5 minutes at 4°C, and the nuclei were resuspended in 6 volumes of Buffer N. To quantify nuclei, 2 μl of the nuclei suspension was added to 98 μl of 2M NaCl in triplicate and vortexed vigorously. Total nucleic acid of the nuclei-salt mixtures was then determined spectroscopically.
The nuclei were then spiked with 2 uL of approximately 5 nM nucleosome standards. The spiked nuclei were pre-warmed at 37°C while shaking at 900rpm for 2 minutes; then, 1 Worthington unit of micrococcal nuclease (MNase) was added for every 1 μg of chromatin in the nuclei suspension, and the suspension was incubated at 37°C while shaking at 900 rpm for 12 minutes. After digestion, 1/9 volume of 10× MNase Stop Buffer (10 mM EDTA, 10 mM EGTA) was added while vortexing. The nuclei were then lysed by adding 5 M NaCl to a final concentration of 600 mM NaCl while vortexing. The insoluble debris was pelleted at 18,000g for 1 minute at 4°C. The soluble chromatin was diluted with 1 volume of ChIP Buffer 1 (25 mM Tris pH 7.5, 5 mM MgCl2, 100 mM KCl, 10% v/v glycerol, 0.1% v/v NP-40 Substitute).
For the H3K27me3 ICeChIP, 10 μl of Protein G Dynabeads (Invitrogen) were washed twice by resuspension into 200 μl of ChIP Buffer 1, collecting on a magnetic rack. CST9733 antibody (0.6 μg, Cell Signaling) was diluted to 100 μl in ChIP Buffer 1 and added to Dynabeads before incubating on a rotator for at least 1 hour at 4°C. After conjugation, the beads were washed 2× with ChIP Buffer 1, then resuspended in 50 μl of ChIP Buffer 1. For H3K4me3 and H3K9me3 ICeChIP experiments, the biotinylated recombinant Fab was conjugated to M-280 Streptavidin Beads (10 μl, Invitrogen) as previously described72. Briefly, 0.6 μg of each recombinant Fab (either 304M3B for H3K4me3, or 309M3B for H3K9me3) were conjugated to pre-washed M-280 resin by incubation in 100 μl of ChIP Buffer 1 with 50 μg/μl BSA for one hour, followed by two washes of the conjugated beads with ChIP Buffer 1 with 50 ug/uL BSA and 5 uM biotin for 15 minutes each.
Each bead suspension was added to 800ng of chromatin and incubated on a rotator for 15 minutes at 4°C. The beads were then washed 2× with 200 μl ChIP Buffer 2 (25 mM Tris pH 7.5, 5 mM MgCl2, 300 mM KCl, 10% v/v glycerol, 0.1% v/v NP-40 Substitute), transferred to a new tube, and incubated on a rotator for 10 minutes at 4°C. Washing was repeated 2× more times with 200 μl ChIP Buffer 3 (10 mM Tris pH 7.5, 250 mM LiCl, 1 mM EDTA, 0.5% sodium deoxycholate, 0.5% v/v NP-40 substitute). The beads were then rinsed with 200 μl ChIP Buffer 1, then 200 μl TE buffer, and resuspended in 50 μl ChIP Elution Buffer (50 mM Tris pH 7.5, 1 mM EDTA, 1% w/v SDS), and incubated at 55°C for 5 minutes. The supernatant was collected. ChIP Elution Buffer was also added to the inputs and processed as other samples in all downstream steps.
Samples were adjusted to a final concentration of 200 mM NaCl and 10 mM EDTA. Proteinase K (10 μg) was then added to each elution, and incubated at 55°C for 2 hours. The DNA was then recovered by adding 1.5 volumes of Serapure HD73 and incubating at room temperature for 15 minutes, then collecting on a magnetic rack, washing twice on the magnetic rack with 70% ethanol, and eluting into 50 uL of 0.1× TE.
Supplementary Material
Acknowledgments
We are grateful for ChIP-seq data from ENCODE, in particular, that deposited by Snyder and Bernstein labs. We would like to thank the following University of Chicago Core Facility personnel: P. Faber and H. Whitehurst in Functional Genomics for Illumina sequencing, and D. Leclerc in Flow Cytometry for FACs training. K562 cells with dCas9-KRAB stably integrated into the genome were generously provided by L. Gilbert and J. Weissman. We would also like to thank V. Lynch for helpful discussions regarding cheRNAs and transposable elements. These studies were supported by Stanley Manne Children’s Research Institute’s Grant to V.G. We thank Y.Galat for technical help in ESC culture. M.S.W. is supported by the Chicago Biotechnology Consortium with support from The Searle Funds at The Chicago Community Trust; A.J.R. is supported by the Ellison Medical Foundation (AG-NS-1118-13), NIH (R01-GM115945), and American Cancer Society (130230-RSG-16-248-01-DMC).
Footnotes
AUTHOR CONTRIBUTIONS
A.J.R. and M.S.W. designed the study and wrote the paper with valuable input from all of the other authors. M.S.W. performed the experiments for Figures 1 & 2, and the initial experiments for Figures 3, 4, & 5. M.A.S. repeated most of the Figure 3, 4, & 5 experiments in higher replicate with assistance from M.S.W., and performed 3C with ASO-treated cells. R.N.S. and A.T.G. performed ICeChIP experiments. R.D.N. performed luciferase assay to examine enhancer activity of the HIDALGO TSS with oversight form I.P.M. V.G. cultured H1 ESCs used.
COMPETING FINACIAL INTERESTS STATEMENT
The authors declare no competing financial interests.
References
- 1.Wang KC, et al. A long noncoding RNA maintains active chromatin to coordinate homeotic gene expression. Nature. 2011;472:120–124. doi: 10.1038/nature09819. [DOI] [PMC free article] [PubMed] [Google Scholar]
- 2.Yang L, et al. lncRNA-dependent mechanisms of androgen-receptor-regulated gene activation programs. Nature. 2013;500:598–602. doi: 10.1038/nature12451. [DOI] [PMC free article] [PubMed] [Google Scholar]
- 3.Dinger ME, et al. Long noncoding RNAs in mouse embryonic stem cell pluripotency and differentiation. Genome Res. 2008;18:1433–1445. doi: 10.1101/gr.078378.108. [DOI] [PMC free article] [PubMed] [Google Scholar]
- 4.Rinn JL, et al. Functional demarcation of active and silent chromatin domains in human HOX loci by noncoding RNAs. 2007;129:1311–1323. doi: 10.1016/j.cell.2007.05.022. [DOI] [PMC free article] [PubMed] [Google Scholar]
- 5.Lai F, et al. Activating RNAs associate with Mediator to enhance chromatin architecture and transcription. Nature. 2013;494:497–501. doi: 10.1038/nature11884. [DOI] [PMC free article] [PubMed] [Google Scholar]
- 6.Trimarchi T, et al. Genome-wide mapping and characterization of Notch-regulated long noncoding RNAs in acute leukemia. Cell. 2014;158:593–606. doi: 10.1016/j.cell.2014.05.049. [DOI] [PMC free article] [PubMed] [Google Scholar]
- 7.Feng J, et al. The Evf-2 noncoding RNA is transcribed from the Dlx-5/6 ultraconserved region and functions as a Dlx-2 transcriptional coactivator. Genes & Development. 2006;20:1470–1484. doi: 10.1101/gad.1416106. [DOI] [PMC free article] [PubMed] [Google Scholar]
- 8.Xiang JF, et al. Human colorectal cancer-specific CCAT1-L lncRNA regulates long-range chromatin interactions at the MYC locus. Cell Research. 2014;24:513–531. doi: 10.1038/cr.2014.35. [DOI] [PMC free article] [PubMed] [Google Scholar]
- 9.Li W, et al. Functional roles of enhancer RNAs for oestrogen-dependent transcriptional activation. Nature. 2013;498:516–520. doi: 10.1038/nature12210. [DOI] [PMC free article] [PubMed] [Google Scholar]
- 10.Lai F, Gardini A, Zhang A, Shiekhattar R. Integrator mediates the biogenesis of enhancer RNAs. Nature. 2015;525:399–403. doi: 10.1038/nature14906. [DOI] [PMC free article] [PubMed] [Google Scholar]
- 11.Davidovich C, et al. Toward a consensus on the binding specificity and promiscuity of PRC2 for RNA. Mol Cell. 2015;57:552–558. doi: 10.1016/j.molcel.2014.12.017. [DOI] [PMC free article] [PubMed] [Google Scholar]
- 12.Direct visualization of the co-transcriptional assembly of a nuclear body by noncoding RNAs. Nat Cell Biology. 2011;13:95–101. doi: 10.1038/ncb2140. [DOI] [PMC free article] [PubMed] [Google Scholar]
- 13.Engreitz JM, et al. Local regulation of gene expression by lncRNA promoters, transcription and splicing. Nature. 2016;539:452–455. doi: 10.1038/nature20149. [DOI] [PMC free article] [PubMed] [Google Scholar]
- 14.Werner MS, Ruthenburg AJ. Nuclear Fractionation Reveals Thousands of Chromatin-Tethered Noncoding RNAs Adjacent to Active Genes. Cell Rep. 2015;12:1089–1098. doi: 10.1016/j.celrep.2015.07.033. [DOI] [PMC free article] [PubMed] [Google Scholar]
- 15.Petruk S, et al. Transcription of bxd noncoding RNAs promoted by trithorax represses Ubx in cis by transcriptional interference. Cell. 2006;127:1209–1221. doi: 10.1016/j.cell.2006.10.039. [DOI] [PMC free article] [PubMed] [Google Scholar]
- 16.Schmitt S, Prestel M, Paro R. Intergenic transcription through a polycomb group response element counteracts silencing. Genes & Development. 2005;19:697–708. doi: 10.1101/gad.326205. [DOI] [PMC free article] [PubMed] [Google Scholar]
- 17.Melé M, Rinn JL. ‘Cat’s Cradling’ the 3D Genome by the Act of LncRNA Transcription. Mol Cell. 2016;62:657–664. doi: 10.1016/j.molcel.2016.05.011. [DOI] [PubMed] [Google Scholar]
- 18.Paralkar VR, et al. Unlinking an lncRNA from Its Associated cis Element. Mol Cell. 2016;62:104–110. doi: 10.1016/j.molcel.2016.02.029. [DOI] [PMC free article] [PubMed] [Google Scholar]
- 19.Bhatt DM, et al. Transcript dynamics of proinflammatory genes revealed by sequence analysis of subcellular RNA fractions. Cell. 2012;150:279–290. doi: 10.1016/j.cell.2012.05.043. [DOI] [PMC free article] [PubMed] [Google Scholar]
- 20.Wuarin J, Schibler U. Physical isolation of nascent RNA chains transcribed by RNA polymerase II: evidence for cotranscriptional splicing. Mol Cell Biol. 1994;14:7219–7225. doi: 10.1128/mcb.14.11.7219. [DOI] [PMC free article] [PubMed] [Google Scholar]
- 21.ENCODE Project Consortium. An integrated encyclopedia of DNA elements in the human genome. Nature. 2012;489:57–74. doi: 10.1038/nature11247. [DOI] [PMC free article] [PubMed] [Google Scholar]
- 22.Postepska-Igielska A, et al. LncRNA Khps1 Regulates Expression of the Proto-oncogene SPHK1 via Triplex-Mediated Changes in Chromatin Structure. Mol Cell. 2015;60:626–636. doi: 10.1016/j.molcel.2015.10.001. [DOI] [PubMed] [Google Scholar]
- 23.Sunwoo H, Wu JY, Lee JT. The Xist RNA-PRC2 complex at 20-nm resolution reveals a low Xist stoichiometry and suggests a hit-and-run mechanism in mouse cells. Proc Natl Acad Sci USA. 2015;112:E4216–E4225. doi: 10.1073/pnas.1503690112. [DOI] [PMC free article] [PubMed] [Google Scholar]
- 24.Cabili MN, Dunagin MC, McClanahan PD. Localization and abundance analysis of human lncRNAs at single-cell and single-molecule resolution. Genome Biol. 2015 doi: 10.1186/s13059-015-0586-4. [DOI] [PMC free article] [PubMed] [Google Scholar]
- 25.Ørom UA, et al. Long noncoding RNAs with enhancer-like function in human cells. Cell. 2010;143:46–58. doi: 10.1016/j.cell.2010.09.001. [DOI] [PMC free article] [PubMed] [Google Scholar]
- 26.Ernst J, et al. Mapping and analysis of chromatin state dynamics in nine human cell types. Nature. 2011;473:43–49. doi: 10.1038/nature09906. [DOI] [PMC free article] [PubMed] [Google Scholar]
- 27.Rada-Iglesias A, et al. A unique chromatin signature uncovers early developmental enhancers in humans. Nature. 2011;470:279–283. doi: 10.1038/nature09692. [DOI] [PMC free article] [PubMed] [Google Scholar]
- 28.Heintzman ND, et al. Histone modifications at human enhancers reflect global cell-type-specific gene expression. Nature. 2009;459:108–112. doi: 10.1038/nature07829. [DOI] [PMC free article] [PubMed] [Google Scholar]
- 29.Andersson R, et al. An atlas of active enhancers across human cell types and tissues. Nature. 2014;507:455–461. doi: 10.1038/nature12787. [DOI] [PMC free article] [PubMed] [Google Scholar]
- 30.Vilborg A, Passarelli MC, Yario TA, Tycowski KT, Steitz JA. Widespread Inducible Transcription Downstream of Human Genes. Mol Cell. 2015;59:449–461. doi: 10.1016/j.molcel.2015.06.016. [DOI] [PMC free article] [PubMed] [Google Scholar]
- 31.Na J, Furue MK, Andrews PW. Inhibition of ERK1/2 prevents neural and mesendodermal differentiation and promotes human embryonic stem cell self-renewal. Stem Cell Research. 2010;5:157–169. doi: 10.1016/j.scr.2010.06.002. [DOI] [PubMed] [Google Scholar]
- 32.de Groot RP, Raaijmakers JA, Lammers JW, Jove R, Koenderman L. STAT5 activation by BCR-Abl contributes to transformation of K562 leukemia cells. Blood. 1999;94:1108–1112. [PubMed] [Google Scholar]
- 33.Rao SSP, et al. A 3D Map of the Human Genome at Kilobase Resolution Reveals Principles of Chromatin Looping. Cell. 2014;159:1665–1680. doi: 10.1016/j.cell.2014.11.021. [DOI] [PMC free article] [PubMed] [Google Scholar]
- 34.Tseng YY, et al. PVT1 dependence in cancer with MYC copy-number increase. Nature. 2014;512:82–86. doi: 10.1038/nature13311. [DOI] [PMC free article] [PubMed] [Google Scholar]
- 35.Fulco CP, et al. Systematic mapping of functional enhancer–promoter connections with CRISPR interference. Science. 2016;354:769–773. doi: 10.1126/science.aag2445. [DOI] [PMC free article] [PubMed] [Google Scholar]
- 36.Robinson PJ, Rhodes D. Structure of the ‘30nm’ chromatin fibre: A key role for the linker histone. Current Opinion in Structural Biology. 2006;16:336–343. doi: 10.1016/j.sbi.2006.05.007. [DOI] [PubMed] [Google Scholar]
- 37.Li G, et al. Extensive Promoter-Centered Chromatin Interactions Provide a Topological Basis for Transcription Regulation. Cell. 2012;148:84–98. doi: 10.1016/j.cell.2011.12.014. [DOI] [PMC free article] [PubMed] [Google Scholar]
- 38.Gilbert LA, et al. Genome-Scale CRISPR-Mediated Control of Gene Repression and Activation. Cell. 2014;159:647–661. doi: 10.1016/j.cell.2014.09.029. [DOI] [PMC free article] [PubMed] [Google Scholar]
- 39.Addya S, et al. Erythroid-induced commitment of K562 cells results in clusters of differentially expressed genes enriched for specific transcription regulatory elements. Physiological Genomics. 2004;19:117–130. doi: 10.1152/physiolgenomics.00028.2004. [DOI] [PubMed] [Google Scholar]
- 40.Bodine DM, Ley TJ. An enhancer element lies 3′ to the human A gamma globin gene. EMBO J. 1987;6:2997–3004. doi: 10.1002/j.1460-2075.1987.tb02605.x. [DOI] [PMC free article] [PubMed] [Google Scholar]
- 41.Purucker M, Bodine D, Lin H, McDonagh K, Nienhuis AW. Structure and function of the enhancer 3′ to the human A γ, globin gene. Nucleic Acids Res. 1990;18:7407–7415. doi: 10.1093/nar/18.24.7407. [DOI] [PMC free article] [PubMed] [Google Scholar]
- 42.Maamar H, Cabili MN, Rinn J, Raj A. linc-HOXA1 is a noncoding RNA that represses Hoxa1 transcription in cis. Genes & Development. 2013;27:1260–1271. doi: 10.1101/gad.217018.113. [DOI] [PMC free article] [PubMed] [Google Scholar]
- 43.Dekker J, Rippe K, Dekker M, Kleckner N. Capturing Chromosome Conformation. Science. 2002;295:1306–1311. doi: 10.1126/science.1067799. [DOI] [PubMed] [Google Scholar]
- 44.Schultz DC, Ayyanathan K, Negorev D, Maul GG, Rauscher FJ. SETDB1: a novel KAP-1-associated histone H3, lysine 9-specific methyltransferase that contributes to HP1-mediated silencing of euchromatic genes by KRAB zinc-finger proteins. Genes & Development. 2002;16:919–932. doi: 10.1101/gad.973302. [DOI] [PMC free article] [PubMed] [Google Scholar]
- 45.Grzybowski AT, Chen Z, Ruthenburg AJ. Calibrating ChIP-Seq with Nucleosomal Internal Standards to Measure Histone Modification Density Genome Wide. Mol Cell. 2015;58:886–899. doi: 10.1016/j.molcel.2015.04.022. [DOI] [PMC free article] [PubMed] [Google Scholar]
- 46.Hansen KH, et al. A model for transmission of the H3K27me3 epigenetic mark. Nature Cell Biology. 2008;10:1291–1300. doi: 10.1038/ncb1787. [DOI] [PubMed] [Google Scholar]
- 47.Andersson R, Sandelin A, Danko CG. A unified architecture of transcriptional regulatory elements. Trends in Genetics. 2015;31:426–433. doi: 10.1016/j.tig.2015.05.007. [DOI] [PubMed] [Google Scholar]
- 48.Kim TK, et al. Widespread transcription at neuronal activity-regulated enhancers. Nature. 2010;465:182–187. doi: 10.1038/nature09033. [DOI] [PMC free article] [PubMed] [Google Scholar]
- 49.Lam MTY, et al. Rev-Erbs repress macrophage gene expression by inhibiting enhancer-directed transcription. Nature. 2013;498:511–515. doi: 10.1038/nature12209. [DOI] [PMC free article] [PubMed] [Google Scholar]
- 50.Arner E, et al. Transcribed enhancers lead waves of coordinated transcription in transitioning mammalian cells. Science. 2015;347:1010–1014. doi: 10.1126/science.1259418. [DOI] [PMC free article] [PubMed] [Google Scholar]
- 51.O’Sullivan JM, et al. Gene loops juxtapose promoters and terminators in yeast. Nat Genet. 2004;36:1014–1018. doi: 10.1038/ng1411. [DOI] [PubMed] [Google Scholar]
- 52.Guttman M, et al. lincRNAs act in the circuitry controlling pluripotency and differentiation. Nature. 2011;477:295–300. doi: 10.1038/nature10398. [DOI] [PMC free article] [PubMed] [Google Scholar]
- 53.Pandey RR, et al. Kcnq1ot1 antisense noncoding RNA mediates lineage-specific transcriptional silencing through chromatin-level regulation. Mol Cell. 2008;32:232–246. doi: 10.1016/j.molcel.2008.08.022. [DOI] [PubMed] [Google Scholar]
- 54.Penny GD, Kay GF, Sheardown SA, Rastan S, Brockdorff N. Requirement for Xist in X chromosome inactivation. Nature. 1996;379:131–137. doi: 10.1038/379131a0. [DOI] [PubMed] [Google Scholar]
- 55.Kapusta A, et al. Transposable elements are major contributors to the origin, diversification, and regulation of vertebrate long noncoding RNAs. PLoS Genet. 2013;9:e1003470. doi: 10.1371/journal.pgen.1003470. [DOI] [PMC free article] [PubMed] [Google Scholar]
- 56.Lynch VJ, et al. Ancient transposable elements transformed the uterine regulatory landscape and transcriptome during the evolution of mammalian pregnancy. Cell Rep. 2015;10:551–561. doi: 10.1016/j.celrep.2014.12.052. [DOI] [PMC free article] [PubMed] [Google Scholar]
- 57.Johnson RM, et al. Fetal Globin Expression in New World Monkeys. J Biol Chem. 1996;271:14684–14691. doi: 10.1074/jbc.271.25.14684. [DOI] [PubMed] [Google Scholar]
- 58.Chuong EB, Elde NC, Feschotte C. Regulatory evolution of innate immunity through co-option of endogenous retroviruses. Science. 2016;351:1083–1087. doi: 10.1126/science.aad5497. [DOI] [PMC free article] [PubMed] [Google Scholar]
- 59.Harrow J, et al. GENCODE: the reference human genome annotation for The ENCODE Project. Genome Res. 2012;22:1760–1774. doi: 10.1101/gr.135350.111. [DOI] [PMC free article] [PubMed] [Google Scholar]
- 60.FANTOM Consortium and the RIKEN PMI and CLST (DGT) et al. A promoter-level mammalian expression atlas. Nature. 2014;507:462–470. doi: 10.1038/nature13182. [DOI] [PMC free article] [PubMed] [Google Scholar]
- 61.Ichetovkin IE, Abramochkin G, Shrader TE. Substrate Recognition by the Leucyl/Phenylalanyl-tRNA-protein Transferase. J Biol Chem. 1997;272:33009–33014. doi: 10.1074/jbc.272.52.33009. [DOI] [PubMed] [Google Scholar]
- 62.Vandesompele J, et al. Accurate normalization of real-time quantitative RT-PCR data by geometric averaging of multiple internal control genes. Genome Biol. 2002;3:RESEARCH0034. doi: 10.1186/gb-2002-3-7-research0034. [DOI] [PMC free article] [PubMed] [Google Scholar]
- 63.Lenhard B, Sandelin A, Carninci P. Metazoan promoters: emerging characteristics and insights into transcriptional regulation. Nature Reviews Genetics. 2012;13:233–245. doi: 10.1038/nrg3163. [DOI] [PubMed] [Google Scholar]
- 64.Siebert M, Söding J. Universality of core promoter elements? Nature. 2014;511:E11–E12. doi: 10.1038/nature13587. [DOI] [PubMed] [Google Scholar]
- 65.Guenther MG, Levine SS, Boyer LA, Jaenisch R, Young RA. A Chromatin Landmark and Transcription Initiation at Most Promoters in Human Cells. Cell. 2007;130:77–88. doi: 10.1016/j.cell.2007.05.042. [DOI] [PMC free article] [PubMed] [Google Scholar]
- 66.Gilbert LA, et al. CRISPR-mediated modular RNA-guided regulation of transcription in eukaryotes. 2013;154:442–451. doi: 10.1016/j.cell.2013.06.044. [DOI] [PMC free article] [PubMed] [Google Scholar]
- 67.Le Cong, et al. Multiplex Genome Engineering Using CRISPR/Cas Systems. Science. 2013;339:819–823. doi: 10.1126/science.1231143. [DOI] [PMC free article] [PubMed] [Google Scholar]
- 68.Chen B, et al. Dynamic Imaging of Genomic Loci in Living Human Cells by an Optimized CRISPR/Cas System. 2013;155:1479–1491. doi: 10.1016/j.cell.2013.12.001. [DOI] [PMC free article] [PubMed] [Google Scholar]
- 69.Hagège H, et al. Quantitative analysis of chromosome conformation capture assays (3C-qPCR) Nat Protoc. 2007;2:1722–1733. doi: 10.1038/nprot.2007.243. [DOI] [PubMed] [Google Scholar]
- 70.Cordelieres FP, Bolte S. JACoP v2. 0: improving the user experience with co-localization studies. 2008 [Google Scholar]
- 71.Nadadur RD, et al. Pitx2 modulates a Tbx5-dependent gene regulatory network to maintain atrial rhythm. Science Translational Medicine. 2016;8:354ra115–354ra115. doi: 10.1126/scitranslmed.aaf4891. [DOI] [PMC free article] [PubMed] [Google Scholar]
- 72.Hattori T, et al. Antigen clasping by two antigen-binding sites of an exceptionally specific antibody for histone methylation. Proc Natl Acad Sci USA. 2016;113:2092–2097. doi: 10.1073/pnas.1522691113. [DOI] [PMC free article] [PubMed] [Google Scholar]
- 73.Rohland N, Reich D. Cost-effective, high-throughput DNA sequencing libraries for multiplexed target capture. Genome Res. 2012;22:939–946. doi: 10.1101/gr.128124.111. [DOI] [PMC free article] [PubMed] [Google Scholar]
Associated Data
This section collects any data citations, data availability statements, or supplementary materials included in this article.