

Six crystal structures of serum albumins, caprine (two forms), ovine (two forms) and their complexes with 3,5-diiodosalicylic acid (DIS), have been determined at resolutions in the range 1.78–2.55 Å. Comparison with homologous complexes of bovine, equine and human serum albumins shows surprising differences in their DIS-binding properties.
Keywords: crystal structure; ovine serum albumin; caprine serum albumin; 3,5-diiodosalicylic acid binding sites; structure comparison
Abstract
Serum albumin (SA) is the most abundant protein in plasma and is the main transporter of molecules in the circulatory system of all vertebrates, with applications in medicine, the pharmaceutical industry and molecular biology. It is known that albumins from different organisms vary in sequence; thus, it is important to know the impact of the amino-acid sequence on the three-dimensional structure and ligand-binding properties. Here, crystal structures of ovine (OSA) and caprine (CSA) serum albumins, isolated from sheep and goat blood, are described, as well those of their complexes with 3,5-diiodosalicylic acid (DIS): OSA–DIS (2.20 Å resolution) and CSA–DIS (1.78 Å resolution). The ligand-free OSA structure was determined in the trigonal space group P3221 at 2.30 Å resolution, while that of CSA in the orthorhombic space group P212121 was determined at 1.94 Å resolution. Both albumins are also capable of crystallizing in the triclinic space group P1, giving isostructural crystals that diffract to around 2.5 Å resolution. A comparison of OSA and CSA with the closely related bovine serum albumin (BSA) shows both similarities and differences in the distribution of DIS binding sites. The investigated serum albumins from domesticated ruminants in their complexes with DIS are also compared with the analogous structures of equine and human serum albumins (ESA–DIS and HSA–DIS). Surprisingly, despite 98% sequence similarity, OSA binds only two molecules of DIS, whereas CSA binds six molecules of this ligand. Moreover, the binding of DIS to OSA and CSA introduced changes in the overall architecture of the proteins, causing not only different conformations of the amino-acid side chains in the binding pockets, but also a significant shift of the whole helices, changing the volume of the binding cavities.
1. Introduction
Serum albumin is a transport protein that constitutes up to 60% of the blood proteins in mammals. It is synthesized in the liver, and its half-life in the circulatory system reaches 19 d. This protein is readily soluble in water and has the ability to bind a number of molecules, such as fatty acids, hormones, metabolites and drugs (Sułkowska, 2002 ▸; Ghuman et al., 2005 ▸). Albumins can also carry metal cations (Ca2+, Na+ and K+), as well as bind toxins and harmful metabolites and transport them to the secretory system (Carter & Ho, 1994 ▸). Because of its high concentration, serum albumin is responsible for maintaining the oncotic pressure in the blood vessels (Peters, 1996 ▸).
Serum albumins are used in the pharmaceutical industry for testing the affinity of drugs, and they can also be used as therapeutic agents (Alexander et al., 1979 ▸; Sohl & Splittgerber, 1991 ▸; Hastings & Wolf, 1992 ▸). They are applied in many laboratory procedures as molecular-weight standards (Sinibaldi et al., 2008 ▸) or as reagents in immunological tests (Hertzog et al., 1983 ▸; Leong et al., 1988 ▸). Albumins are used as stabilizers of TBE vaccine (Marth & Kleinhappl, 2001 ▸) and enzyme solutions, as ingredients of culture media (Yamane et al., 1975 ▸) and as active components of chromatographic columns (Li et al., 2013 ▸). The most commonly used albumin is bovine serum albumin (BSA). Serum albumins can be allergens in meat obtained from even-toed ungulates (Artiodactyla), which are the main source of meat products in many countries (Fiocchi et al., 1995 ▸; Asero et al., 2010 ▸). The evolutionarily closest serum albumins in this group are bovine (BSA), ovine (OSA) and caprine (CSA). Monoclonal antibodies for BSA also recognize and bind to OSA, which shows that these two proteins must have similar epitopes (Restani et al., 2004 ▸; Beretta et al., 2011 ▸). Determination of the crystal structures of OSA and CSA allows a comparison of their outer surfaces and, in turn, can provide insight into their cross-reactivity. It is essential to know the structures of albumins from different vertebrates in order to understand the mechanisms of ligand binding and antibody recognition.
Mammalian serum albumins are three-domain helical proteins which are stabilized by 17 disulfide bridges. The overall architecture of each domain is similar because the vertebrate albumins are a result of gene triplication (Harper & Dugaiczyk, 1983 ▸; Doolittle, 1992 ▸). Each domain consists of two subdomains, A and B, containing six helices and four helices, respectively, which have different affinities for various ligands (Kragh-Hansen et al., 2002 ▸). Previous structural studies of bovine, equine and leporine serum albumins have shown that these proteins exhibit different electrostatic potentials on the surface and demonstrate different ligand-binding abilities (Bujacz, 2012 ▸; Bujacz et al., 2014 ▸).
Here, we describe the first three-dimensional structures of ovine and caprine serum albumins (OSA and CSA, respectively) and their complexes with 3,5-diiodosalicylic acid (DIS) (OSA–DIS and CSA–DIS). The chosen ligand has applications in parasitology (Srivastava & Sharma, 1990 ▸; Garner et al., 2011 ▸) and has been shown to be a powerful agent against the formation of transthyretin amyloid (PDB entry 3b56; Gales et al., 2008 ▸). DIS is also an inhibitor of endothelins (ETs), which are potent vasoconstrictor peptides that participate in the pathogenesis of various cardiovascular disorders (Ahmed et al., 2008 ▸). Salicylic acid derivatives prevent the binding of endothelin-1 (ET-1) to ETA receptors. The most active compounds are 3,5-dibromosalicylic acid (K i = 0.5 mM) and 3,5-diiodosalicylic acid (K i = 0.3 mM), which are about 50 times more potent than aspirin (Blandin et al., 2000 ▸). The presented crystal structures of OSA–DIS and CSA–DIS, together with the previously published structural results for analogous serum albumin complexes of bovine SA (BSA) and equine SA (ESA) (PDB entries 4jk4 and 4j2v; Sekula et al., 2013 ▸), deliver a broader view of the binding abilities of serum albumins from different organisms, especially in comparison with a human serum albumin (HSA) analogue (PDB entry 2bxl; Carter & Ho, 1994 ▸; Ghuman et al., 2005 ▸).
2. Materials and methods
2.1. Materials
The ovine and caprine serum albumins were purchased from Sigma–Aldrich (St Louis, Missouri, USA) and Equitech-Bio Inc. (Kerrville, Texas, USA), respectively, as lyophilized powders. The 3,5-diiodosalicylic acid and buffer components for albumin purification were obtained from Sigma–Aldrich (St Louis, Missouri, USA). A benchtop pH meter (Hanna, London, England) was used for pH adjustment of the buffers.
Both OSA and CSA were defatted on activated carbon and purified on an ÄKTA FPLC (Amersham Biosciences, Uppsala, Sweden) according to the procedure previously used for other serum albumins (Bujacz, 2012 ▸). The fractions containing monomers of each protein were concentrated to 40–90 mg ml−1 (OSA) and 80–120 mg ml−1 (CSA) with Vivaspin filters (Sartorius, Göttingen, Germany) using a centrifuge (Eppendorf, Hamburg, Germany). The protein concentration was measured using a NanoDrop UV–Vis spectrophotometer (Thermo Scientific, Wilmington, USA).
The microscale thermophoresis (MST) experiment was performed on a Monolith NT.LabelFree apparatus and Standard Treated Capillaries were used (NanoTemper Technologies, Munich, Germany).
Crystallization plates as well as reagents (crystal screens, Additive Screen, Tacsimate pH 7.0, Jeffamine ED-2001 and PPG 400) were purchased from Hampton Research (Aliso Viejo, California, USA).
2.2. Methods
2.2.1. Crystallization of OSA and CSA, and preparation of their complexes with DIS
Ovine and caprine serum albumins were crystallized using the hanging-drop vapour-diffusion technique. Both proteins crystallize in a triclinic form; additionally, OSA crystallizes in a trigonal space group and CSA in an orthorhombic space group.
The initial crystals of OSA were obtained in the form of long, thin needles in various conditions containing Tacsimate from Index Screen (Hampton Research). The shape and size of these crystals were unfavourable for a diffraction experiment; thus, crystallization conditions were optimized using Additive Screen (Hampton Research). Crystals with better morphology appeared in two drops, one containing hexanediol and the other with PPG 400 as an additive. It is noteworthy that optimization of the crystallization conditions by slightly altering the composition of the reservoir solution did not produce thicker crystals. The addition of 4–6% PPG 400 to the protein solution before setting up crystallization improved the quality of the resulting crystals.
CSA crystallized in the presence of Jeffamine ED-2001 pH 7.0 as the main precipitating agent as one large crystal (P212121) with undeveloped edges. From a number of tested additives, only the addition of barium chloride improved the crystal morphology. Further optimization of the crystallization conditions resulted in the best crystals (rhomboid prisms) in the presence of 30% Jeffamine ED-2001 pH 7.0, 0.1 M sodium citrate buffer pH 5.0 with the addition of 0.01 M barium chloride dihydrate.
Crystals of both proteins also grew in the form of clusters of plates in a crystallization solution consisting of 20–25% PEG 3350, 0.2–0.4 M ammonium chloride, 0.1 M HEPES pH 7.5. These plates were hard to separate, but their morphology was improved with the help of Additive Screen, with the addition of 0.5 M proline or NDSB221 yielding the best results. Further optimization of the crystallization conditions produced diffraction-quality crystals of OSA in 20% PEG 3350, 0.2 M ammonium chloride, 0.1 M proline and of CSA in 24% PEG 1500, 0.2 M proline in 0.1 M HEPES pH 7.5. Crystals of both albumins are triclinic and almost fully isomorphous (Table 1 ▸).
Table 1. Diffraction data-collection and refinement statistics.
Values in parentheses are for the last resolution shell.
| OSA | OSA–DIS | OSA | CSA | CSA–DIS | CSA | |
|---|---|---|---|---|---|---|
| PDB code | 4luf | 4luh | 5orf | 5ori | 5osw | 5otb |
| Space group | P3221 | P3221 | P1 | P212121 | P212121 | P1 |
| Unit-cell parameters | ||||||
| a (Å) | 118.4 | 118.5 | 77.8 | 42.4 | 42.4 | 78.8 |
| b (Å) | 118.4 | 118.5 | 78.0 | 67.4 | 66.1 | 80.9 |
| c (Å) | 120.8 | 120.6 | 109.7 | 214.0 | 213.6 | 110.5 |
| α (°) | 90.0 | 90.0 | 89.8 | 90.0 | 90.0 | 90.0 |
| β (°) | 90.0 | 90.0 | 74.6 | 90.0 | 90.0 | 75.9 |
| γ (°) | 120 | 120 | 73.2 | 90.0 | 90.0 | 72.2 |
| Molecules in asymmetric unit | 1 | 1 | 4 | 1 | 1 | 4 |
| V M (Å3 Da−1) | 3.68 | 3.68 | 2.46 | 2.27 | 2.25 | 2.44 |
| Data collection | ||||||
| Temperature (K) | 100 | 100 | 100 | 100 | 100 | 100 |
| Radiation source | BL14.2, BESSY | BL14.2, BESSY | PX13, PETRA | BL14.2, BESSY | BL14.2, BESSY | BL14.2, BESSY |
| Wavelength (Å) | 0.9184 | 0.9184 | 0.9184 | 0.9184 | 0.9184 | 0.9184 |
| Resolution range (Å) | 50.0–2.30 (2.40–2.30) | 50.0–2.20 (2.30–2.20) | 50.0–2.54 (2.64–2.54) | 50.0–1.94 (2.04–1.94) | 50.0–1.78 (1.88–1.78) | 50.0–2.50 (2.60–2.50) |
| Mosaicity (°) | 0.22 | 0.22 | 0.27 | 0.34 | 0.25 | 0.57 |
| R merge † (%) | 9.7 (90.4) | 9.9 (84.3) | 9.2 (69.4) | 5.6 (80.4) | 5.9 (95.1) | 5.9 (70.3) |
| Completeness (%) | 99.4 (99.8) | 100.0 (100.0) | 90.1 (87.5) | 98.7 (93.2) | 98.7 (95.4) | 98.1 (95.0) |
| Multiplicity | 3.68 (3.73) | 7.44 (7.55) | 3.64 (3.47) | 5.17 (4.38) | 7.12 (6.65) | 3.15 (3.11) |
| 〈I〉/〈σ(I)〉 | 12.04 (2.0) | 14.91 (2.96) | 11.36 (2.09) | 18.77 (2.02) | 20.16 (2.30) | 12.97 (1.98) |
| Refinement | ||||||
| R/R free ‡ (%) | 17.59/21.24 | 17.09/20.89 | 19.56/25.76 | 18.85/24.83 | 17.87/24.08 | 19.75/24.60 |
| No. of atoms | ||||||
| Protein | 4663 | 4653 | 18584 | 4673 | 4658 | 18517 |
| Water | 191 | 210 | 387 | 295 | 494 | 482 |
| Ligand | 105 | 129 | 162 | 0 | 104 | 132 |
| R.m.s.d. | ||||||
| Bond lengths (Å) | 0.018 | 0.019 | 0.020 | 0.020 | 0.019 | 0.019 |
| Bond angles (°) | 2.14 | 2.17 | 2.12 | 2.04 | 1.93 | 2.15 |
| 〈B〉 (Å2) | 47.65 | 44.44 | 54.3 | 50.09 | 41.86 | 64.67 |
| Ramachandran plot (%) | ||||||
| Most favoured regions | 94.2 | 94.2 | 91.8 | 95.0 | 96.7 | 92.1 |
| Allowed regions | 5.8 | 5.8 | 8.1 | 5.0 | 3.3 | 7.9 |
R
merge = 
 , where I
i(hkl) is the intensity of observation i of reflection hkl.
, where I
i(hkl) is the intensity of observation i of reflection hkl.
R = 
 for all reflections, where F
obs and F
calc are observed and calculated structure factors, respectively. R
free is calculated analogously for the test reflections, which were randomly selected and excluded from refinement.
for all reflections, where F
obs and F
calc are observed and calculated structure factors, respectively. R
free is calculated analogously for the test reflections, which were randomly selected and excluded from refinement.
Co-crystallization of OSA and CSA with 3,5-diiodosalicylic acid was not successful, and the OSA–DIS and CSA–DIS complexes were obtained from crystals of the native albumins soaked in the ligand dissolved in mother liquor from crystallization drops. The DIS ligand was used in a ten-molar excess with respect to albumin concentration, and this new drop was incubated for 24 h at room temperature.
Serum albumins, with the exception of ESA, are not easy to crystallize. By crystallizing a number of serum albumins, we have found that Tacsimate helps in starting the nucleation process and provides monocrystals with good morphology. This precipitating agent is composed of a mixture of salts of carboxylic acids (Larson et al., 2007 ▸; McPherson, 2001 ▸). These compounds have high affinity for the binding pockets of albumins, but can be easily displaced by other ligands. In all presented structures a number of crystallization buffer components were found, among them polyethylene glycol and Jeffamine fragments, proline and carboxylic anions from Tacsimate.
2.2.2. Data collection, structure determination and refinement
X-ray diffraction data from crystals of OSA, CSA and their complexes with DIS were collected at 100 K on the BL14.2 beamline at the BESSY synchrotron, Berlin, Germany (Mueller et al., 2012 ▸) and at PETRA III at EMBL, Hamburg, Germany. The diffraction data for the trigonal OSA crystal and its complex with DIS were processed to resolutions of 2.30 and 2.20 Å, respectively, while orthorhombic CSA crystals of the native form and in complex with DIS diffracted to resolutions of 1.94 and 1.78 Å, respectively (Table 1 ▸). Triclinic crystals of native OSA (2.55 Å resolution) and CSA (2.51 Å resolution) were cryoprotected prior to the diffraction experiment using a solution composed of 50%(v/v) PEG 400 and the reservoir (in a 1:1 ratio). For trigonal crystals of OSA crystallized from 70% Tacsimate and 4% PPG 400, as well as for orthorhombic crystals of CSA, no additional cryoprotection was required because the crystallization buffers had cryoprotective properties (Bujacz et al., 2010 ▸). These crystals were fished out from the crystallization drops and directly flash-cooled in the nitrogen cryogenic stream. It is notable that the statistics of data processing were better for the albumins complexed with DIS than for the native proteins; thus, we can conclude that ligand binding stabilized the molecules in the crystal lattice and consequently improved the diffraction quality.
All diffraction data were processed with XDS (Kabsch, 2010 ▸). The needle-like crystals of OSA and OSA–DIS in the trigonal space group P3221, as well as the rectangular crystals of CSA and CSA–DIS in the orthorhombic space group P212121, contained a single protein molecule in the asymmetric unit. The triclinic crystals of OSA and CSA contained four molecules in the asymmetric unit.
The trigonal form of OSA was solved by molecular replacement in Phaser (McCoy et al., 2007 ▸) using the ligand-free BSA structure (PDB entry 4f5u; Bujacz, 2012 ▸) as a model. To solve the structure of the orthorhombic crystals of CSA Phaser was used with the OSA structure (PDB entry 4luf) as a model. The structures of the OSA–DIS (P3221) and CSA–DIS (P212121) complexes were solved by the rigid-body procedure in REFMAC5, using the native structures as phasing models (Murshudov et al., 2011 ▸). Both triclinic forms were solved in MOLREP (Vagin & Teplyakov, 2010 ▸), using the structures solved in higher symmetry crystals as models.
To determine the positions of the I atoms, the diffraction data from both complexes were additionally processed and scaled while keeping the Friedel pairs unmerged in HKL-2000 (Otwinowski & Minor, 1997 ▸), and the anomalous signal of the I atoms (f′′ = 2.85 e at the experimental wavelength) was used (Abendroth et al., 2011 ▸) to calculate maps using the CAD and FFT programs. To check the influence of radiation damage in both complexes, the diffraction data were divided into halves and processed by XDS while keeping Friedel pairs separate. The anomalous difference electron-density map was calculated using the ANODE program (Thorn & Sheldrick, 2011 ▸) to prove the positions of the I atoms in DIS molecules in all binding sites. The similar height of peaks in the anomalous map for both subsets of data shows that radiation damage to the C—I bond is negligible. All structures were refined with REFMAC5 (Murshudov et al., 1997 ▸, 2011 ▸) from the CCP4 package (Winn et al., 2011 ▸) and rebuilt in Coot (Emsley et al., 2010 ▸). The ligand libraries for the DIS, PPG, PEG and JEF fragments were created using Sketcher (Potterton et al., 2004 ▸) from the CCP4 suite. The quality of the final models was checked with MolProbity (Chen et al., 2010 ▸). A summary of data-collection and refinement statistics is given in Table 1 ▸.
2.2.3. Affinity of DIS for OSA, CSA and BSA: microscale thermophoresis (MST)
Quantitative analysis using microscale thermophoresis (MST; Seidel et al., 2012 ▸) was performed in three independent experiments, and provided overall association constants for the binding of DIS to BSA, OSA and CSA. The optimized MST buffer consisted of 50 mM Tris–HCl pH 7.4, 150 mM NaCl, 10 mM MgCl2, 0.05% Tween 20, 2.5% ethanol. The tryptophan residue in the protein was the source for the detection of intrinsic fluorescence. The concentration of the fluorescent molecule (albumin) was kept constant and the concentration of the binding partner (DIS) was decreased. Analysis was performed for 16 samples of each protein, BSA (3 µM), OSA (1 µM) and CSA (2 µM), with different ligand concentrations. Solutions of DIS were prepared by 15 steps of serial dilution starting from an initial ligand concentration of 500 µM. After a short incubation, 4 µl of the respective samples were placed in MST capillaries and sealed with wax. An IR laser was used to create a local microscopic temperature gradient in the capillary. Simultaneously, changes in fluorescence intensity owing to the motion of the labelled molecules in the glass capillaries were observed. Measurements were carried out at three different points of the capillary with 60% UV-LED setting and 20% IR-laser power for BSA, 45% UV-LED setting and 20% IR-laser power for OSA, and 60% UV-LED setting and 80% IR-laser power for CSA.
3. Results and discussion
3.1. Sequence, structure and surface comparison among selected albumins
The architecture of ovine and caprine serum albumins (Fig. 1 ▸) generally consists of the same helical fold as previously reported for four other albumins: human (Carter & Ho, 1994 ▸), bovine, equine and leporine (Bujacz, 2012 ▸). An important aspect of investigating the properties of serum albumins is to determine their ability to bind small and large molecules, which also involves studies of their immunogenicity. Such studies have been ongoing for quite a long time. Albumins have both sequential and conformational epitopes, with a few dominant ones. Characterization of these dominant epitopes allows the cross-immunoreactivity of various albumins to be predicted (Restani et al., 2004 ▸; Beretta et al., 2011 ▸). Owing to the mostly helical and specific architecture of albumins, they are partially resistant to denaturating conditions. BSA, which is the closest analogue of OSA and CSA, still retains the sequential epitopes if digested in vitro by pepsin for 60 min with an excess of the enzyme. Similarly, denaturating conditions (SDS) or reducing conditions do not cause their total destruction (Pickles et al., 2014 ▸). The differences in immunogenicity between mammalian serum albumins result from sequential differences that influence the charge distribution on their surfaces. The most widely available commercial monoclonal antibody against BSA reacts strongly with OSA and CSA (Beretta et al., 2011 ▸); thus, obtaining an antibody that selectively interacts with only a particular albumin will be beneficial for many immunological procedures.
Figure 1.

Binding sites of DIS (violet spheres) in structures of SAs in complex with DIS: OSA, orange (PDB entry 4luh); CSA, olive (PDB entry 5osw); BSA, light pink (PDB entry 4jk4); ESA, light blue (PDB entry 4j2v); HSA, yellow (PDB entry 2bxl; Ghuman et al., 2005 ▸).
3.1.1. Comparison of the amino-acid sequences of the albumins from domesticated even-toed ungulates
As all ruminants, sheep and goats are members of the order Artiodactyla, the even-toed ungulates, it is not surprising that the primary structures of their serum albumins are similar. The amino-acid sequence of OSA is 98.5 and 92% identical and 99 and 96% similar to those of CSA and BSA, respectively (Fig. 2 ▸). Alignment of the primary structures of OSA, CSA and BSA, performed by Clustal W (Larkin et al., 2007 ▸; Goujon et al., 2010 ▸) and ClustalOmega (Sievers et al., 2011 ▸; McWilliam et al., 2013 ▸), shows higher sequence identity/similarity between OSA and CSA in comparison to BSA. All structurally characterized ruminant albumins have an additional tryptophan at position 134 in comparison to HSA, which has only one evolutionarily conserved tryptophan residue at position 213. Besides the additional Trp134, the investigated serum albumins vary in their content of methionine residues. Four methionine residues are present in ovine, caprine and bovine serum albumins, whereas only one is found in leporine serum albumin and none are found in equine serum albumin. Surprisingly, the sera of birds and some fishes have more than 15 methionine residues and do not contain any tryptophan residues. OSA, CSA and BSA are two residues shorter than HSA, which has one additional valine residue at position 116 and a C-terminal Leu585. Their sequences exhibit 75.0, 74.8 and 75.8% identity to HSA, respectively.
Figure 2.

Sequence alignment of OSA, CSA and BSA. The numbering corresponds to the mature albumins. The residues creating DIS binding sites in OSA (PDB entry 4luh), CSA (PDB entry 5ori) and BSA (PDB entry 4jk4) are marked in violet. The conserved cysteine residues are marked in yellow. Amino acids that differ in all three albumins are marked in red, positions with single similar mutations are marked in orange and those in green are substitutions connected additionally with a different character. The bars over the sequence represent helices. The domains are coloured as follows: domain I, green; domain II, orange; domain III, brown. Divisions between subdomains are marked by dots.
3.1.2. Comparison of the three-dimensional structures of ovine, caprine and bovine serum albumins
Among albumins with previously known structures, BSA is most similar in sequence to OSA. Therefore, the crystal structure of BSA was chosen as the search model for determination of the OSA structure using the molecular-replacement method. The overall fold of OSA and CSA is similar to that of BSA, as estimated based on the r.m.s.d. values calculated for Cα atoms (1.44 Å for OSA and 1.33 Å for CSA), while the r.m.s.d. between OSA and CSA is 1.27 Å (calculated for Cα atoms aligned in the SSM subprogram of Coot; Emsley et al., 2010 ▸). When domains I, II and III of OSA and CSA were superposed with the corresponding domains of BSA, the highest similarity was observed for domain I of BSA and OSA, and for domain II of BSA and CSA, while the lowest r.m.s.d. for domain II is between BSA and OSA, and that for domain I is between BSA and CSA (Table 2 ▸). Sequence similarity in the compared albumins is high, yet the flexibility of their domains causes the relatively high r.m.s.d. values of the aligned structures.
Table 2. Comparison of structures and sequences among the domains of ovine, caprine and bovine serum albumin.
| R.m.s.d. (Å)/sequence identity (%) | |||
|---|---|---|---|
| Domains | OSA–CSA | OSA–BSA | CSA–BSA |
| I–I | 0.99/98.45 | 0.76/93.26 | 0.84/94.30 |
| II–II | 1.19/98.95 | 1.29/92.15 | 0.73/92.15 |
| III–III | 1.00/97.99 | 1.25/90.95 | 1.07/ 9.95 |
After gene triplication domains I–III probably had identical sequences and structures, but during the evolutionary process they differentiated both sequentially and structurally (Doolittle, 1992 ▸). Comparisons of the sequences of the structural domains show that analogous domains of BSA, CSA and OSA are more similar between different species than are the individual domains within single species (Tables 2 ▸ and 3 ▸).
Table 3. Comparison of structures and sequences within the domains of ovine, caprine and bovine serum albumin.
| R.m.s.d. (Å)/sequence identity (%) | |||
|---|---|---|---|
| Domains | OSA–OSA | CSA–CSA | BSA–BSA |
| I–II | 2.60/23.7 | 2.48/23.1 | 2.50/24.2 |
| I–III | 2.86/19.9 | 2.60/17.8 | 2.42/17.7 |
| II–III | 3.0/17.5 | 2.57/20.0 | 2.86/20.9 |
3.1.3. Comparison of the protein surface potential of OSA, CSA and BSA
The Poisson–Boltzmann electrostatic potential on the molecular surfaces of OSA, CSA and BSA was calculated using the APBS algorithm (Baker et al., 2001 ▸) and the PDB2PQR program (Dolinsky et al., 2004 ▸, 2007 ▸). Calculations were performed for pH 7.4, because this is the average pH of mammalian blood (Skogen et al., 1977 ▸). Proper side-chain protonation states were determined in PropKa (Rostkowski et al., 2011 ▸).
The overall calculated electrostatic potentials of the OSA, CSA and BSA surfaces are similar; however, a number of differences could be noticed. Two views of each molecule rotated 180° around the vertical axis are shown in Fig. 3 ▸. The surface charge of the compared molecules is predominantly negative. Domains I and II in particular are almost totally negatively charged, with a few exceptions. One of these is domain II of CSA, which contains several small positively charged patches. Hydrophobic and positively charged areas are also located in domain I of OSA close to the fatty acid-binding site 1 (FA1), but are not observed in CSA and BSA. Finally, the interface between domains I and III has a different charge pattern in each of the compared albumins. The positively charged area at the entrance to the central cavity of drug site 1 is largest in OSA, is a little smaller in BSA and is smallest in CSA. The surface charge of domain III is variable among OSA, CSA and BSA. This domain is significantly less negatively charged than domains I and II and contains a number of hydrophobic and positively charged regions.
Figure 3.

Electrostatic surface potential (K B T/e c) of serum albumins: OSA (a, b), CSA (c, d) and BSA (e, f). The left panels (a, c, e) show molecules in the orientation with domain I on the left and the domains arranged counterclockwise, whereas in the right panels (b, d, f), which are rotated 180°, domain I is on the right and the domains are arranged clockwise.
3.1.4. Comparison of the ligand-binding properties of OSA, CSA and BSA
The dissociation constant of complexes of serum albumin with ligands is usually calculated for the whole molecule, without considering individual binding pockets. An advantage of MST is the qualitative analysis, which provides information about the number of binding sites on the protein surface. The results of the performed MST experiment indicated that OSA and BSA contain two and three well defined binding sites, respectively, with different affinities for DIS, whereas CSA shows one dominant location for DIS and several sites with lower affinity for this ligand.
The result of a single MST measurement is represented by curves showing the gradual saturation process of albumin binding pockets by the ligand (Fig. 4 ▸). Each peak observed on the curve corresponds to the saturation of one binding site by a DIS molecule.
Figure 4.

MST binding studies of DIS to OSA, CSA and BSA. Yellow asterisks correspond to measurement points for OSA, blue asterisks for CSA and green squares for BSA.
Two binding positions for OSA correspond to the DIS1 and DIS2 binding sites in the OSA–DIS crystal structure. In the case of BSA, three peaks are visible; however, four ligand molecules are bound in the BSA–DIS crystal structure. The measurement curve for BSA does not depict one binding site, probably owing to its lowest affinity for DIS. The crystal structure of CSA–DIS has four well defined ligand locations and two sites at which the DIS molecule has lower occupancy.
3.2. Binding sites for 3,5-diiodosalicylic acid in the OSA–DIS and CSA–DIS complexes
The mF o − DF c maps contoured at the 3σ level clearly showed positive electron density (Fig. 5 ▸) corresponding to 3,5-diiodosalicylic acid molecules bound to two sites in the OSA–DIS complex and six sites in the CSA–DIS complex. Both DIS molecules occupy the large drug site 1 (DS1; Sudlow et al., 1976 ▸) cavity in OSA, which corresponds to the equivalent pocket in the BSA–DIS and CSA–DIS complexes.
Figure 5.

Electron-density maps for the DIS3 molecule in the CSA structure: (a) initial F o − F c map after initial refinement, contoured at 2.5σ, (b) F o − F c OMIT map, contoured at 3.0σ, and (c) F o − F c map, contoured at 1.2σ.
3.2.1. DIS1 and DIS2 binding sites in OSA and CSA
The DIS1 molecule, which is located in the main part of DS1 in both the OSA–DIS and CSA–DIS structures, interacts with a number of amino-acid residues forming this pocket. The α-helices surrounding the ligand comprise many polar residues, which form mostly electrostatic contacts and only one hydrophobic interaction. Among the polar contacts, hydrogen and halogen bonds are present (Parisini et al., 2011 ▸) between ligand and amino-acid residues in this pocket (Fig. 6 ▸ a, Supplementary Table S1). The I atom 3′I of DIS1 in the OSA–DIS complex is coordinated by three polar contacts with the side-chain NH1 atom of Arg217, NE of Lys221 and the main-chain carbonyl O atom of Ile289. The other iodine, 5′I, interacts with the hydroxyl group of Ser286, the main-chain N atom of Ala260 and the carbonyl O atom of Arg256. The carboxyl group of DIS1 forms hydrogen bonds to the hydroxyl group of Tyr149, NE2 of the His241 imidazole ring and to two N atoms, NE and NH2, of Arg256. The hydroxyl group of DIS1 interacts with the NH1 and NH2 atoms of Arg217. In the CSA–DIS complex the same residues interact with the DIS1 molecule, and only the distances of the hydrogen bonds are slightly different (Fig. 6 ▸ c, Supplementary Table S1).
Figure 6.

Hydrogen and halogen interactions (including weak contacts) of DIS1 and DIS2 in the OSA–DIS (a, b) and CSA–DIS (c, d) complexes (in Å). Details of interactions are listed in Supplementary Table S1.
The DIS1 molecule is present at the same site in all compared albumin–DIS complexes and has the same orientation (Fig. 7 ▸). A minor difference is that in ruminant albumins the carboxyl moiety of the DIS1 ligand is rotated anticlockwise by about 40° compared with DIS1 in ESA–DIS and HSA–DIS. In addition, the contact of the DIS1 I3′ and hydroxyl group with Arg217 is not maintained in ESA–DIS and HSA–DIS owing to a different conformation of this residue in these structures. Furthermore, the contacts between I3′ and Lys221 are maintained in all investigated ruminant serum albumin complexes, although the length of this halogen bond is different. Although this residue is conserved in all of the compared albumins, it is not involved in a contact with DIS1 in ESA (Sekula et al., 2013 ▸).
Figure 7.
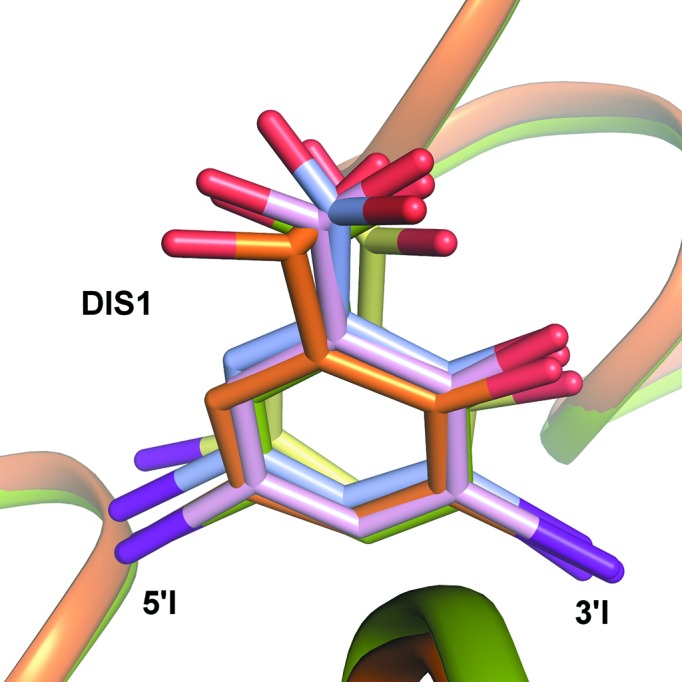
Comparison of the DIS1 binding site in OSA (orange), CSA (olive), BSA (green), ESA (light blue) and HSA (light pink).
The second binding site, DIS2, which is located in the elongated part of DS1 (Figs. 6 ▸ b and 6 ▸ d), is present in the OSA, CSA and BSA complexes, and the interactions with the ligands are almost the same. The DIS2 molecule interacts by π-stacking with the indole ring of Trp213, which has the same orientation in all three even-toed ungulate serum albumin–DIS complexes. Additionally, in OSA–DIS the N atom of the Trp213 indole ring forms polar contacts with both I atoms of DIS2. I3′ also interacts with the main-chain carbonyl O atom and the side-chain OD1 of Asp450 and, in CSA–DIS, with the hydroxyl group of Ser453. Two other contacts are formed by I5′ with the hydroxyl group of Ser201 and with the main-chain carbonyl O atom of Leu197. The carboxyl group of DIS2 interacts via hydrogen bonds with two side-chain N atoms (NE and NH2) of Arg198 and creates a weak polar contact with NH2 of Arg217. The only noticeable difference in the DIS2 binding site in the OSA–DIS, CSA–DIS and BSA–DIS complexes is an additional contact in BSA–DIS between a guanidine N atom of Arg194 and the hydroxyl group of DIS2. The NE atom of Arg194 in the OSA–DIS complex creates a hydrogen bond (3.0 Å) to a water molecule, which at the same time serves as a hydrogen-bond donor to the hydroxyl group and I3′ of DIS2, with hydrogen-bond lengths of 2.4 and 3.5 Å, respectively. Three arginine residues, Arg194, Arg198 and Arg217, that are present in the DS1 pocket in the investigated albumins are responsible for delocalization of the positive charge in this cavity, which allows the binding of two molecules of the DIS ligand possessing two negatively charged carboxylic groups (Fig. 6 ▸ c). In HSA and ESA the first two arginine residues listed above are replaced by lysine residues, and additionally Arg217 is bent outside this pocket, resulting in a differently distributed positive charge that is not sufficient for the binding of a second DIS molecule in this pocket.
It is worth noting that Trp213 has a different conformation in native CSA in comparison to its complex with DIS. The indole-ring rotation of about 180° around the Cβ—Cγ bond allows a π-stacking interaction with the DIS molecule. This change provides evidence that the binding pockets in albumins can adopt a favourable conformation of amino-acid side chains to accommodate particular kinds of ligands.
3.2.2. DIS3–DIS6 binding sites in CSA
In the CSA–DIS complex, besides the two common binding positions for a DIS molecule (DIS1 and DIS2) in ruminant albumins, four additional locations for binding of this ligand are observed. DIS3 is localized in drug site 2 (DS2; Sudlow et al., 1976 ▸), DIS4 in fatty acid-binding site 1 (FA1; Curry et al., 1998 ▸; Bhattacharya et al., 2000 ▸), and DIS5 and DIS6 in niches on the surfaces of domains I and III, respectively.
The carboxyl group of DIS3 (Fig. 8 ▸ a) creates hydrogen bonds in DS2 to NH2 of Arg409 and to the hydroxyl group of Ser488. The hydroxyl group of DIS3 interacts with ND2 and OD1 of Asn390. The I atoms create numerous electrostatic interactions; I5′ interacts with all of the N atoms of the guanidine moiety of Arg484, the OE1 and OE2 atoms of Glu449, the OG1 atom of Thr448 and the main-chain O atom of Pro383. I3′ is stabilized mostly by weak contacts with surrounding amino acids in this pocket: Ile387, Cys391 and Cys437. Although this pocket is created by the same amino acids in all three ruminant albumins, only CSA and BSA bind DIS3, whereas components of the crystallization solution were bound in the OSA–DIS complex. This pocket varies in ESA only by one amino acid, Ser448 instead of Thr448, but this did not disturb the binding of DIS3 in the same orientation as in BSA–DIS and CSA–DIS. The volume of this pocket is expanded in HSA in comparison to the other albumins described in this work, and the pocket is occupied by myristic acid (Ghuman et al., 2005 ▸).
Figure 8.

Interactions of DIS molecules with CSA. (a) DIS3 in DS2, (b) DIS4 in FA1, (c) DIS5 in FA5 and (d) DIS6 on the surface of domain I (in Å). Details of the interactions are listed in Supplementary Table S1.
The fourth ligand molecule, DIS4 (Fig. 8 ▸ b), is bound in the FA1 pocket and assumes two conformations. There are only a few interactions between the DIS4 conformation with higher occupancy and the amino acids in this pocket. I3′ creates a halogen bond to the SD atom of Met184, and additionally interacts with the hydroxyl group of Tyr137, the main-chain O atom of Ile181 and the main-chain N atom of Arg185. The second I atom interacts with the hydroxyl group of Tyr160 and with the main-chain O atom of Pro117. In BSA, DIS4 was bound with a similar orientation as in CSA. The ligand in the ESA–DIS complex is rotated by 90° (Sekula et al., 2013 ▸) in comparison to BSA and CSA, which is a result of the presence of some different residues in this pocket. The first of these is the substitution of Met184 by Leu184, which precludes any interaction with I3′ and repels the ligand molecule. The second change, Leu122 to Gln122, shifts the ligand further by creating a hydrogen bond to its carboxyl group. No ligand was bound in this location in OSA and HSA.
DIS5 (Fig. 8 ▸ c) is bound with fractional occupancy on the CSA surface between subdomains IIIA and IIIB, and creates only a few interactions. The carboxyl group of DIS5 creates a halogen bond to ND1 of His397. I3′ interacts with the main-chain O and main-chain N atoms of Leu543 and Lys544, respectively. I5′ is coordinated by OD1 and OD2 of Asp540. Structural analysis of the other SA complexes shows that this pocket is occupied by DIS in the ESA–DIS complex (Sekula et al., 2013 ▸). Despite many sequence differences in the area of this binding pocket, the ligand is bound in the same orientation in both albumins. The key amino-acid residue His397 in CSA, which interacts strongly with the carboxyl group of DIS, is substituted by Val397 in ESA, which does not interact with the ligand. The role of hydrogen donor for the ligand carboxyl group in ESA is assumed by the amino group of Lys544. Additionally, the hydroxyl group of DIS in ESA creates a strong hydrogen bond to the carboxyl group of Asp401. A corresponding interaction is missing in CSA owing to the presence of Gly401 in this position. Additionally, the pocket in ESA is tighter than in CSA and a ligand can create more electrostatic interactions with the participation of I atoms. There are no sequence differences in this pocket between OSA and CSA; nevertheless in the OSA–DIS complex this position is occupied by a (2S)-2-hydroxybutanedioic ion from the crystallization medium. This ion probably has higher affinity than the DIS molecule and successfully competes for that albumin site. In BSA and HSA changes in sequence around this binding site are noticeable, although the substitution of the important His397 by Leu397 seems to be the main reason for the absence of a ligand in this pocket in both of these albumin complexes. The same pocket in ESA is capable of binding a diclofenac molecule in the ESA–DIC complex (Sekula & Bujacz, 2016 ▸).
The DIS6 molecule (Fig. 8 ▸ d) is bound only in the CSA–DIS complex, in a small niche on the surface of the first domain. This binding pocket is created by three helices; the cleft between them is open but, at the same time, is confined by the lysine side chains that keep the ligand in the pocket. Both O atoms of the carboxyl group of DIS6 create hydrogen bonds to NZ of Lys132. The I atoms also interact with the protein by electrostatic interactions: I3′ creates halogen bonds to the main-chain O atom of Gln20 and to the main-chain N atom of Gly21. The second I atom interacts with OE1 and NE2 of Gln20. This binding site for DIS is unique to CSA. The analogous position in the OSA–DIS complex is occupied by a fragment of PPG.
3.2.3. Comparison of DIS binding sites in OSA, CSA, BSA, ESA and HSA
The currently known structures of four serum albumin complexes with 3,5-diiodosalicylic acid reveal numerous differences in the mode of binding of this ligand (Fig. 1 ▸). DIS molecules are bound in CSA and OSA at six and two locations, respectively, and in BSA (PDB entry 4jk4) and ESA (PDB entry 4j2v) (Sekula et al., 2013 ▸) at four positions (not all of them the same). The HSA–DIS complex, which was obtained in the presence of fatty acids, contains only a single DIS molecule (PDB entry 2bxl; Ghuman et al., 2005 ▸). However, it was reported that defatted HSA has two binding sites for DIS (Carter & Ho, 1994 ▸).
Two DIS molecules in OSA–DIS and CSA–DIS are bound in the same location as in BSA, which corresponds to the DS1 site. This binding pocket is large and is able to accommodate two molecules of DIS. Interestingly, this pocket is built of the same amino-acid residues in all of the albumins discussed here, but only OSA, CSA and BSA bind two molecules of DIS in this large cavity. The absence of the second molecule of DIS in DS1 in HSA and ESA could be caused by the rotation of the indole ring of Trp213 by about 180° (Trp214 in HSA) and by the presence of large aromatic residues, Phe211 in HSA and Phe202 in ESA, at the entrance to this elongated chamber.
In the complex of HSA with iodipamide (IOD; PDB entry 2bxn; Ghuman et al., 2005 ▸) the elongated ligand, containing two aromatic rings connected by an aliphatic linker, occupies both of the cavities in which DIS1 and DIS2 are bound in ruminant albumins (Fig. 9 ▸). One ring of the IOD molecule in the HSA–IOD complex is localized at the same position as DIS1 in the OSA–DIS, CSA–DIS, BSA–DIS and ESA–DIS complexes, and creates many polar contacts with the side chains of residues in this chamber. The second iodinated benzene ring of IOD in the HSA–IOD complex interacts with Trp214 (Trp213 in OSA, CSA and BSA) via π-stacking, similar to the DIS2 molecule in the OSA–DIS and CSA–DIS complexes and analogous to DIS4 in the BSA complex (Sekula et al., 2013 ▸).
Figure 9.

Comparison of the elongated DS1 pocket in ruminant and human albumins. DIS1 and DIS2 bound in subchambers of DS1 in OSA (orange; PDB entry 4luh), CSA (green; PDB entry 5osw), BSA (light pink; PDB entry 4jk4) and HSA (yellow; PDB entry 2bxn) with ligand IOD (Ghuman et al., 2005 ▸).
The other two locations of DIS in BSA and ESA are occupied in OSA–DIS by Tacsimate anions and a PPG fragment. Since the OSA–DIS complex was obtained by soaking native OSA crystals in the mother liquor containing DIS, most of the binding pockets were already occupied by the crystallization components, which are visible in the native structure. Two DIS molecules were able to displace the crystallization ligands from pockets for which they had higher affinity. They must have displaced a PPG molecule, coming from the crystallization solution in the native structure, which had a lower affinity for these sites.
Compared with OSA, BSA–DIS and ESA–DIS contain two additional binding positions for DIS molecules. In both of them a molecule of DIS appeared in fatty-acid binding site 1 (FA1; Curry et al., 1998 ▸; Bhattacharya et al., 2000 ▸), located in the IB domain. In the OSA–DIS complex a succinate ion and a malate ion from the crystallization solution are bound at this site. The other DIS binding site in BSA–DIS is located in drug site 2 (DS2), between domains II and III. An analogous cavity in the OSA–DIS complex contains the organic acid anions succinate and acetate.
The final DIS binding site in CSA–DIS is located on the protein surface between subdomains IIIA and IIIB. In the ESA–DIS complex this site is also occupied by a DIS molecule, but in OSA–DIS a malate anion is present in this cavity.
3.3. Structural comparison of native OSA and CSA and their complexes with DIS
3.3.1. Comparison of the OSA structure and its complex with DIS
The structures of native OSA in the trigonal form and its complex with DIS are very similar; the r.m.s.d. of the superposed Cα atoms is 0.14 Å, indicating that binding of the DIS ligand does not change the conformation of the main chain of the protein. Small conformational changes are visible for the side chains of the amino-acid residues in the vicinity of the DIS1 ligand-binding pocket and on the protein surface. Most of the ligands originating from the crystallization solution occupy equivalent positions in both structures.
An explanation for this resemblance is the procedure of complex formation. The crystals used for diffraction data collection, for both data sets, grew in the same crystallization drop, from which a few crystals intended for obtaining a complex with 3,5-diiodosalicylic acid were transferred to another drop of the mother liquor saturated with the ligand. The bound ligands, anions from Tacsimate and PPG fragments, are good markers of binding pockets in this albumin. The OSA crystal structure is characterized by a relatively high solvent content (66.3%), which facilitates ligand diffusion and makes a soaking process favourable. In the crystals of OSA water channels are found along the c axis, making penetration by small ligands very easy. On the other hand, the presence of a number of small polar ions coming from Tacsimate can prevent ligand binding, and this may explain why the number of DIS molecules in the OSA–DIS complex is lower than that in the CSA–DIS complex.
3.3.2. Comparison of the native CSA structure and its complex with DIS
Alignment of the native structure of CSA with the DIS complex in the orthorhombic crystal form results in an r.m.s.d. value of 0.76 Å. Structural differences are most visible in the main chain between domain I and subdomain IIIB, where helices and loops are slightly shifted. Differences in the conformation of the amino-acid residues in the area of the DIS binding pockets and on the protein surface are also noticeable. Binding pockets occupied by ligands from the crystallization solution and by DIS in the complex are filled by water molecules in the native structure.
3.3.3. Comparison of the crystal structures of native OSA in trigonal and triclinic forms
The second crystal form of native OSA, in space group P1, contains four protein molecules in the asymmetric unit (Fig. 10 ▸ a). Despite the change in crystallization conditions, the overall arrangement of the main chain, especially in the helical fragments, is still preserved in each monomer. The r.m.s.d. values for superposition of OSA monomers of the trigonal and triclinic forms range from 1.22 Å (chain D) to 1.28 Å (chains A, B and C). Structural differences are visible mainly in the area of domains I and III. The crystal packing in the triclinic form is tighter, leading to the availability of less space between domains I and III in the protein. At the same time, a monomer of OSA in the trigonal form occupies a larger volume, and the packing is looser and allows a wider inter-domain space. A further comparison of both native forms shows different localizations of ligands from the crystallization solution, with only the DS2 binding pocket occupied in each monomer of both crystal forms.
Figure 10.

The unit cells of the OSA and CSA structures. (a) Crystal packing of OSA in space group P1, which is isostructural to CSA in P1; (b) OSA in space group P3221; (c) CSA in space group P212121.
3.3.4. Comparison of the crystal structures of native CSA in orthorhombic and triclinic forms
Triclinic crystals of CSA contain four molecules in the asymmetric unit, similar to the isomorphous crystals of OSA (Fig. 10 ▸ a). However, the packing in the unit cell is tighter than in the orthorhombic crystals. Although all of the helices forming the characteristic heart-shaped structure of serum albumin remain unchanged, the r.m.s.d. values between the monomers of the native forms of CSA are in the range from 1.52 Å (chains B and C) to 1.65 Å (chains A and D). Such changes in conformation can be caused by differences in the crystallization conditions and crystal packing. The binding pockets occupied by molecules from the crystallization solution are different in the compared crystal forms.
3.3.5. Comparison of the crystal structures of native OSA and CSA in the triclinic form
The molecules of both OSA and CSA are packed in a similar fashion in the triclinic crystals. A unit cell (corresponding to an asymmetric unit) is occupied by four monomers that create two similar dimers. An interface in each dimer is formed between domain III and domain I of a neighbouring monomer (interaction between the upper parts of the heart-shaped molecules; Fig. 10 ▸ a). The same kind of a dimer is seen in another ruminant albumin, BSA (Bujacz, 2012 ▸), but in this crystal lattice only a single dimer represents an asymmetric unit in space group C2.
It is also worth noting that the structural homology of the triclinic crystal forms of OSA and CSA is very high: the r.m.s.d. values for Cα superposition of monomers A, B, C and D are 0.77, 0.76, 0.72 and 0.82 Å, respectively.
The triclinic forms of OSA and CSA were grown under conditions that included the addition of proline as an additive to improve the crystal quality. This amino acid, when bound by an albumin molecule, is also an indicator of potential binding sites for small organic compounds with cyclic rings and carboxyl groups. Both albumins bound numerous proline molecules, mainly on the surface of the protein. However, in CSA prolines are bound inside the protein molecule, next to Trp134 and Trp213, where they stabilize the conformation of the amino acids creating the binding pocket.
4. Conclusions
Crystal structures of serum albumins isolated from domesticated even-toed ungulates, ovine serum albumin (OSA) and caprine serum albumin (CSA), as well as their complexes with 3,5-diiodosalicylic acid, were determined. Owing to their close evolutionary relationship, the two albumins have very similar amino-acid sequences, resulting in rather minor structural differences between them and a comparable propensity for ligand binding. However, we report unforeseen alterations in the affinity for the DIS ligand and its impact on the overall conformation of these ruminant albumins.
We might expect similar ligand-binding properties between ovine, caprine and bovine serum albumins owing to their 98% sequence identity (Fig. 2 ▸, Table 2 ▸); however, CSA and BSA reveal more binding sites for DIS. Two molecules of DIS in the ovine, caprine and bovine serum albumin complexes were localized in the same pocket and interact with equivalent residues; however, some differences in the distances between the interacting groups could be observed. These small discrepancies in ligand-binding strength influence conformational changes of the side-chain residues surrounding the ligands.
Drug site 1 is the main location for binding aromatic derivatives. 3,5-Diiodosalicylic acid is bound in the main cavity of DS1 in all albumin complexes discussed here. Additionally, the OSA and BSA complexes contain a second DIS molecule in the elongated part of DS1. In the OSA structure, in two other positions where DIS is bound in BSA and ESA, only anions of organic acids from the crystallization solution are present. Therefore, it can be concluded that the main part of the DS1 pocket exhibits the highest affinity for DIS in all structurally characterized serum albumins, and it can be expected that for even-toed ungulates the elongated compartment of DS1 can also be occupied by this ligand. However, in CSA the number of DIS binding sites is as large as six.
Analyzing the structures of the complexes describe here, as well as the previously determined structures of the ESA and BSA complexes (Sekula et al., 2013 ▸), it can be concluded that the manner of DIS binding (and probably also that of other ligands) differs significantly among albumins from different species, even in closely related ruminants. The most important difference is the number of DIS binding sites in mammalian serum albumins. Secondly, there are positional shifts of the DIS molecule inside analogous cavities in serum albumins from different species. A ligand molecule is able to introduce not only a change in the side-chain conformation of the interacting amino acids, but also a significant shift of large helical fragments, subdomains or domains, which induces a change of the volume of the binding cavities. These differences are caused by changes in protein sequence during evolution. Additionally, analysis of the electrostatic surface potential of serum albumins revealed some differences in the distribution of positive and negative charges. Therefore, interactions with other proteins found in nature, especially with antibodies, may be different for albumins from various species. This effect might be responsible for some food allergies, for example a person may be allergic to beef, but can eat lamb. For these reasons, we postulate that the differentiation of binding properties between serum albumins from different species may be much more significant than it is thought to be.
Supplementary Material
PDB reference: ovine serum albumin, space group P3221, 4luf
PDB reference: space group P1, 5orf
PDB reference: complex with 3,5-diiodosalicylic acid, 4luh
PDB reference: caprine serum albumin, space group P212121, 5ori
PDB reference: space group P1, 5otb
PDB reference: complex with 3,5-diiodosalicylic acid, 5osw
Supplementary Table S1.. DOI: 10.1107/S205979831701470X/dw5186sup1.pdf
Acknowledgments
We are grateful to A. Wlodawer, NCI for help in editing the manuscript and Professor G. Bujacz for synchrotron data collection. The authors thank HZB BESSY Berlin for access to the BESSY 14.1 and 14.2 beamlines and EMBL–PETRA III in Hamburg for access to the PX13 beamline.
Funding Statement
This work was funded by National Science Center grant 2013/11/B/ST5/02271 to Anna Bujacz.
References
- Abendroth, J., Gardberg, A. S., Robinson, J. I., Christensen, J. S., Staker, B. L., Myler, P. J., Stewart, L. J. & Edwards, T. E. (2011). J. Struct. Funct. Genomics, 12, 83–95. [DOI] [PMC free article] [PubMed]
- Ahmed, M., Nencetti, S., Mazzoni, M. R., Porchia, F., Antonelli, F. & Lapucci, A. (2008). Med. Chem. 4, 298–308. [DOI] [PubMed]
- Alexander, M. R., Ambre, J. J., Liskow, B. I. & Trost, D. C. (1979). JAMA, 241, 2527–2529. [PubMed]
- Asero, R., Mistrello, G. & Amato, S. (2010). Allergy, 65, 1067–1068. [DOI] [PubMed]
- Baker, N. A., Sept, D., Joseph, S., Holst, M. J. & McCammon, J. A. (2001). Proc. Natl Acad. Sci. USA, 98, 10037–10041. [DOI] [PMC free article] [PubMed]
- Beretta, B., Conti, A., Fiocchi, A., Gaiaschi, A., Galli, C. L., Giuffrida, M. G., Ballabio, C. & Restani, P. (2011). Int. Arch. Allergy Immunol. 26, 188–195. [DOI] [PubMed]
- Bhattacharya, A., Grüne, T. & Curry, S. (2000). J. Mol. Biol. 303, 721–732. [DOI] [PubMed]
- Blandin, V., Vigne, P., Breittmayer, J. P. & Frelin, C. (2000). Mol. Pharmacol. 58, 1461–1469. [DOI] [PubMed]
- Bujacz, A. (2012). Acta Cryst. D68, 1278–1289. [DOI] [PubMed]
- Bujacz, G., Wrzesniewska, B. & Bujacz, A. (2010). Acta Cryst. D66, 789–796. [DOI] [PubMed]
- Bujacz, A., Zielinski, K. & Sekula, B. (2014). Proteins, 82, 2199–2208. [DOI] [PubMed]
- Carter, D. & Ho, J. X. (1994). Adv. Protein Chem. 45, 153–203. [DOI] [PubMed]
- Chen, V. B., Arendall, W. B., Headd, J. J., Keedy, D. A., Immormino, R. M., Kapral, G. J., Murray, L. W., Richardson, J. S. & Richardson, D. C. (2010). Acta Cryst. D66, 12–21. [DOI] [PMC free article] [PubMed]
- Curry, S., Mandelkow, H., Brick, P. & Franks, N. (1998). Nature Struct. Biol. 5, 827–835. [DOI] [PubMed]
- Dolinsky, T. J., Czodrowski, P., Li, H., Nielsen, J. E., Jensen, J. H., Klebe, G. & Baker, N. A. (2007). Nucleic Acids Res. 35, W522–W525. [DOI] [PMC free article] [PubMed]
- Dolinsky, T. J., Nielsen, J. E., McCammon, J. A. & Baker, N. A. (2004). Nucleic Acids Res. 32, W665–W667. [DOI] [PMC free article] [PubMed]
- Doolittle, R. F. (1992). Protein Sci. 1, 191–200. [DOI] [PMC free article] [PubMed]
- Emsley, P., Lohkamp, B., Scott, W. G. & Cowtan, K. (2010). Acta Cryst. D66, 486–501. [DOI] [PMC free article] [PubMed]
- Fiocchi, A., Restani, P., Riva, E., Qualizza, R., Bruni, P., Restelli, A. R. & Galli, C. L. (1995). J. Am. Coll. Nutr. 14, 239–244. [DOI] [PubMed]
- Gales, L., Almeida, M. R., Arsequell, G., Valencia, G., Saraiva, M. J. & Damas, A. M. (2008). Biochim. Biophys. Acta, 1784, 512–517. [DOI] [PubMed]
- Garner, A. L., Gloeckner, C., Tricoche, N., Zakhari, J. S., Samje, M., Cho-Ngwa, F., Lustigman, S. & Janda, K. D. (2011). J. Med. Chem. 54, 3963–3972. [DOI] [PubMed]
- Ghuman, J., Zunszain, P. A., Petitpas, I., Bhattacharya, A. A., Otagiri, M. & Curry, S. (2005). J. Mol. Biol. 353, 38–52. [DOI] [PubMed]
- Goujon, M., McWilliam, H., Li, W., Valentin, F., Squizzatom, S., Paern, J. & Lopez, R. (2010). Nucleic Acids Res. 38, 695–699. [DOI] [PMC free article] [PubMed]
- Harper, M. E. & Dugaiczyk, A. (1983). Am. J. Hum. Genet. 35, 565–572. [PMC free article] [PubMed]
- Hastings, G. E. & Wolf, P. G. (1992). Arch. Fam. Med. 1, 281–287. [DOI] [PubMed]
- Hertzog, P. J., Shaw, A., Lindsay Smith, J. R. & Garner, R. C. (1983). J. Immunol. Methods, 62, 49–58. [DOI] [PubMed]
- Kabsch, W. (2010). Acta Cryst. D66, 125–132. [DOI] [PMC free article] [PubMed]
- Kragh-Hansen, U., Chuang, V. T. G. & Otagiri, M. (2002). Biol. Pharm. Bull. 25, 695–704. [DOI] [PubMed]
- Larkin, M. A., Blackshields, G., Brown, N. P., Chenna, R., McGettigan, P. A., McWilliam, H., Valentin, F., Wallace, I. M., Wilm, A., Lopez, R., Thompson, J. D., Gibson, T. J. & Higgins, D. G. (2007). Bioinformatics, 23, 2947–2948. [DOI] [PubMed]
- Larson, S. B., Day, J. S., Cudney, R. & McPherson, A. (2007). Acta Cryst. D63, 310–318. [DOI] [PubMed]
- Leong, M. M. L., Fox, G. R. & Hayward, J. S. (1988). Anal. Biochem. 168, 107–114. [DOI] [PubMed]
- Li, Y.-F., Zhang, X.-Q., Hu, W.-Y., Li, Z., Liu, P.-X. & Zhang, Z.-Q. (2013). J. Anal. Methods Chem., 2013, 439039. [DOI] [PMC free article] [PubMed]
- Marth, E. & Kleinhappl, B. (2001). Vaccine, 20, 532–537. [DOI] [PubMed]
- McCoy, A. J., Grosse-Kunstleve, R. W., Adams, P. D., Winn, M. D., Storoni, L. C. & Read, R. J. (2007). J. Appl. Cryst. 40, 658–674. [DOI] [PMC free article] [PubMed]
- McPherson, A. (2001). Protein Sci. 10, 418–422. [DOI] [PMC free article] [PubMed]
- McWilliam, H., Li, W., Uludag, M., Squizzato, S., Park, Y. M., Buso, N., Cowley, A. P. & Lopez, R. (2013). Nucleic Acids Res. 41, W597–W600. [DOI] [PMC free article] [PubMed]
- Mueller, U., Darowski, N., Fuchs, M. R., Förster, R., Hellmig, M., Paithankar, K. S., Pühringer, S., Steffien, M., Zocher, G. & Weiss, M. S. (2012). J. Synchrotron Rad. 19, 442–449. [DOI] [PMC free article] [PubMed]
- Murshudov, G. N., Skubák, P., Lebedev, A. A., Pannu, N. S., Steiner, R. A., Nicholls, R. A., Winn, M. D., Long, F. & Vagin, A. A. (2011). Acta Cryst. D67, 355–367. [DOI] [PMC free article] [PubMed]
- Murshudov, G. N., Vagin, A. A. & Dodson, E. J. (1997). Acta Cryst. D53, 240–255. [DOI] [PubMed]
- Otwinowski, Z. & Minor, W. (1997). Methods Enzymol. 276, 307–326. [DOI] [PubMed]
- Parisini, E., Metrangolo, P., Pilati, T., Resnati, G. & Terraneo, G. (2011). Chem. Soc. Rev. 40, 2267–2278. [DOI] [PubMed]
- Peters, T. Jr (1996). All About Albumin: Biochemistry, Genetics, and Medical Applications. San Diego: Academic Press.
- Pickles, J., Rafiq, S., Cochrane, S. A. & Lalljie, A. (2014). Toxicol. Rep. 1, 858–870. [DOI] [PMC free article] [PubMed]
- Potterton, L., McNicholas, S., Krissinel, E., Gruber, J., Cowtan, K., Emsley, P., Murshudov, G. N., Cohen, S., Perrakis, A. & Noble, M. (2004). Acta Cryst. D60, 2288–2294. [DOI] [PubMed]
- Restani, P., Ballabio, C., Cattaneo, A., Isoardi, P., Terracciano, L. & Fiocchi, A. (2004). Allergy, 59, Suppl. 78, 21–24. [DOI] [PubMed]
- Rostkowski, M., Olsson, M. H. M., Søndergaard, C. R. & Jensen, J. H. (2011). BMC Struct. Biol. 11, 6. [DOI] [PMC free article] [PubMed]
- Seidel, S. A. I., Wienken, C. J., Geissler, S., Jerabek-Willemsen, M., Duhr, S., Reiter, A., Trauner, D., Braun, D. & Baaske, P. (2012). Angew. Chem. Int. Ed. 51, 10656–10659. [DOI] [PMC free article] [PubMed]
- Sekula, B. & Bujacz, A. (2016). J. Med. Chem. 59, 82–89. [DOI] [PubMed]
- Sekula, B., Zielinski, K. & Bujacz, A. (2013). Int. J. Biol. Macromol. 60, 316–324. [DOI] [PubMed]
- Sievers, F., Wilm, A., Dineen, D., Gibson, T. J., Karplus, K., Li, W., Lopez, R., McWilliam, H., Remmert, M., Söding, J., Thompson, J. D. & Higgins, D. G. (2011). Mol. Syst. Biol. 7, 539. [DOI] [PMC free article] [PubMed]
- Sinibaldi, R., Ortore, M. G., Spinozzi, F., de Souza Funari, S., Teixeira, J. & Mariani, P. (2008). Eur. Biophys. J. 37, 673–681. [DOI] [PubMed]
- Skogen, W. F., Litwin, S. B., Laver, M. B. & Taketa, F. (1977). Comp. Biochem. Physiol. A Physiol. 56, 499–502.
- Sohl, J. L. & Splittgerber, G. (1991). J. Chem. Educ. 68, 262–264.
- Srivastava, R. P. & Sharma, S. (1990). Pharmazie, 45, 34–37. [PubMed]
- Sudlow, G., Birkett, D. J. & Wade, D. N. (1976). Mol. Pharmacol. 12, 1052–1061. [PubMed]
- Sułkowska, A. (2002). J. Mol. Struct. 614, 227–232.
- Thorn, A. & Sheldrick, G. M. (2011). J. Appl. Cryst. 44, 1285–1287. [DOI] [PMC free article] [PubMed]
- Vagin, A. & Teplyakov, A. (2010). Acta Cryst. D66, 22–25. [DOI] [PubMed]
- Winn, M. D. et al. (2011). Acta Cryst. D67, 235–242.
- Yamane, I., Murakami, O. & Kato, M. (1975). Proc. Soc. Exp. Biol. Med. 149, 439–442. [DOI] [PubMed]
Associated Data
This section collects any data citations, data availability statements, or supplementary materials included in this article.
Supplementary Materials
PDB reference: ovine serum albumin, space group P3221, 4luf
PDB reference: space group P1, 5orf
PDB reference: complex with 3,5-diiodosalicylic acid, 4luh
PDB reference: caprine serum albumin, space group P212121, 5ori
PDB reference: space group P1, 5otb
PDB reference: complex with 3,5-diiodosalicylic acid, 5osw
Supplementary Table S1.. DOI: 10.1107/S205979831701470X/dw5186sup1.pdf