

SUMMARY
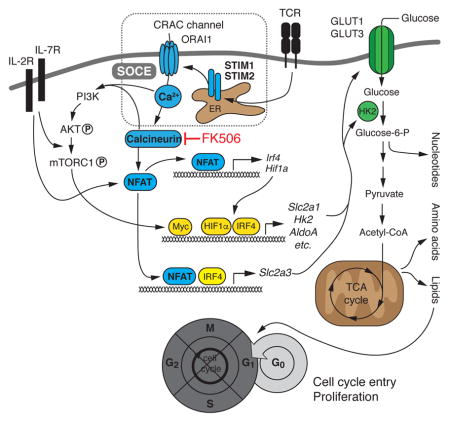
Store-operated Ca2+ entry (SOCE) is the main Ca2+ influx pathway in lymphocytes and essential for T cell function and adaptive immunity. SOCE is mediated by Ca2+ release-activated Ca2+ (CRAC) channels that are activated by stromal interaction molecules (STIM) 1 and STIM2. SOCE regulates many Ca2+-dependent signaling molecules including calcineurin and inhibition of SOCE or calcineurin impairs antigen-dependent T cell proliferation. We here report that SOCE and calcineurin regulated cell cycle entry of quiescent T cells by controlling glycolysis and oxidative phosphorylation. SOCE directed the metabolic reprogramming of naive T cells by regulating the expression of glucose transporters, glycolytic enzymes and metabolic regulators through the activation of nuclear factor of activated T cells (NFAT) and the PI3K-AKT kinase-mTOR nutrient sensing pathway. We propose that SOCE controls a critical ‘metabolic checkpoint’ at which T cells assess adequate nutrient supply to support clonal expansion and adaptive immune responses.
Keywords: SOCE, STIM1, STIM2, ORAI1, NFAT, calcium, GLUT1, GLUT3, mitochondria, metabolism, glycolysis, cell cycle, calcineurin
Graphical Abstract
INTRODUCTION
Recognition of pathogens by T cells is essential for adaptive immune responses. However, auto- and alloreactive T cells cause autoimmunity or organ transplant rejection requiring immunosuppression to attenuate inflammation. Two of the most widely used immunosuppressants, cyclosporine A (CsA) and tacrolimus (FK506) target the Ca2+ and calmodulin-regulated phosphatase calcineurin. Both inhibitors prevent T cell receptor (TCR)-induced proliferation of T cells and their production of proinflammatory cytokines. Calcineurin activity is regulated by free cytosolic Ca2+ ([Ca2+]i) through its interaction with the small Ca2+-binding protein calmodulin (Muller and Rao, 2010). In T cells, Ca2+ release-activated Ca2+ (CRAC) channels are the main source of [Ca2+]i upon TCR ligation and are critical for calcineurin activation (Feske et al., 2012). CRAC channels are located in the plasma membrane and composed of ORAI1 and ORAI2 proteins that form the Ca2+-permeant pore of the channel (Feske et al., 2006; Prakriya et al., 2006; Vaeth et al., 2017). They are activated upon TCR stimulation, which triggers the production of the second messenger inositol 1,4,5-trisphosphate (IP3) and opening of IP3 receptor channels in the endoplasmic reticulum (ER) (Feske, 2007). The subsequent decrease in the ER Ca2+ concentration results in the dissociation of Ca2+ from stromal interaction molecules (STIM) 1 and STIM2 that are located in the membrane of the ER. In the Ca2+-free state, STIM1 and STIM2 bind to and activate CRAC channels in the plasma membrane. The resulting Ca2+ influx is called store-operated Ca2+ entry (SOCE) as it is regulated by the Ca2+ concentration within the ER (Feske, 2007; Feske et al., 2012).
Patients with null mutations in ORAI1 or STIM1 genes suffer from severe immunodeficiency as part of a complex CRAC channelopathy syndrome (Lacruz and Feske, 2015). As a consequence of abolished SOCE, the patients’ T cells fail to activate calcineurin, which results in impaired proliferation and cytokine production (Feske et al., 2012). Similar to SOCE-deficient patients, lymphocytes from mice with genetic deletion of Orai1 and Orai2 or Stim1 and Stim2 genes in T cells have impaired cytokine production and antigen-dependent proliferation that result in defective T cell-mediated immune responses (Desvignes et al., 2015; Oh-Hora et al., 2008; Shaw et al., 2014; Vaeth et al., 2016; Vaeth et al., 2017). Many of the effects of SOCE and calcineurin signaling on T cell function are mediated by transcription factors of the nuclear factor of activated T cells (NFAT) family (Feske, 2007; Muller and Rao, 2010). Of the four Ca2+-regulated NFAT family members, NFATc1 (or NFAT2), NFATc2 (NFAT1) and NFATc3 (NFAT4) are functional in T cells (Muller and Rao, 2010). Calcineurin dephosphorylates serine and threonine residues within the NFAT regulatory domains resulting in nuclear translocation and transcriptional activation (Muller and Rao, 2010).
The mechanisms by which SOCE, calcineurin and NFAT control proliferation of T cells remain poorly defined. Some of the proposed mechanisms involve regulation of the ‘growth factor’ interleukin-2 (IL-2) and cyclins or cyclin-dependent kinases, which in some cell types depend on calcineurin and NFAT signaling (Mognol et al., 2016). Although IL-2 promotes T cell proliferation in vitro in an auto- or paracrine fashion, addition of exogenous IL-2 to T cells from patients with null mutations in ORAI1 or STIM1 or T cells from Orai1fl/fl Cd4Cre Orai2−/− mice only weakly rescues TCR-induced proliferation in vitro (Feske et al., 1996; Fuchs et al., 2012; Le Deist et al., 1995; Picard et al., 2009; Schaballie et al., 2015; Vaeth et al., 2017). Another possible mechanism by which SOCE may control T cell proliferation is through the regulation of metabolism. Naïve T cells are metabolically quiescent and have low nutrient uptake, glycolytic rate and biosynthesis. Upon TCR stimulation, T cells undergo a ‘glycolytic switch’ from low rate catabolism to high rate anabolic metabolism that provides the glycolytic intermediates required for cell growth and cell division (Pearce et al., 2013). The main source of carbohydrates in activated T cells is glucose and depriving T cells of glucose or deletion of glucose transporter 1 (GLUT1) impairs TCR-induced proliferation and T cell-mediated immunity (Macintyre et al., 2014). In T cells, several signaling pathways and transcription factors have been reported to regulate the metabolic adaptation of activated T cells (Buck et al., 2015), but the role of SOCE and calcineurin in T cell metabolism in general and aerobic glycolysis in particular is unknown.
We here report that SOCE and calcineurin control T cell proliferation by regulating the metabolic reprogramming of quiescent T cells after TCR stimulation. Abolishing SOCE in mouse T cells by conditional deletion of Stim1 and Stim2 or calcineurin inhibition impaired TCR-induced proliferation in vitro and clonal expansion of virus-specific T cells in vivo. SOCE and calcineurin controlled the expression of GLUT1 and GLUT3, glycolytic enzymes and proteins required for mitochondrial respiration. In addition, we found that transcription factors that regulate the glycolytic program of activated T cells such as c-Myc, IRF4 and HIF1α were induced in an SOCE- and calcineurin-dependent manner. The metabolic effects of SOCE were mediated by NFAT-regulated transcription and the PI3K-AKT kinase-mTOR nutrient sensing pathway. We found NFAT binding to several genes regulating glycolysis. Deletion of NFATc1 and NFATc2 in T cells strongly impaired glycolytic gene expression whereas expression of constitutively active NFATc1 in SOCE-deficient T cells restored glycolysis and T cell proliferation in vivo. We conclude that SOCE orchestrates the metabolic reprogramming of naive T cells, thus facilitating cell growth, cell cycle entry and T cell proliferation. Our study provides mechanistic insights into the potent immunosuppressive effects of calcineurin inhibitors.
RESULTS
SOCE and calcineurin signaling controls proliferation and cell cycle entry of T cells
To investigate how SOCE regulates antigen-dependent proliferation of T cells in vivo, we used wildtype (WT) and Stim1fl/flStim2fl/fCd4cre mice whose T cells lack SOCE and that were crossed to SMARTA transgenic mice expressing a MHC class II-restricted transgenic TCR specific for the GP61-80 epitope of lymphocytic choriomeningitis virus (LCMV). We adoptively transferred CD4+ T cells into congenic WT mice that were infected with LCMV (Figure 1A). 8 days post infection, we found significantly reduced expansion of Stim1fl/flStim2fl/fCd4cre SMARTA T cells in the spleen compared to WT controls (Figure 1B). Defective proliferation was not due to impaired activation of SOCE-deficient T cells as expression of the activation marker CD44 was comparable to WT T cells (Figure 1C). Since WT host mice provide an immunocompetent milieu, impaired expansion of SOCE-deficient T cells must be due to a T cell intrinsic role of SOCE in proliferation. A similar proliferation defect of CD4+ T cells from Stim1fl/flStim2fl/fCd4cre mice was observed after T cell stimulation in vitro (Figure 1E) despite normal CD44 expression (Figure 1D). Proliferation was also abolished in WT T cells treated with the calcineurin inhibitor FK506 (Figure 1E), indicating that SOCE acts through calcineurin. Neither SOCE-deficient T cells nor FK506-treated WT T cells entered the cell cycle as they failed to upregulate the cell cycle marker Ki-67 after TCR stimulation (Figure 1F). Ki-67 is detected in all phases of the cell cycle except G0 (marking quiescent cells), demonstrating that SOCE and calcineurin regulate cell cycle entry and proliferation of T cells.
Figure 1. SOCE and calcineurin control T cell proliferation.

(A) Adoptive transfer of CD45.2+CD4+ T cells from WT or Stim1fl/flStim2fl/flCd4cre (Stim1/2CD4) SMARTA mice into congenic CD45.1+ WT host mice followed by infection with LCMV. (B) Analysis of WT and Stim1/2CD4 SMARTA donor CD4+ T cells in the spleen 8 d after adoptive T cell transfer and infection by flow cytometry; means ± SEM of 4 mice. (C and D) CD44 surface expression on WT and Stim1/2CD4 SMARTA CD4+ T cells (C) before and 8 d after transfer and LCMV infection or (D) before and 24 h after αCD3 and αCD28 stimulation in vitro. (E and F) CD4+ T cells of WT and Stim1/2CD4 mice stimulated with αCD3 and αCD28 in the presence or absence of 1 μM FK506 were analyzed for (E) proliferation by CFSE dilution after 72 h and (F) expression of Ki-67 after 24 h. Data in panels D–F are representative of 2–3 repeat experiments.
SOCE and calcineurin induce the metabolic switch of activated T cells
In order to progress through G1 and commit to mitosis and proliferation, cells have to pass a metabolic checkpoint at which they test nutrient sufficiency (Foster et al., 2010). Aerobic glycolysis is the main source of anabolic metabolites upon TCR stimulation (Buck et al., 2015). 2-deoxy-D-glucose (2-DG), which suppresses glycolysis, prevented Ki-67 expression in WT T cells (Figure 2A) suggesting that glucose utilization is essential for cell cycle commitment and T cell proliferation. To test whether SOCE and calcineurin signaling are required for the metabolic switch of T cells, we analyzed aerobic glycolysis and oxidative phosphorylation (OXPHOS) in quiescent and activated T cells. T cells from WT and Stim1fl/flStim2fl/fCd4cre mice were stimulated in the presence or absence of FK506 and analyzed for their oxygen consumption rate (OCR) as a measure of OXPHOS and their extracellular acidification rate (ECAR), which correlates with lactate production. Activated WT T cells showed a marked increase in basal OCR compared to non-stimulated cells, which was largely blocked by FK506 (Figures 2B and 2C), and increased maximal mitochondrial respiration after FCCP treatment (Figures 2B and 2D). The activation-induced increase in OCR was dependent on SOCE and calcineurin as it was almost completely abolished in SOCE-deficient T cells and T cells treated with FK506 (Figures 2B and 2D). Furthermore, stimulation induced a drastic increase in basal ECAR in WT T cells, which was severely impaired in SOCE-deficient and FK506-treated T cells (Figures 2E and 2F). Combined analysis of the respiratory capacity and glycolytic function of stimulated T cells clearly separated WT from SOCE-deficient and FK506-treated cells, which were similar to resting cells (Figure 2G). Thus in the absence of SOCE or calcineurin function stimulated T cells remain in a quiescent metabolic state similar to naive T cells. The metabolic switch of T cells is required to promote anabolic metabolism and biosynthesis of nucleotides, fatty acids and amino acids to support cell growth (Pearce et al., 2013). Whereas stimulated WT T cells showed a strong increase in cell size (Figure 2H) and protein content (Figure 2I), no such increase was observed in SOCE-deficient or FK506-treated T cells (Figures 2H and 2I).
Figure 2. SOCE and calcineurin regulate the metabolic reprogramming of T cells.

(A) Ki-67 expression in WT CD4+ T cells before and 24 h after αCD3 and αCD28 stimulation in the presence or absence of 10 mM 2-DG; data are representative of 2 independent experiments. (B–F) Extracellular flux analysis of (B) oxygen consumption rate (OCR), (C) basal respiration, (D) maximal respiration, (E) extracellular acidification rate (ECAR) and (F) basal ECAR of WT and Stim1fl/flStim2fl/flCd4cre (Stim1/2CD4) CD4+ T cells left unstimulated or stimulated with αCD3 and αCD28 for 24 h in the presence or absence of 1 μM FK506. Panels C, D and F show the means ± SEM of 5 WT and 6 Stim1/2CD4 mice. (G) Maximal OCR plotted against ECAR from data in (D and F). (H and I) WT and Stim1/2CD4 CD4+ T cells stimulated as in (B–F) were analyzed for (H) cell size (FSC-A) by flow cytometry and (I) protein amount per cell; means ± SEM of 3–4 mice. Data in A–H are representative of at least 2 independent repeat experiments. (J and K) Analysis of polar metabolites including (J) glycolytic and TCA cycle intermediates, nucleotides and (K) amino acids by liquid chromatography and mass spectrometry (LC-MS) in WT and Stim1/2CD4 CD4+ T cells stimulated as in (B–F). Heatmaps show relative metabolite concentrations per row in T cells from 3–4 mice (one column per mouse) from one experiment. See also Figures S1, S2 and S3.
IL-2 is an auto- or paracrine ‘growth factor’ that promotes T cell proliferation and inhibition of SOCE or calcineurin blocks IL-2 production by T cells (Oh-Hora et al., 2008). We tested if abolished proliferation and metabolic switching of SOCE-deficient T cells is due to impaired IL-2 production. Addition of exogenous IL-2 only marginally restored proliferation of T cells from Stim1fl/flStim2fl/fCd4cre mice in vitro (Figure S1A). Likewise, IL-2 did not rescue basal and maximal OCR of SOCE-deficient T cells (Figure S1B–D) and failed to restore their impaired glycolysis (Figures S1E–F). Thus despite IL-2 addition SOCE-deficient T cells remained in a low metabolic state (Figure S1G), indicating that their impaired metabolic switch and proliferation were not due to impaired IL-2 production. Collectively, these findings demonstrate that SOCE and calcineurin control the metabolic switch of T cells as a prerequisite for cell cycle entry.
SOCE and calcineurin regulate aerobic glycolysis in T cells
To investigate how SOCE and calcineurin control T cell metabolism, we performed polar metabolite profiling by liquid chromatography followed by mass spectrometry of WT and SOCE-deficient T cells (Figure 2J), which captures the majority of glycolytic and TCA cycle intermediates (Figure S2A). In stimulated WT T cells, the levels of glycolytic metabolites increased up to 300-fold compared to unstimulated cells (Figures 2J and S2B). Similar changes were observed in the TCA cycle, whose intermediates were also markedly increased (Figures 2J and S2B). In addition, we found a greater abundance of pentose phosphate pathway metabolites, which are crucial for nucleotide synthesis (Figures 2J and S2D), and of non-essential amino acids (Figures 2K and S3). In sharp contrast, SOCE-deficient T cells and FK506-treated WT T cells showed a strongly attenuated increase in metabolites upon stimulation (Figures 2J, S2 and S3), which included the most upstream glycolysis product glucose 6-phosphate. Consequently, the abundance of nucleotides and many amino acids was strongly reduced in SOCE- or calcineurin-deficient T cells (Figures 2J, 2K, S2 and S3). These findings suggest that SOCE controls aerobic glycolysis through glucose utilization.
SOCE and calcineurin regulate glucose uptake and GLUT1 and GLUT3 expression
Given the blunted increase of glucose-6-phosphate in stimulated T cells from Stim1fl/flStim2fl/fCd4cre mice, we hypothesized that the SOCE may control glucose uptake. When we measured glucose utilization of T cells from the medium after TCR stimulation, we observed that stimulated WT T cells used ~4 times more glucose than quiescent T cells (Figure S4A). By contrast, SOCE-deficient or FK506-treated WT T cells did not significantly increase their glucose utilization (Figure S4A). Direct measurements of glucose uptake in WT CD4+ and CD8+ T cells showed a ~2.5-fold and ~3.3-fold increase, respectively, in the uptake of the fluorescent glucose analogue 2-NBDG after TCR stimulation. This increase was almost absent in SOCE-deficient or FK506-treated T cells (Figures 3A and 3B). A similar defect in glucose uptake was observed by measuring intracellular tritiated glucose counts (Figure S4B).
Figure 3. SOCE and calcineurin control glucose uptake in T cells.

CD4+ and CD8+ T cells from WT and Stim1fl/flStim2fl/flCd4cre (Stim1/2CD4) mice were left unstimulated or stimulated for 36 h with αCD3 and αCD28 in the presence or absence of 1 μM FK506 and analyzed by flow cytometry for (A and B) glucose uptake using 2-NBDG, (C and D) GLUT1 protein expression, (E and F) GLUT3 protein expression and (G and H) cell size (FSC-A). Data in A–H represent the means ± SEM of 3–6 mice and 2–4 repeat experiments. See also Figure S4.
GLUT1 is important for glucose uptake by activated CD4+ T cells and its expression is strongly induced upon TCR stimulation (Macintyre et al., 2014). We confirmed that GLUT1 (murine gene name Slc2a1) is highly expressed in activated WT T cells (Figure S4C and S4F). In addition, activated WT T cells also showed robust transcription of GLUT3 (Slc2a3) (Figure S4C and S4F), although Slc2a3 mRNA concentrations peaked later compared to Slc2a1 (Figure S4F). GLUT1 and GLUT3 protein expression was robustly induced in stimulated WT CD4+ (Figure 3C and 3E) and WT CD8+ T cells (Figure 3D and 3F). No such increase was observed in SOCE-deficient or FK506-treated WT CD4+ T cells (Figure 3C and 3E). In CD8+ T cells, the lack of SOCE partially impaired GLUT1 and GLUT3 protein expression (Figure 3D and 3F). This finding was consistent with more prominent defects in glucose uptake and cell growth in SOCE-deficient CD4+ T cells compared to CD8+ T cells (Figures 3A,B and 3G,H). Taken together, our data demonstrate that SOCE controls the induction of GLUT1 and GLUT3, glucose uptake and anabolic growth of T cells.
SOCE controls expression of glycolytic and mitochondrial enzymes in T cells
We next investigated if SOCE regulates glycolysis by additional mechanisms besides controlling glucose uptake. Stimulation of WT T cells caused pronounced upregulation not only of Slc2a1 and Slc2a3, but also several glycolytic enzymes including hexokinase 2 (Hk2), aldolase A (Aldoa), phosphoglycerate kinase 1 (Pgk1) and enolase 1 (Eno1) (Figure 4A,B). This induction was completely abolished in SOCE-deficient T cells and T cells treated with FK506 (Figure 4B). The transcription of many of these enzymes is controlled by metabolic ‘master regulators’ such as c-Myc, HIF-1α and IRF4 (Buck et al., 2015; Man et al., 2013; Wang et al., 2011). We found that transcripts of Myc, Irf4 and Hif1a were strongly induced in WT T cells upon TCR stimulation but not in SOCE-deficient or FK506-treated T cells (Figure 5C). To understand the temporal relationship between expression of metabolic regulators, glucose transporters and glycolytic enzymes, we quantified their transcripts over a period of 72 h after stimulation (Figure S4D–G). Myc and Irf4 were rapidly induced in a SOCE-dependent manner (Figure S4D), whereas Slc2a1, Slc2a3 (Figure S4E), Hk2, Aldoa and Pgk1 (Figure S4F) showed a delayed induction, consistent with the possibility that SOCE regulates glucose transporter and glycolytic gene expression through Myc and Irf4 induction.
Figure 4. SOCE and calcineurin regulate expression of glycolytic and mitochondrial enzymes.

(A) Pathway map of glycolytic enzymes and the electron transport chain (ETC) in mitochondria. (B and C) Expression of (B) glycolytic enzymes and (C) transcriptional regulators of glycolysis by qRT-PCR in WT and Stim1fl/flStim2fl/flCd4cre (Stim1/2CD4) CD4+ T cells before and 36 h after αCD3 and αCD28 stimulation in the presence or absence of 1 μM FK506. Means ± SEM of 3 mice. (D and E) WT and Stim1/2CD4 CD4+ T cells stimulated as in (B) were analyzed for their (D) mitochondrial volume using MitoView Green by flow cytometry and (E) mitochondrial DNA (mtDNA) copy number by qPCR; mtDNA was normalized to nuclear DNA. Data in D and E represent means ± SEM of 3 mice. (F and G) ETC complex expression in WT and Stim1/2CD4 (DKO) CD4+ T cells stimulated as in (B). (F) Representative immunoblots and (G) densitometric analyses of 3 repeat experiments; shown are means ± SEM. (H) ATP levels in CD4+ T cells from WT and Stim1/2CD4 mice stimulated and analyzed by LC-MS as described in Figure 2J and 2K; means ± SEM of 3–4 mice. (I) Pprc1 gene expression in CD4+ T cells from WT and Stim1/2CD4 mice stimulated as in (B); means ± SEM of 3 mice. Data in B–G are representative of at least 2 independent repeat experiments. See also Figure S4.
Figure 5. NFAT controls the metabolic reprogramming of T cells.

(A) In silico analysis of Irf4 and Slc2a3 genes in CD8+ T cells for chromatin accessibility measured by DNase I hypersensitivity analysis (Bevington et al., 2016) and ATAC sequencing (Mognol et al., 2017) and binding of NFATc1 (Klein-Hessling, 2017) and NFATc2 (Martinez et al. 2015). (B) Luciferase reporter analyses of the Slc2a3 promoter (Prom.) with or without the –16 kb regulatory element in HEK293T cells. Cells were stimulated with PMA and ionomycin in the presence or absence of CsA; means ± SEM of 6–11 independent transfections. (C and D) Analysis of Irf4, Hif1a, Slc2a3 and Hk2 gene expression by qRT-PCR in CD4+ T cells from (C) WT and Nfatc1fl/flNfatc2−/−Cd4cre mice and (D) WT and Rosa26LSL-caNfatc1 dLckcre (caNfatc1KI) mice. Data represent the means ± SEM of 3–4 mice. (E and F) Analysis of (E) GLUT3 expression by flow cytometry and (F) expansion of primary mouse CD4+ T cells after deletion of Slc2a3 (GLUT3) with small guide (sg) RNAs. Shown in (F) are the ratios of T cells transduced with control or Slc2a3-specific sgRNAs compared to non-transduced T cells following αCD3 and αCD28 stimulation; means ± SEM of 4 mice. (G–I) Rescue of (G) IRF4 expression, (H) GLUT1 expression and (I) 2-NBDG uptake by retroviral transduction of WT and Stim1fl/flStim2fl/flCd4cre (Stim1/2CD4) CD4+ T cells with caNFATc1 or empty control vector; means ± SEM of 3–4 mice. (J–L) Partial rescue of the clonal expansion of adoptively transferred LCMV-specific, SOCE-deficient T cells by retroviral expression of caNFATc1 or GLUT1. (J) Experimental design, (K) flow cytometric analyses of the frequencies and (L) absolute numbers of caNFATc1 or GLUT1 transduced CD4+ T cells from WT and Stim1/2CD4 SMARTA mice 8 d after LCMV infection; means ± SEM of 7–8 host mice from 3 independent experiments. See also Figure S5.
Because T cell stimulation also enhanced mitochondrial respiration, which was impaired in the absence of SOCE (Figure 2), we investigated the role of SOCE in mitochondrial metabolism in T cells. Whereas the volume of mitochondria in WT T cells increased ~2-fold upon stimulation, no such increase was observed in SOCE-deficient T cells or T cells treated with FK506 (Figure 4D). By contrast, mitochondrial numbers increased to a similar degree in WT and SOCE-deficient T cells upon stimulation (Figure 4E). We next analyzed mitochondrial electron transport chain (ETC) complexes. TCR stimulation increased the expression of components of all 5 ETC complexes in WT T cells, whereas the expression of complexes I, II and IV was strongly impaired in T cells of Stim1fl/flStim2fl/fCd4cre mice and WT T cells treated with FK506 (Figures 4F and 4G). This defect correlated with blunted ATP production by SOCE-deficient and FK506-treated WT T cells (Figure 4H). Expression of mitochondrial ETC complexes is regulated by the PGC-1 family of transcriptional co-regulators that includes PGC-1α, PGC-1β and PPRC1 (Scarpulla, 2011). While we did not detect Ppargc1a (PGC-1α) mRNA expression in WT T cells and only low amounts of Ppargc1b (PGC-1β) mRNA (Figure S4H), we observed robust induction of Pprc1 (PPRC1) upon stimulation (Figure 4I and S4H) that was dependent on SOCE and calcineurin (Figure 4I). Taken together, SOCE and calcineurin regulate the metabolic reprogramming of T cells by controlling expression of genes required for aerobic glycolysis and mitochondrial respiration.
SOCE and calcineurin control metabolic reprogramming of T cells through NFAT
To understand how SOCE and calcineurin control the metabolic reprogramming of T cells, we analyzed the transcriptional regulation of glucose transporters, glycolytic enzymes and regulators of glycolysis whose expression we had found to be SOCE and calcineurin dependent. In silico analyses of common transcription factor binding motifs revealed the presence of consensus NFAT binding motifs in the regulatory regions of Slc2a1, Slc2a3, Hk2, Aldoa, Pgk1, Eno1 as well as Myc, Irf4 and Hif1a. Analysis of DNase I hypersensitivity (Bevington et al., 2016) and ATAC-sequencing (Mognol et al., 2017) data from naïve and activated CD8+ T cells revealed open chromatin regions in the regulatory regions of Irf4, Slc2a3 (Figure 5A) as well as Hif1a, Myc, Slc2a1 and Hk2 (Figure S5A). To determine if NFAT binds to these open chromatin regions, we analyzed genome-wide ChIP-sequencing (ChIP-seq) data that report on the binding of NFATc2 in WT (and Nfatc2-deficient) CD8+ T cells (Martinez et al., 2015) and NFATc1 in activated CD8+ T cells from a NFATc1 BAC-transgenic mouse line (Klein-Hessling, 2017). We found strong binding of both NFATc1 and NFATc2 within open chromatin regions in the promoters of Irf4 and Hif1a as well as in regulatory elements downstream of the Irf4 gene (Figure 5A and S5A). NFAT was shown to regulate Myc expression through a proximal promoter element (Mognol et al., 2016); however, we did not observe strong NFAT binding within the Myc proximal promoter in CD8+ T cells (Figure S5A). We further analyzed the binding of NFAT to regulatory regions of Slc2a1, Slc2a3 and glycolytic genes to determine if SOCE regulates expression of these genes directly through NFAT. Most of these genes, including Slc2a1, showed no or only weak NFAT binding (Figure S5A and data not shown), suggesting that they are not directly regulated by NFAT. However, both NFATc1 and NFATc2 bound to an intronic region of the Hk2 gene and to the promoter as well as a putative upstream regulatory element (–16 kb) in the Slc2a3 gene (Figure 5A and S5A).
We tested the ability of the Hk2 intronic element, the Slc2a3 promoter and the Slc2a3 –16 kb upstream regulatory element to activate luciferase reporter gene (Luc) expression in vitro (Figure 5B). The activity of the Slc2a3 promoter was induced by stimulation and was sensitive to CsA. Similar results were obtained using the Slc2a3 –16 kb upstream regulatory element when placed upstream of the Slc2a3 promoter (Figure 5B), suggesting that GLUT3 expression is regulated directly by NFAT. By contrast, no inducible Luc expression by the Hk2 intronic element was observed (data not shown). To further analyze the role of NFAT in the regulation of Slc2a3 and glycolytic genes, we analyzed T cells from Nfatc1fl/flNfatc2−/−Cd4cre mice (Vaeth et al., 2012) and Rosa26LSL-caNfatc1 dLckcre mice that expressed a constitutive-active form of NFATc1 (caNFATc1) in peripheral T cells (Baumgart et al., 2014) (Figure 5C, 5D, S5B and S5C). TCR-induced expression of genes that showed NFATc1 and NFATc2 binding to their regulatory regions, including Irf4, Hif1a, Slc2a3 and Hk2 (Figure 5A and S5A), was strongly impaired in T cells from Nfatc1fl/flNfatc2−/−Cd4cre mice (Figure 5C), whereas expression of genes with no or only weak NFAT binding, including Myc and Slc2a1, was less affected by the loss of NFATc1 and NFATc2 (Figure S5B). It is noteworthy that FK506 treatment further suppressed the induction of all four NFATc1 and NFATc2-dependent genes (Figure 5C and S5B), which could be due to NFATc3 expression in T cells, NFAT-independent effects of FK506 (Dutta et al., 2017; Frischbutter et al., 2011) or inhibition of the PI3K-AKT-mTOR pathway as shown further below (Figure 6A–D). By contrast, T cells expressing caNFATc1 had significantly increased expression of Irf4, Hif1a, Slc2a1, Slc2a3 and Hk2 after stimulation compared to WT T cells, which was not inhibitable by FK506 (Figure 5D and S5C), indicating that expression of these genes is regulated by NFATc1. Whereas GLUT1 is known to regulate glucose uptake and proliferation of T cells (Macintyre et al., 2014) and is highly expressed in activated T cells (Figure S4C), the role of GLUT3 in T cells is not well defined. We found that ablation of GLUT3 expression by CRISPR/Cas9 gene editing (Figure 5E) impaired the TCR-induced expansion of T cells in vitro (Figure 5F) suggesting that GLUT3 contributes to glucose uptake and proliferation of T cells in addition to GLUT1.
Figure 6. SOCE is required for TCR-induced AKT-mTOR pathway activation but not cytokine signaling.

(A–D) Protein phosphorylation of (A) AKT on serine 473 (p-AKTS473), (B) AKT on threonine 308 (p-AKTT308), (C) mTOR on serine 2448 (p-mTORS2448) and (D) S6 on serine S235/236 (p-S6S235/236) in CD4+ T cells from WT and Stim1fl/flStim2fl/flCd4cre (Stim1/2CD4) mice 24 h after αCD3 and αCD28 stimulation in the presence or absence of 1 μM FK506 or IL-2 and IL-7 by flow cytometry; means ± SEM of 3–4 mice. (E–G) Analysis of (E) T cell proliferation by CFSE dilution, (F) NFATc1 nuclear translocation by confocal microscopy and (G) glycolytic gene expression by qRT-PCR (means ± SEM of 3–4 mice) of WT and Stim1/2CD4 CD4+ T cells 3 d after αCD3 and αCD28 stimulation in the presence or absence of IL-2, IL-7 or both. Data in (A–E) are representative of 2–3 repeat experiments. Percentages of NFATc1 localization in (F) are means ± SEM of >100 cells from 3 repeat experiments. See also Figure S6.
We further assessed the contribution of NFAT to the expression of glycolytic genes, glucose uptake and antigen-dependent T cell proliferation by ectopically expressing caNFATc1 in T cells from Stim1fl/flStim2fl/fCd4cre mice. Expression of caNFATc1 restored the expression of IRF4 (Figure 5G) and GLUT1 (Figure 5H) in SOCE-deficient T cells, although not completely. Since we did not observe NFAT binding to the Slc2a1 promoter, the effects of caNFATc1 on GLUT1 expression are likely indirect. Importantly however, ectopic expression of caNFATc1 in SOCE-deficient T cells completely normalized glucose uptake (Figure 5I) comparable to the rescue achieved by ectopic expression of GLUT1 (Figure S5D,E). To test if ectopically expressed caNFATc1 or GLUT1 can restore proliferation of SOCE-deficient T cells in vivo, we retrovirally transduced CD4+ T cells from WT or Stim1fl/flStim2fl/fCd4cre SMARTA mice with caNFATc1 or GLUT1 and injected them into congenic WT host mice infected with LCMV (Figure 5J). Transduction of SOCE-deficient T cells with either caNFATc1 or GLUT1 markedly increased the clonal expansion of LCMV-specific T cells in host mice (Figure 5K and 5L). A similar partial rescue was achieved by overexpression of IRF4 or c-Myc (Figure S5F–G). Collectively, these findings demonstrate that NFATc1 is a critical transcriptional regulator of glycolytic gene expression downstream of SOCE.
SOCE and calcineurin regulate the PI3K-AKT-mTOR pathway in T cells
In contrast to inhibition of SOCE or calcineurin, deletion of Nfatc1 and Nfatc2 only partially reduced glycolytic gene expression in T cells. We hypothesized that SOCE and calcineurin control glycolysis through additional, NFAT-independent pathways. The PI3K-AKT-mTOR pathway promotes aerobic glycolysis and thereby T cell growth and proliferation upon TCR and CD28 stimulation (Buck et al., 2015). We did not observe differences in mRNA expression of PI3K-AKT-mTOR pathway-related genes in resting T cells of WT and Stim1fl/flStim2fl/fCd4cre mice and only a moderate reduction of Pdk1, Mtor and the mTOR targets Mdm2 and Rps6 in stimulated SOCE-deficient T cells compared to WT T cells (data not shown). By contrast, lack of SOCE or calcineurin activity resulted in pronounced defects in the phosphorylation of AKT (on S473 and T308), mTOR (on S2448) and S6 ribosomal protein (on S235/236) (Figure 6A–D) after stimulation of Stim1fl/flStim2fl/fCd4cre T cells and FK506-treated T cells. These defects in the posttranslational activation of the PI3K-AKT-mTOR pathway likely contribute to the impaired glycolysis and proliferation of SOCE-deficient T cells.
Homeostatic T cell proliferation is not dependent of SOCE
Despite the defects in TCR-induced proliferation, Stim1fl/flStim2fl/fCd4cre mice have normal thymic development of conventional αβ T cells and normal or increased numbers of peripheral T cells (Oh-Hora et al., 2008). The thymic development and homeostatic proliferation of T cells in the periphery is dependent on IL-7 (Akashi et al., 1998), which has been shown to induce GLUT1 expression and glycolysis (Jacobs et al., 2010). Addition of IL-7 (Figure 6E) or IL-2 (Figure 6E and Figure S1) alone did not restore proliferation of SOCE-deficient T cells. However, the combination of IL-2 and IL-7 markedly enhanced the expansion of SOCE-deficient T cells in vitro (Figure 6E). IL-7 and IL-2 were shown to activate NFATc1 through alternative, Ca2+ and calcineurin-independent mechanisms in thymocytes and naïve CD8+ T cells, respectively (Cho et al., 2013; Patra et al., 2013). We therefore tested if IL-2 and IL-7 can trigger NFAT activation in T cells from Stim1fl/flStim2fl/fCd4cre mice independently of SOCE and calcineurin. NFATc1 translocation to the nucleus was strongly impaired in SOCE-deficient compared to WT T cells after stimulation with αCD3 and αCD28 antibodies (Figure 6F). Addition of IL-2 and IL-7 markedly restored NFATc1 translocation in SOCE-deficient T cells (Figure 6F). TCR stimulation in the presence of IL-2 and IL-7 (but not either cytokine alone) also rescued the expression of Slc2a1, Slc2a3, Hk2, Myc and Irf4 in SOCE-deficient T cells (Figure 6G and S6A). These effects of IL-2 and IL-7 were mediated at least in part through the PI3K-AKT-mTOR pathway as IL-2 and IL-7 treatment partially restored phosphorylation of mTOR (on S2448) and S6 (on S235/236) in stimulated SOCE-deficient T cells (Figure 6A–D). Collectively, these data demonstrate that IL-2 and IL-7 mediate non-redundant signals that promote the metabolic reprogramming of T cells independent of SOCE, thus providing an explanation why SOCE-deficient mice and patients have normal numbers of T cells despite their defect in antigen-dependent proliferation.
The role of SOCE in T cell proliferation and metabolism is conserved in human
T cells from patients with null mutations in ORAI1 or STIM1 have reduced proliferative responses after TCR stimulation with αCD3, mitogens and microbial antigens (Lacruz and Feske, 2015). We therefore investigated if SOCE is also required for the metabolic reprogramming of human T cells. Inhibition of SOCE with the CRAC channel inhibitor BTP2 impaired GLUT1 protein expression and inhibited glucose uptake of stimulated human T cells (Figure S6B and S6C). We next investigated the function and glycolysis of peripheral T cells of a patient homozygous for a missense mutation in STIM1 (c.1121T>C; p.L374P) that abolishes SOCE (Figure 7A). The patient suffered from combined immunodeficiency characterized by recurrent infections and non-immunological symptoms including anhidrotic ectodermal dysplasia and myopathy that are typical of CRAC channelopathy (Lacruz and Feske, 2015). Although the patient had normal numbers of peripheral T cells, clinical testing of the patient’s PBMCs showed impaired lymphocyte proliferation in response to mitogens and vaccine-derived antigens (Rubella, Mumps, Measles, CMV, HSV and Candida) (data not shown). In addition, his CD4+ T cells failed to proliferate in response to αCD3 and αCD28 stimulation in vitro, similar to FK506-treated T cells from a healthy donor (Figure 7B). The patient’s T cells did not increase in size (Figure 7C), lacked upregulation of GLUT1 expression (Figure 7D) and showed reduced glucose uptake (Figure 7E) upon stimulation. Besides impaired induction of SLC2A1 expression, stimulated STIM1-deficient human T cells showed impaired expression of the glycolytic enzymes HK2 and PGK1 (Figure 7F) and the transcriptional regulators MYC, IRF4 and PPRC1 (Figure 7G). Taken together, these data demonstrate that SOCE and calcineurin have conserved roles in the metabolic reprogramming of mouse and human T cells.
Figure 7. Conserved role of SOCE in glucose metabolism in human T cells.

(A) Analysis of SOCE following thapsigargin (TG) stimulation in CD4+ T cells from a healthy donor (Mother) and a patient homozygous for a null mutation in STIM1 (p.L374P). (B) CFSE dilution of healthy donor and STIM1 p.L374P patient CD4+ T cells 3 d after αCD3 and αCD28 stimulation in the presence or absence of 1 μM FK506. (C–E) Analysis of (C) cell size (FSC-A), (D) GLUT1 protein expression and (E) uptake of 2-NBDG by flow cytometry. CD4+ T cells from the healthy donor and STIM1 p.L374P patient were stimulated for 24 h with αCD3 and αCD28 in the presence or absence of 1 μM FK506. (F and G) Analysis of (F) SLC2A1, HK2 and PGK1 and (G) MYC, IRF4 and PPRC1 gene expression in CD4+ T cells of a healthy donor and the STIM1 p.L374P patient stimulated as in (B). See also Figure S6.
DISCUSSION
We here report that SOCE and calcineurin control the TCR-induced proliferation of T cells through metabolic reprogramming. We identified NFAT as a critical SOCE and calcineurin-regulated transcription factor that controlled expression of glucose transporters, glycolytic enzymes and transcriptional regulators of glycolysis. In addition, SOCE and calcineurin regulated the activity of the PI3K-AKT-mTOR pathway and mitochondrial function. Calcineurin inhibition is used extensively in clinical medicine to prevent allotransplant rejection and treat certain autoimmune diseases (Azzi et al., 2013). Despite the decades-long use of CsA and tacrolimus, a satisfying molecular mechanism how calcineurin inhibition regulates T cell proliferation is missing (Azzi et al., 2013). Two of the main explanations are that Ca2+ and calcineurin regulate T cell proliferation by controlling IL-2 production or promoting cell cycle progression. IL-2 was first identified as an auto- and paracrine growth factor for T cells and has been shown to promote the differentiation of T cells into defined effector T cell subsets (Boyman and Sprent, 2012). T cells of patients with null muations in ORAI1 or STIM1 lack SOCE and IL-2 production upon TCR stimulation. However, addition of exogenous IL-2 has had variable effects on their ability to proliferate in vitro (Feske et al., 1996; Fuchs et al., 2012; Picard et al., 2009; Schaballie et al., 2015). Similarly, the proliferation of murine T cells lacking STIM1 and STIM2 could not be restored by exogenous IL-2 in vitro and they failed to proliferate in response to LCMV infection in vivo even when transferred to immunocompetent (i.e. IL-2 producing) WT host mice. Lack of IL-2 production therefore is not the primary cause of impaired proliferation of SOCE- or calcineurin-deficient T cells. NFAT was reported to promote T cell proliferation by regulating the expression and function of cell cycle genes, including cyclins and cyclin-dependent kinases (Mognol et al., 2016). The Ca2+ channels promoting Ca2+ signaling and cell cycle progression remain ill-defined, but a recent report has implicated SOCE in the regulation of the G1/S checkpoint (Chen et al., 2016). Our finding that SOCE-deficient and FK506-treated T cells failed to enter the cell cycle and remained in G0 phase after TCR stimulation suggests that SOCE controls cell cycle entry in T cells at an even earlier checkpoint.
Cell cycle entry and clonal expansion of T cells depend on the availability of nutrients and the ability of T cells to switch to anabolic metabolism. Quiescent T cells have minimal nutrient uptake and biosynthesis, basal glycolytic rate and effective oxidative phosphorylation (Buck et al., 2015; Pearce et al., 2013). Upon antigen encounter, T cells switch to a high rate anabolic metabolism that supports the synthesis of macromolecules required for growth and cell division that is mainly fueled by the uptake of extracellular glucose and aerobic glycolysis. We found that this glycolytic switch was regulated by SOCE and calcineurin, which controlled the expression of the glucose transporters GLUT1 and GLUT3 and many glycolytic enzymes. Defective glucose uptake and utilization in SOCE- and calcineurin-deficient T cells resulted in a dramatic reduction of many glycolytic metabolites including nucleotides and amino acids. Lack of adequate nutrient supply imposes cell cycle arrest (Foster et al., 2010), explaining why SOCE- and calcineurin-deficient T cells fail to proliferate. Consequentially, ectopic expression of GLUT1 in SOCE-deficient T cells restored T cell proliferation, albeit incompletely.
SOCE and calcineurin regulated the metabolic reprogramming of T cells predominantly through NFAT. The expression of Slc2a1, Slc2a3, Hk2 and other glycolytic enzymes was abolished in SOCE-deficient and FK506-treated T cells. Likewise, deletion of NFATc1 and NFATc2 strongly attenuated the expression of these genes. Expression of a constitutively active form of NFATc1, on the other hand, enhanced transcription of all four genes demonstrating that NFAT is a critical regulator of glycolytic gene expression in T cells. This regulation is both direct through NFAT binding to promoter and enhancer elements of glycolysis genes, and indirect through NFAT-dependent expression of transcription factors that function as regulators of glycolytic metabolism such as c-Myc (Wang et al., 2011), IRF4 (Man et al., 2013) and HIF-1α (Shi et al., 2011). Although we found NFAT binding motifs in the regulatory elements of most SOCE-regulated glycolytic genes, evidence of robust NFAT binding from ChIP-Seq data was restricted to Irf4, Hif1a, Hk2 and Slc2a3. NFATc1 and NFATc2 bound to the promoter and a -16 kb distal enhancer region of the Slc2a3 gene and GLUT3 expression was strongly reduced in T cells from Nfatc1fl/flNfatc2−/−Cd4cre mice. Conversely, the expression of Slc2a3 was increased in T cells of knock-in mice expressing caNFATc1. Together with the observation that deletion of Slc2a3 expression impairs T cell proliferation, these findings suggest that GLUT3 is a directly NFAT-regulated glucose transporter in murine T cells that promotes glycolysis and T cell proliferation.
SOCE and calcineurin furthermore regulated the metabolic reprogramming of T cells indirectly by controlling the expression of transcriptional regulators of glycolysis. TCR stimulation resulted in the SOCE-dependent induction of Myc, Hif1a and Irf4 within a few hours preceding the expression of Slc2a1, Slc2a3 and glycolytic enzymes, suggesting that SOCE may regulate the glycolytic switch of T cells indirectly. c-Myc broadly induces expression of glycolytic and glutaminolytic enzymes as well as regulators of lipid, amino acid and nucleotide synthesis (Wang et al., 2011). Similarly, IRF4 and HIF-1α were shown to promote expression of genes regulating metabolism, in particular glycolysis (Man et al., 2013; Shi et al., 2011; Wang et al., 2011). NFATc1 and NFATc2 bind to the promoters of Irf4 and Hif1a and the expression of HIF-1α and IRF4 was strongly reduced in T cells of Nfatc1fl/flNfatc2−/−Cd4cre mice, but increased in T cells expressing caNFATc1. By contrast, we did not find evidence of direct regulation of Myc by NFAT in T cells despite previous reports of NFAT binding to the Myc promoter in various cell types (Mognol et al., 2016) and a recent study suggesting that NFAT induces transcription of Myc in T cells (Mak et al., 2017). GLUT1, although expressed in a SOCE-dependent manner, appears to be an indirect NFAT target as no direct NFAT binding to regulatory elements in Slc2a1 was detected. Collectively, our data demonstrate that SOCE and calcineurin control the glycolytic reprogramming of T cells directly and indirectly through NFAT-regulated expression of glucose transporters, glycolytic enzymes and transcriptional regulators of glycolysis.
SOCE and calcineurin also regulated other aspects of T cell metabolism, providing an explanation why expression of caNFATc1 in SOCE-deficient T cells only partially restored proliferation. First, we found that the activity of the PI3K-AKT-mTOR pathway is impaired in SOCE-deficient T cells after TCR stimulation as phosphorylation of AKT, mTOR and the ribosomal S6 protein was strongly reduced. Activation of the PI3K-AKT-mTOR pathway by SOCE is consistent with recent reports of AKT regulation by the Ca2+ and calmodulin-dependent protein kinase IV (CaMK4) in T helper-17 (Th17) cells (Koga et al., 2014) and mTORC1 activation by lysosomal Ca2+ release and CaM binding in non-immune cells (Li et al., 2016). In addition, inhibition of calcineurin was reported to block phosphorylation of the mTOR target S6 (Mak et al., 2017). The mechanisms underlying the crosstalk between the SOCE-calcineurin and PI3K-AKT-mTOR pathways in T cells remain to be elucidated. Second, the role of SOCE and calcineurin in T cell metabolism was not limited to glycolysis but also included mitochondrial function. SOCE-deficient T cells failed to increase mitochondrial size, expression of ETC complexes I, II and IV, mitochondrial respiration and ATP production upon TCR stimulation. These defects were associated with decreased expression of PPRC1, suggesting that SOCE may control mitochondrial biogenesis at the transcriptional level. Impaired mitochondrial function of SOCE-deficient T cells is consistent with similar findings in fibroblasts (Maus et al., 2017), pointing to a conserved role of SOCE in mitochondrial function in different tissues. To which degree defects in mitochondrial function contribute to the impaired proliferation of SOCE-deficient T cells remains to be elucidated.
Despite abolished antigen-induced T cell proliferation, Stim1fl/flStim2fl/fCd4cre mice and patients with null mutations in STIM1 and ORAI1 have normal numbers of CD4+ and CD8+ T cells, suggesting that the development and homeostatic proliferation of T cells is independent of SOCE. T cell development in the thymus and the survival of naïve and memory T cells requires IL-7, which was shown to induce GLUT1 expression and glycolysis in T cells (Jacobs et al., 2010). We found that IL-7, together with IL-2, can restore the TCR-induced proliferation of SOCE-deficient T cells. This rescue was associated with increased expression of glucose transporters, glycolytic enzymes and metabolic regulators as well as partially restored mTOR activity. IL-7 was shown to activate NFATc1 through an alternative, Ca2+ and calcineurin-independent mechanism in thymocytes (Patra et al., 2013) similar to IL-2-mediated activation of NFATc1 in naïve CD8+ T cells (Cho et al., 2013). Indeed, we observed nuclear translocation of NFATc1 in stimulated SOCE-deficient T cells in the presence of IL-2 and IL-7, demonstrating that both cytokines synergize to promote NFAT activation, glycolysis and proliferation of T cells independent of SOCE. Although SOCE is essential for TCR-induced proliferation, cytokine-mediated (homeostatic) expansion of T cells is possible in its absence and likely explains why SOCE-deficient mice and human patients have normal overall T cell numbers but reduced numbers of antigen-specific T cells (Lacruz and Feske, 2015; Vaeth et al., 2016). The mechanisms by which SOCE and calcineurin regulate the glycolytic reprogramming of TCR-stimulated T cells are conserved in humans. SOCE-deficient T cells of an immunodeficient patient with a null mutation in STIM1 failed to upregulate GLUT1, HK2, c-Myc and IRF4 expression, resulting in reduced glucose uptake. These defects likely explain impaired T cell proliferation of SOCE-deficient patients and contribute to their immunodeficiency.
Our study reveals essential molecular mechanisms by which SOCE, calcineurin and NFAT control T cell function and explains why calcineurin inhibitors are potent immunosuppressants in organ transplantation, graft-vs-host disease and certain forms of autoimmunity.
STAR METHODS
KEY RESOURCES TABLE
| REAGENT or RESOURCE | SOURCE | IDENTIFIER |
|---|---|---|
| Antibodies | ||
| anti-mouse CD3 (clone 2C11) | BioXCess | Cat# BE0001-1 |
| anti-mouse CD28 (clone 37.51) | BioXCess | Cat# BE0015-1 |
| anti-human CD3 (clone OKT3) | eBioscience | Cat# MA1-10175 |
| anti-human CD28 (clone CD28.2) | eBioscience | Cat# MA1-10166 |
| anti-mouse FcγRII/FcγRIII (clone 4G8) | eBioscience | Cat# MA5-16679 |
| anti-mouse CD4 (clone GK1.5) | eBioscience | Cat# 48-0041-82 |
| anti-mouse CD8 (clone 53-6.7) | eBioscience | Cat# 48-0081-82 |
| anti-mouse TCR Vα2 (clone B20.1) | eBioscience | Cat# 12-5812-82 |
| anti-mouse/human CD44 (clone IM7) | eBioscience | Cat# 11-0441-82 |
| anti-mouse CD45.1 (clone A20) | eBioscience | Cat# 11-0453-82 |
| anti-mouse CD45.2 (clone 104) | eBioscience | Cat# 17-0454-82 |
| anti-mouse/human Ki-67 (clone SolA15) | eBioscience | Cat# 12-5698-82 |
| Total Oxphos Rodent WB antibody cocktail | MitoSciences | Cat# ab110413 |
| HRP-conjugated anti-mouse IgG | Sigma Aldrich | Cat# A9044 |
| Alexa647-conjugated anti-rabbit-IgG | Molecular Probes | Cat# A-21245 |
| Alexa555-conjugated anti-mouse-IgG | Molecular Probes | Cat# A-21422 |
| anti-mouse/human GLUT1 (polyclonal) | Abcam | Cat# ab115730 |
| anti-mouse GLUT3 (polyclonal) | Abcam | Cat# ab136180 |
| anti-mouse phospho-AKT Thr308 (clone D25E6) | Cell Signaling Technology | Cat# 13038S |
| anti-human/mouse phospho-AKT Ser473 (clone SDRNR) | eBioscience | Cat# 17-9715-42 |
| anti- human/mouse phospho-mTor Ser2448 (clone MRRBY) | eBioscience | Cat# 50-9718-42 |
| anti- human/mouse phospho-S6 Ser235/236 (clone cupk43k) | eBioscience | Cat# 17-9007-42 |
| anti-human/mouse NFATc1 (clone 7A6) | Abcam | Cat# ab2796 |
| Bacterial and Virus Strains | ||
| LCMV Armstrong strain | Shaw et al., 2014 | N/A |
| Biological Samples | ||
| STIM1 p.L374P patient samples | This study | N/A |
| Healthy donor samples | This study | N/A |
| Chemicals, Peptides, and Recombinant Proteins | ||
| Recombinant mouse IL-7 | Peprotech | Cat# 217-17 |
| Recombinant human IL-2 | Peprotech | Cat# 200-02 |
| FK506 (tacrolimus) | Sigma Aldrich | CAS 109581-93-3 |
| Ionomycin | Calbiochem | CAS 56092-82-1 |
| Phorbol 12-myristate 13-acetate (PMA) | Calbiochem | CAS 16561-29-8 |
| 2-Desoxy-Glucose (2-DG) | Sigma Aldrich | CAS 154-17-6 |
| 3,5-bis(trifluoromethyl)pyrazole (BTP2) | Calbiochem | CAS 223499-30-7 |
| polybrene | SantaCruz | Cat# sc-134220 |
| GeneJet transfection reagent | Thermo Fisher Scientific | Cat# SL100488 |
| IC Staining Buffer Kit | eBioscience | Cat# 00-5523-00 |
| CellTrace CFSE | Molecular Probes | Cat# C34554 |
| Oligomycin A | Sigma Aldrich | CAS 579-13-5 |
| Carbonyl cyanide-p-trifluoromethoxyphenylhydrazone (FCCP) | Sigma Aldrich | CAS 370-86-5 |
| Rotenone | Sigma Aldrich | CAS 83-79-4 |
| Antimycin A | Sigma Aldrich | CAS 1397-94-0 |
| 2-(N-(7-Nitrobenz-2-oxa-1,3-diazol-4-yl)Amino)-2-Deoxyglucose (2-NBDG) | Thermo Fisher Scientific | Cat# N13195 |
| tritiated 2-Desoxy-Glucose (3H-2-DG) | PerkinElmer | Cat# NET328A001MC |
| Ultima Gold scintillation cocktail | PerkinElmer | Cat# 6013329 |
| Antibody diluent | DAKO | Cat# S0809 |
| Fluoromount G | Southern Biotechnology | Cat# 0100-01 |
| Fura-2-AM | Molecular Probes | CAS 108964-32-5 |
| Thapsigargin | Calbiochem | CAS 67526-95-8 |
| Trizol | Invitrogen | Cat# 15596018 |
| Critical Commercial Assays | ||
| EasyStep Mouse CD4+ T cell Enrichment kit | STEMCELL Technologies | Cat# 19852 |
| Human CD4+ MicroBeads | Miltenyi Biotec | Cat# 130-045-101 |
| FlexiGene DNA isolation kit | Qiagen | Cat# 51206 |
| Maxima SYBR Green qPCR Master Mix | Thermo Fisher Scientific | Cat# K0222 |
| Glucose (HK) Assay Kit | Sigma Aldrich | Cat# GAHK20-1KT |
| RNeasy Micro Kit | Quiagen | Cat# 74004 |
| iScript cDNA synthesis kit | Bio-Rad | Cat# 1708891 |
| Deposited Data | ||
| NFATc2 ChIP-seq data | Martinez et al., 2015 | N/A |
| NFATc1 ChIP-seq data | Klein-Hessling, 2017 | N/A |
| DNase I hypersensitivity sequencing data | Bevington et al., 2016 | N/A |
| ATAC-seq data | Mognol et al., 2017 | N/A |
| Experimental Models: Cell Lines | ||
| Platinum-E retroviral packaging cell line | Cell Biolabs Inc. | Cat# RV-101 |
| HEK 293T cell line | ATCC | Cat# CRL-1573 |
| Experimental Models: Organisms/Strains | ||
| Stim1fl/flStim2fl/flCd4cre (Stim1/2CD4) mice | Oh-Hora et al., 2008 | N/A |
| Nfactc1fl/flNfatc2−/−Cd4cre (Nfatc1/Nfatc2CD4) mice | Vaeth et al., 2012 | N/A |
| Rosa26LSL-caNfatc (caNfatc1KI) mice | Baumgart et al., 2014 | N/A |
| dLck-cre mice | Lee et al., 2010 | N/A |
| CD45.1+ Stim1/2CD4 SMARTA mice | Vaeth et al., 2016 | N/A |
| WT CD45.1+ C57BL/6 mice | Jackson Laboratories | Cat# 002014 |
| WT CD45.2+ C57BL/6 mice | Jackson Laboratories | Cat# 000664 |
| Cas9fl/fl mice | Jackson Laboratories | Cat# 024858 |
| Cd4-cre mice | Jackson Laboratories | Cat# 017336 |
| Oligonucleotides | ||
| See Table S1 for qRT-PCR primer sequences | N/A | N/A |
| Recombinant DNA | ||
| MIGR-caNFATc1-IRES-GFP | Gomez-Rodriguez et al., 2009 | N/A |
| pMIGR-Slc2a1-IRES-VEX | J. Wherry (University of Pennsylvania, Philadelphia, PA) | N/A |
| pMIG-IRF4 | Addgene | Cat# 58987 |
| pMIG-Myc | Addgene | Cat# 58987 |
| pSIN sgRNA vector | M. Aichinger and J. Zuber (Vienna Biocenter, Vienna, Austria) | N/A |
| Software and Algorithms | ||
| Flowjo v.8.7 and v.10.0.8r1 | FlowJo, LLC | https://www.flowjo.com/ |
| Prism 7 | GraphPad | http://www.graphpad.com |
| IGV 2.3.82 | Broad Institute | software.broadinstitute.org/software/igv/ |
| Illustrator CS5 | Adobe Systems Inc. | N/A |
| Photoshop CS5 | Adobe Systems Inc. | N/A |
| LCS software package | Leica | N/A |
| ImageJ | NIH | https://imagej.nih.gov/ij/ |
| Other | ||
| XFe24 Extracellular Flux Analyzer | Seahorse Bioscience | N/A |
| QExactive benchtop orbitrap mass spectrometer | Thermo Fisher Scientific | N/A |
| Dionex UltiMate 3000 UPLC system | Thermo Fisher Scientific | N/A |
| TCS SP5 II confocal microscope | Leica | N/A |
| FlexStation 3 multi-mode microplate reader | Molecular Devices | N/A |
| LSRII flow cytometer | BD Biosciences | N/A |
CONTACT FOR REAGENT AND RESOURCE SHARING
Further information and request for resources and reagents should be directed to Lead Contact Stefan Feske (stefan.feske@nyumc.org). The mouse lines described in this study are available from our laboratory and require a Material Transfer Agreement (MTA).
EXPERIMENTAL MODEL AND SUBJECT DETAILS
Mice
Stim1fl/flStim2fl/flCd4cre mice (Oh-Hora et al., 2008; Shaw et al., 2014), Nfactc1fl/flNfatc2−/−Cd4cre mice (Vaeth et al., 2012) and Rosa26LSL-caNfatc mice (Baumgart et al., 2014) have been described. Congenic CD45.1+CD45.2+ SMARTA mice were generously provided by S. Kaech (Yale University, New Haven, CT). CD45.1+ (strain 002014), CD45.2+ WT (strain 000664), Cas9fl/fl (strain 024858) and Cd4cre (strain 017336) mice were purchased from the Jackson laboratory (Bar Harbor, ME). All animals were on a pure C57BL/6 genetic background. Male and Female mice were used between 8 and 16 weeks of age. Mice were maintained under specific pathogen free conditions in accordance with institutional guidelines for animal welfare approved by the Institutional Animal Care and Use Committee at New York University School of Medicine.
Patient cells
Peripheral blood samples were obtained from a 22y-old male patient and his mother, who are homo- and heterozygous, respectively, for a missense mutation in exon 8 of STIM1 (c. 1121T>C) that results in a single amino acid substitution (p.L374P). Homozygosity for the STIM1 p.L374P mutation abolishes SOCE and causes combined immunodeficiency (CID) characterized by recurrent and chronic viral and bacterial infections as well as non-immunological symptoms including muscular hypotonia, anhidrosis and hypocalcified amelogenesis imperfecta consistent with CRAC channelopathy syndrome (Lacruz and Feske, 2015). The patient’s peripheral T, B and NK cell numbers were within normal range, but T cell proliferation in response to PHA, SAC, Rubella, Mumps, Measles, CMV, HSV and Candida was impaired. A more detailed case report will be published in a forthcoming manuscript.
METHODS DETAILS
Culture of mouse and human T cells
CD4+ T cells and total T cells were isolated from single cell suspensions of spleens and lymph nodes by negative separation using a mouse CD4+ T cell or a total T cell Enrichment kit (both STEMCELL Technologies). T cells were stimulated in RPMI 1640 medium (supplemented with 10% FBS, 2 mM L-glutamine, 50 mM 2-mercaptoethanol and 100 U/ml penicillin plus streptomycin; all Cellgro) with 1 μg/ml plate-bound anti-CD3 (clone 2C11) plus 1 μg/ml anti-CD28 Abs (clone 37.51, both BioXCess) in the presence or absence of 1 μM FK506 (Sigma Aldrich), 10 mM 2-DG (Sigma Aldrich), 5 ng/ml IL-7 (Peprotech), 50 U/ml IL-2 (Peprotech) or left unstimulated as indicated. PBMCs from individuals homozygous (patient) and heterozygous (mother) for a STIM1 p.L374P mutation were isolated from blood samples by density centrifugation using Ficoll-Paque plus (GE Amersham). Human CD4+ T cells were isolated using CD4 MicroBeads (Miltenyi Biotec). PBMCs or purified T cells were stimulated with 1 μg/ml plate-bound anti-CD3 (clone OKT3) and 1 μg/ml anti-CD28 (clone CD28.2, both eBioscience) monoclonal antibodies in the presence or absence of 1 μM FK506 (Sigma Aldrich) or 500 nM BTP2 (Sigma Aldrich) or left unstimulated as indicated.
Reporter gene assays
The murine Slc2a3 promoter (-475/+358) was amplified from genomic DNA using the primers 5′-AAAAGCTTGAAATGTGCCTGCCTCCTGC-3′ and 5′-TTGTCCCCATGGTCCCAACC-3′ and cloned as a HindIII/NcoI fragment matching Slc2a3-ATG with luciferase ATG into the pGL3-Basic backbone (Invitrogen). The -16 kb distal enhancer region of the Slc2a3 gene was amplified by PCR using the primers 5′-AAAAGCTTGAAATGTGCCTGCCTCCTGC-3′ and 5′-TTGTCCCCATGGTCCCAACC-3′ and cloned as a 916 bp NheI/XhoI fragment upstream of the promoter. HEK 293T cell reporter gene assays were performed as described (Vaeth et al., 2014).
Constructs and antibodies
Vectors encoding constitutively active NFATc1 (MIGR-caNFATc1-IRES-GFP) (Gomez-Rodriguez et al., 2009) and GLUT1 (Slc2a1, pMIGR-Slc2a1-IRES-VEX) were kindly provided by P. Schwartzberg (NIH Human Genome Research Institute, Bethesda, MD) and J. Wherry (University of Pennsylvania, Philadelphia, PA), respectively. 20 bp oligonucleotides targeting exon 1 of the Slc2a3 gene (5′-GGGCGTTCTTCAATGCCACG-3′, 5′-CATTGTGTGGAGTTTTGCCG-3′, 5′-TGTGTTGTAGCCAAACTGCA-3′) were cloned into a retroviral vector for guide RNA delivery, which was a kind gift from M. Aichinger and J. Zuber (Vienna Biocenter, Austria). Expression vectors for IRF4 (pMIG-IRF4, #58987) c-Myc (pMIG-Myc, #58987) were obtained from Addgene. anti-CD4 (clone GK1.5), anti-CD8 (53-6.7), anti-TCR Vα2 (B20.1), anti-CD44 (IM7), anti-CD45.1 (A20), anti-CD45.2 (104), anti-Ki-67 (SolA15) antibodies were from eBioscience. Mitochondrial complexes were detected with the Total Oxphos Rodent WB antibody cocktail (MitoSciences) and an HRP-conjugated anti-mouse secondary antibody (Sigma Aldrich). GLUT1 protein expression was detected with a polyclonal anti-GLUT1 antibody (Abcam, ab115730) and an Alexa-647 conjugated goat-anti-rabbit-IgG secondary antibody (Molecular Probes). GLUT3 expression was analyzed using a polyclonal, FITC-conjugated anti-mouse-GLUT3 antibody (Abcam, ab136180). For analysis of phosphorylated AKT, mTOR and ribosomal S6 protein, total T cells were stimulated for 24 h with anti-CD3/CD28 with or without 1 μM FK506 and immediately fixed with IC fixation buffer (eBioscience). Protein phosphorylation was detected in permeabilized CD4+ and CD8+ T cells using anti-phospho-AKT Thr308 (D25E6, Cell Signaling Technology), anti-phospho-AKT Ser473 (SDRNR), anti-phospho-mTOR Ser2448 (MRRBY) and anti-phospho-S6 Ser235/236 (cupk43k, all eBioscience). Unconjugated rabbit anti-phospho-AKT Thr308 primary antibody was detected using an AlexaFlour-647-conjugated goat-anti-rabbit IgG secondary antibody (Molecular probes).
Retroviral transduction and adoptive transfer of SMARTA CD4+ T cells
CD4+ T cells were isolated using a mouse CD4 T Cell Enrichment kit (STEMCELL Technologies) and stimulated with 1 μg/ml plate-bound anti-CD3 (clone 2C11) plus 1 μg/ml anti-CD28 Abs (clone 37.51, both BioXCess) in the presence of 50 U/ml IL-2 (Peprotech) and 2.5 ng/ml IL-7 (Peprotech). T cells were transduced 24 hours after stimulation by spin-infection (2.500 rpm, 30°C, 90 min) in the presence of concentrated retroviral supernatant and 10 μg/ml polybrene (SantaCruz). Retroviral supernatant was produced in the Platinum-E retroviral packaging cell line. Platinum-E cells were transfected by lipofection (GeneJet, Fisher) with retroviral expression plasmids and the amphotrophic packaging vector pCL-10A1. Two days after transfection, the supernatant was collected and concentrated using Amicon Ultra-15 centrifugal filters (Merck Millipore). 4 hours after spin-infection, viral supernatant was removed from the T cells and replaced by fresh media. 48 h after transduction, T cells were transferred into new plates adding fresh media containing 50 U/ml IL-2 and 2.5 ng/ml IL-7 and rested for 2 days in IL-2 and IL-7 containing medium. Transduced cells (GFP+) were FACS-sorted using a sterile Sony SY3200 (HAPS1) cell sorter and 4x10⁵ GFP+CD45.1+ SMARTA CD4+ T cells were retro-orbitally injected into recipient CD45.2+ host mice. 3 days after adoptive transfer, host mice were infected i.p. with 2x10⁵ PFU LCMV (Armstrong strain) and expansion of CD45.1+ Va2 TCR+ donor T cells in the spleen was analyzed 8–10 days later by flow cytometry as described (Vaeth et al., 2016).
Flow cytometry
Cells were washed in ice-cold PBS containing 1% FBS before blocking with anti-FcγRII/FcγRIII antibodies (2.4G2, eBioscience). Staining of surface molecules with fluorescently labeled antibodies was performed at room temperature for 20 min in the dark. GLUT1 or GLUT3 expression was detected in cells fixed and permeabilized with the IC Staining Buffer Kit (BioLegend) using a polyclonal rabbit anti-GLUT1 antibody (Abcam, ab115730) together with an Alexa-647 conjugated anti-rabbit IgG secondary antibody (Molecular Probes) or a polyclonal, FITC-conjugated anti-GLUT3 antibody (Abcam, ab136180). Samples were acquired on a LSRII flow cytometer using FACSDiva software (BD Biosciences) and further analyzed with FlowJo software (Tree Star).
CFSE dilution assay
CD4+ and total T cells were loaded with 2.5 μM CFSE (Molecular Probes) according to the manufacturer’s instructions and stimulated with anti-CD3 and anti-CD28 antibodies in the presence or absence of 1 μM FK506, 50 U/ml IL-2, 5 ng/ml IL-7, a combination of IL-2 and IL-7 or left unstimulated as indicated. 72 to 96 h after stimulation, CFSE dilution was assessed by flow cytometry.
Extracellular flux analysis
Oxygen consumption rates (OCR) and extracellular acidification rates (ECAR) were measured using an XFe24 Extracellular Flux Analyzer (Seahorse Bioscience). Before experiments, cells were resuspended in XF media (Seahorse Biosciences) supplemented with 10 mM glucose (Sigma Aldrich), 1 mM GlutaMAX (Gibco) and 1 mM sodium pyruvate (Corning) and analyzed under basal conditions and following treatment with the following agents: the ATP synthase inhibitor oligomycin (1 μM); the protonophore Carbonyl cyanide-4-(trifluoromethoxy)phenylhydrazone (FCCP) (0.75 μM) to uncouple mitochondria; the mitochondrial complex I inhibitor rotenone (100 nM) and the mitochondrial complex III inhibitor antimycin A ( 1 μM). The basal oxygen consumption rate (OCR) was calculated by subtracting the OCR after rotenone and antimycin A treatment from the OCR before oligomycin treatment. The maximal OCR was calculated by subtracting the OCR after rotenone and antimycin A treatment from the OCR measured after addition of FCCP.
Metabolite Profiling
LC/MS analyses were conducted on a QExactive benchtop orbitrap mass spectrometer equipped with an Ion Max source and a HESI II probe, which was coupled to a Dionex UltiMate 3000 UPLC system (Thermo Fisher Scientific, San Jose, CA). External mass calibration was performed using the standard calibration mixture every 7 days. For metabolite profiling experiments, CD4+ T cells were stimulated with plate bound anti-CD3 and anti-CD28 for 36 hours. Cells were collected and cell pellets were washed with ice cold PBS. Polar metabolites were extracted using 1 ml of ice-cold 80% methanol with 10 ng/ml valine-d8 as an internal standard. After a 10 min vortex and centrifugation for 10 min at 4°C at 10,000 g, samples were dried in a table-top vacuum centrifuge. Dried samples were stored at −80°C and then resuspended in 100 μl water; 1 μl of each sample was injected onto a ZIC-pHILIC 2.1 x 150 mm (5 μm particle size) column (EMD Millipore). Buffer A was 20 mM ammonium carbonate, 0.1% ammonium hydroxide; buffer B was acetonitrile. The chromatographic gradient was run at a flow rate of 0.150 ml/min as follows: 0–20 min.: linear gradient from 80% to 20% B; 20–20.5 min.: linear gradient from 20% to 80% B; 20.5–28 min.: hold at 80% B. The mass spectrometer was operated in full-scan, polarity switching mode with the spray voltage set to 3.0 kV, the heated capillary held at 275°C, and the HES I probe held at 350°C. The sheath gas flow was set to 40 units, the auxiliary gas flow was set to 15 units, and the sweep gas flow was set to 1 unit. The MS data acquisition was performed in a range of 70–1000 m/z, with the resolution set at 70,000, the AGC target at 106, and the maximum injection time at 80 msec. Relative quantitation of polar metabolites was performed with XCalibur QuanBrowser 2.2 (Thermo Fisher Scientific) using a 5 ppm mass tolerance and referencing an in-house library of chemical standards. Relative abundance of metabolites was calculated by normalizing profiling results to cell number.
Mitochondrial DNA copy number
Total DNA from cells was isolated using the FlexiGene DNA kit (Qiagen). Oligonucleotide probes were designed against 3 different regions of mitochondrial DNA (mtDNA), and 2 regions of genomic DNA. Specific primers used are listed in Table S1. Quantitative realtime PCR was performed using the Maxima SYBR Green qPCR Master Mix (Thermo). mtDNA copy number was calculated relative to genomic DNA as previously described (Maus et al., 2017).
Glucose utilization and glucose uptake measurement
Glucose utilization was measured 48 hours after stimulation by quantifying the glucose content of RPMI 1640 media (supplemented with 10% FBS, 2 mM L-glutamine, 50 mM 2-mercaptoethanol and 100 U/ml penicillin and streptomycin; all Cellgro) with the colorimetric Glucose (HK) assay (Sigma Aldrich) in a 96 well microplate reader (Molecular Devices). Utilized glucose was calculated by subtracting the glucose content of the cell culture media after 48 h from the glucose content of fresh media and normalized to cell number. Glucose uptake was analyzed directly using the fluorescent glucose analogue 2-NBDG (ThermoFisher Scientific). Stimulated and unstimulated cells were incubated in glucose-free RPMI medium containing 100 μM 2-NBDG for 90 minutes at 37°C and the amount of 2-NBDG taken up by cells was assessed by flow cytometry. Alternatively, glucose uptake was measured using tritiated (3H) 2-DG (PerkinElmer). CD4+ T cells were stimulated with anti-CD3/CD28 (both at 1 ug/ml and plate-bound) for 48 h in the presence or absence of 1 μM FK506. 4x10⁶ T cells were incubated at 37 °C in 1 ml glucose-free medium (with 10% FBS) containing 1 μCi 3H-2-DG for 8 h. After washing twice with ice-cold PBS, cells were resuspended in 1 ml PBS, counted and homogenized using 4 ml Ultima Gold scintillation cocktail (PerkinElmer). Intracellular 3H-2-DG was measured with an automated LS 6500 scintillation counter (Beckman Coulter). 3H counts per minute (cpm) were normalized to cell number.
Immunofluorescence
T cells were stimulated for 36 h with anti-CD3 and anti-CD28 in the presence or absence of 1 μM FK506 and harvested on slides using a Shandon cytospin centrifuge (400 rpm for 4 min, RT). After drying o/n, cells were fixed with 4% PFA in PBS for 20 min, washed 3 times, permeabilized with 0.2% Triton-X for 5 min and washed with PBS. Nonspecific binding was blocked with antibody diluent (DAKO) for 60 min as described (Vaeth et al., 2011). NFATc1 intracellular localization was detected with a monoclonal anti-NFATc1 primary antibody (1:100 dilution; clone 7A6, ab2796, Abcam) incubated with cells o/n at 4 °C followed by incubation with an AlexaFluor 555-conjugated donkey-anti-mouse IgG secondary antibody (1:800 dilution; Molecular Probes) for 1h at RT. After washing, slides were mounted in Fluoromount G (Southern Biotechnology) containing DAPI and analyzed on a Leica TCS SP5 II confocal microscope. Data was processed using the LCS software package (Leica) and ImageJ (NIH). For statistics, >100 cells from 3 mice were quantified for cytosolic/nuclear localization of NFATc1.
Intracellular Ca2+ measurement
Isolated human CD4+ T cells were bound to poly-L-Lysine (Sigma Aldrich) coated translucent 96-well plates (BD Falcon). Cells were loaded with 1 μM Fura-2-AM (Molecular Probes), and washed twice with 0 mM Ca2+ Ringer solution as described (Feske et al., 2006; Vaeth et al., 2017). Ca2+ measurements were performed using a FlexStation 3 multi-mode microplate reader (Molecular Devices). Cells were resuspended in 0 mM Ca2+ Ringer solution at the beginning of measurements. After 120 seconds, 1 μM thapsigargin (Calbiochem) was added to induce activate CRAC channels by depleting ER Ca2+ stores. At 420 seconds, 2 mM Ca2+ containing Ringer solution was added to the cells (to obtain a 1 mM final extracellular Ca2+ concentration) to measure SOCE. Fura-2 fluorescence was measured at 510 nm after excitation at 340 nm and 380 nm and plotted as the F340/F380 emission ratio.
Real-time PCR
Total RNA was isolated using Trizol (Invitrogen) or the RNeasy Micro Kit (Quiagen) and cDNA was synthesized using the iScript cDNA synthesis kit (Bio-Rad). Quantitative realtime PCR was performed using the Maxima SYBR Green qPCR Master Mix (Thermo) and gene specific primers (Table S1). The relative abundance of transcripts was normalized to the expression of housekeeping genes using the 2−ΔCT method. Relative expression values were calculated by normalizing gene expression to the average of untreated WT or healthy donor controls.
Immunoblotting
Total cell lysates were prepared in lysis buffer containing 1% Triton X-100, 50 mM HEPES (pH 7.4), 250 mM NaCl, 10 mM EDTA, 2 mM sodium-o-vanadate, 10 mM sodium pyrophosphate, 10% glycerol, 10 μg/ml aprotinin, 10 μg/ml pepstatin, 5 μg/ml leupeptin and 0.2 mM PMSF. Lysates from equal numbers of cells for each condition were subjected to SDS-PAGE, transferred to nitrocellulose membrane, blocked with low-fat milk and incubated with the Total Oxphos Rodent WB antibody cocktail (MitoSciences) overnight. Proteins were visualized using an HPR-conjugated anti-mouse secondary antibody (Sigma) and chemiluminescent ECL reagent (Thermo Fisher). Densitometric quantification was performed using ImageJ.
Analysis of NFATc1 and NFATc2 ChIP-seq data
NFATc2 ChIP-seq data (Martinez et al., 2015) and genome-wide NFATc1 chromatin binding data (using T cells from a BAC-transgenic mouse strain in which NFATc1 is endogenously biotinylated by the biotin-ligase BirA and precipitated using streptavidin beads) (Klein-Hessling, 2017) were aligned to open chromatin regions defined by DNase I hypersensitivity sites in naïve and CD8+ T cell blasts (Bevington et al., 2016) and accessible chromatin regions defined by ATAC-seq in resting and PMA/ionomycin-stimulated CD8+ T cells (Mognol et al., 2017). All sequencing data was mapped to the mouse mm9 genome assembly using the Bowtie software package. NFATc1 and NFATc2 binding peaks were identified using the model-based analysis of ChIPseq (MACS) method.
QUANTIFICATION AND STATISTICAL ANALYSIS
All numerical results are mean ± standard error of the means (SEM). The statistical significance of differences between experimental groups was determined by Student’s t-test. Multiple comparisons were performed using normalization to the averages of control values. Differences were considered significant for p values <0.05 (noted in figures as *), p<0.01 (**) and p<0.001 (***). The number of repeat experiments and mice per group are indicated in the respective figure legends.
STUDY APPROVAL
Informed consent for the studies was obtained from the patient and healthy donors in accordance with the Declaration of Helsinki and IRB approval of the New York University School of Medicine and the University of British Columbia.
DATA AND SOFTWARE AVAILABILITY
GEO accession numbers for NFATc1 ChIP-seq data (GSE98726), NFATc2 ChIP-seq data (GSE64409), DNase I hypersensitivity data (GSE67451) and ATAC-seq data (GSE88987).
Supplementary Material
Acknowledgments
We thank P. Schwartzberg (National Institutes of Health, NIH) and J. Wherry (University of Pennsylvania) for sharing caNFATc1 and GLUT1 expression plasmids. The sgRNA delivery vector was a kind gift of M. Aichinger and J. Zuber (Vienna Biocenter). caNfatc1KI mice were provided by V. Ellenrieder (University of Göttingen). This work was funded by NIH grant AI097302 (to S.F.), Department of Defense grant W81XWH-15-1-0337 (to E.F.), Deutsche Forschungsgemeinschaft (DFG) grant TRR52 and SE 469/22-1 (to E.S.), DFG postdoctoral fellowship VA 882/1-1 (to M.V.), a Wilhelm Sander-foundation grant (to S. K.-H. and E.S.) and a Young Investigator Award by the Alex Lemonade Stand Foundation (to M.M.).
Footnotes
Conflict of interest statement: S.F. is a cofounder of Calcimedica. The other authors declare no conflict of interest.
AUTHOR CONTRIBUTIONS
M.V., M.M., S.K.-H., E.S., M.E., F.F.-S. J.Y., E.F and S.F. conducted experiments, analyzed data and interpreted the results. S.T., S.C. provided patient material and obtained clinical data. M.M., M.V., S.F. wrote the manuscript.
Supplemental information contains one table and 6 figures and can be found with this article online.
Publisher's Disclaimer: This is a PDF file of an unedited manuscript that has been accepted for publication. As a service to our customers we are providing this early version of the manuscript. The manuscript will undergo copyediting, typesetting, and review of the resulting proof before it is published in its final citable form. Please note that during the production process errors may be discovered which could affect the content, and all legal disclaimers that apply to the journal pertain.
References
- Akashi K, Kondo M, Weissman IL. Role of interleukin-7 in T-cell development from hematopoietic stem cells. Immunol Rev. 1998;165:13–28. doi: 10.1111/j.1600-065x.1998.tb01226.x. [DOI] [PubMed] [Google Scholar]
- Azzi JR, Sayegh MH, Mallat SG. Calcineurin inhibitors: 40 years later, can’t live without. J Immunol. 2013;191:5785–5791. doi: 10.4049/jimmunol.1390055. [DOI] [PubMed] [Google Scholar]
- Baumgart S, Chen NM, Siveke JT, Konig A, Zhang JS, Singh SK, Wolf E, Bartkuhn M, Esposito I, Hessmann E, et al. Inflammation-induced NFATc1-STAT3 transcription complex promotes pancreatic cancer initiation by KrasG12D. Cancer discovery. 2014;4:688–701. doi: 10.1158/2159-8290.CD-13-0593. [DOI] [PMC free article] [PubMed] [Google Scholar]
- Bevington SL, Cauchy P, Piper J, Bertrand E, Lalli N, Jarvis RC, Gilding LN, Ott S, Bonifer C, Cockerill PN. Inducible chromatin priming is associated with the establishment of immunological memory in T cells. EMBO J. 2016;35:515–535. doi: 10.15252/embj.201592534. [DOI] [PMC free article] [PubMed] [Google Scholar]
- Boyman O, Sprent J. The role of interleukin-2 during homeostasis and activation of the immune system. Nat Rev Immunol. 2012;12:180–190. doi: 10.1038/nri3156. [DOI] [PubMed] [Google Scholar]
- Buck MD, O’Sullivan D, Pearce EL. T cell metabolism drives immunity. J Exp Med. 2015;212:1345–1360. doi: 10.1084/jem.20151159. [DOI] [PMC free article] [PubMed] [Google Scholar]
- Chen YW, Chen YF, Chen YT, Chiu WT, Shen MR. The STIM1-Orai1 pathway of store-operated Ca(2+) entry controls the checkpoint in cell cycle G1/S transition. Sci Rep. 2016;6:22142. doi: 10.1038/srep22142. [DOI] [PMC free article] [PubMed] [Google Scholar]
- Cho JH, Kim HO, Kim KS, Yang DH, Surh CD, Sprent J. Unique features of naive CD8+ T cell activation by IL-2. J Immunol. 2013;191:5559–5573. doi: 10.4049/jimmunol.1302293. [DOI] [PubMed] [Google Scholar]
- Desvignes L, Weidinger C, Shaw P, Vaeth M, Ribierre T, Liu M, Fergus T, Kozhaya L, McVoy L, Unutmaz D, et al. STIM1 controls T cell-mediated immune regulation and inflammation in chronic infection. J Clin Invest. 2015;125:2347–2362. doi: 10.1172/JCI80273. [DOI] [PMC free article] [PubMed] [Google Scholar]
- Dutta D, Barr VA, Akpan I, Mittelstadt PR, Singha LI, Samelson LE, Ashwell JD. Recruitment of calcineurin to the TCR positively regulates T cell activation. Nat Immunol. 2017;18:196–204. doi: 10.1038/ni.3640. [DOI] [PMC free article] [PubMed] [Google Scholar]
- Feske S. Calcium signalling in lymphocyte activation and disease. Nat Rev Immunol. 2007;7:690–702. doi: 10.1038/nri2152. [DOI] [PubMed] [Google Scholar]
- Feske S, Gwack Y, Prakriya M, Srikanth S, Puppel SH, Tanasa B, Hogan PG, Lewis RS, Daly M, Rao A. A mutation in Orai1 causes immune deficiency by abrogating CRAC channel function. Nature. 2006;441:179–185. doi: 10.1038/nature04702. [DOI] [PubMed] [Google Scholar]
- Feske S, Muller JM, Graf D, Kroczek RA, Drager R, Niemeyer C, Baeuerle PA, Peter HH, Schlesier M. Severe combined immunodeficiency due to defective binding of the nuclear factor of activated T cells in T lymphocytes of two male siblings. Eur J Immunol. 1996;26:2119–2126. doi: 10.1002/eji.1830260924. [DOI] [PubMed] [Google Scholar]
- Feske S, Skolnik EY, Prakriya M. Ion channels and transporters in lymphocyte function and immunity. Nat Rev Immunol. 2012;12:532–547. doi: 10.1038/nri3233. [DOI] [PMC free article] [PubMed] [Google Scholar]
- Foster DA, Yellen P, Xu L, Saqcena M. Regulation of G1 Cell Cycle Progression: Distinguishing the Restriction Point from a Nutrient-Sensing Cell Growth Checkpoint(s) Genes & cancer. 2010;1:1124–1131. doi: 10.1177/1947601910392989. [DOI] [PMC free article] [PubMed] [Google Scholar]
- Frischbutter S, Gabriel C, Bendfeldt H, Radbruch A, Baumgrass R. Dephosphorylation of Bcl-10 by calcineurin is essential for canonical NF-kappaB activation in Th cells. Eur J Immunol. 2011;41:2349–2357. doi: 10.1002/eji.201041052. [DOI] [PubMed] [Google Scholar]
- Fuchs S, Rensing-Ehl A, Speckmann C, Bengsch B, Schmitt-Graeff A, Bondzio I, Maul-Pavicic A, Bass T, Vraetz T, Strahm B, et al. Antiviral and regulatory T cell immunity in a patient with stromal interaction molecule 1 deficiency. J Immunol. 2012;188:1523–1533. doi: 10.4049/jimmunol.1102507. [DOI] [PMC free article] [PubMed] [Google Scholar]
- Jacobs SR, Michalek RD, Rathmell JC. IL-7 is essential for homeostatic control of T cell metabolism in vivo. J Immunol. 2010;184:3461–3469. doi: 10.4049/jimmunol.0902593. [DOI] [PMC free article] [PubMed] [Google Scholar]
- Klein-Hessling SMK, Pusch T, Klein M, Rudolf R, Flöter J, Qureischi M, Beilhack A, Vaeth M, Kummerow C, Beckes C, Schoppmeyer R, Hahm U, Hoth M, Bopp T, Berberich-Siebelt F, Patra A, Avots A, Müller N, Schulze A, Serfling E. NFATc1 controls the cytotoxicity of CD8+ T cells at multiple levels. Nature communications. 2017 doi: 10.1038/s41467-017-00612-6. in press. [DOI] [PMC free article] [PubMed] [Google Scholar]
- Koga T, Hedrich CM, Mizui M, Yoshida N, Otomo K, Lieberman LA, Rauen T, Crispin JC, Tsokos GC. CaMK4-dependent activation of AKT/mTOR and CREM-alpha underlies autoimmunity-associated Th17 imbalance. J Clin Invest. 2014;124:2234–2245. doi: 10.1172/JCI73411. [DOI] [PMC free article] [PubMed] [Google Scholar]
- Lacruz RS, Feske S. Diseases caused by mutations in ORAI1 and STIM1. Ann N Y Acad Sci. 2015;1356:45–79. doi: 10.1111/nyas.12938. [DOI] [PMC free article] [PubMed] [Google Scholar]
- Le Deist F, Hivroz C, Partiseti M, Thomas C, Buc HA, Oleastro M, Belohradsky B, Choquet D, Fischer A. A primary T-cell immunodeficiency associated with defective transmembrane calcium influx. Blood. 1995;85:1053–1062. [PubMed] [Google Scholar]
- Li RJ, Xu J, Fu C, Zhang J, Zheng YG, Jia H, Liu JO. Regulation of mTORC1 by lysosomal calcium and calmodulin. eLife. 2016:5. doi: 10.7554/eLife.19360. [DOI] [PMC free article] [PubMed] [Google Scholar]
- Macintyre AN, Gerriets VA, Nichols AG, Michalek RD, Rudolph MC, Deoliveira D, Anderson SM, Abel ED, Chen BJ, Hale LP, et al. The glucose transporter Glut1 is selectively essential for CD4 T cell activation and effector function. Cell Metab. 2014;20:61–72. doi: 10.1016/j.cmet.2014.05.004. [DOI] [PMC free article] [PubMed] [Google Scholar]
- Mak TW, Grusdat M, Duncan GS, Dostert C, Nonnenmacher Y, Cox M, Binsfeld C, Hao Z, Brustle A, Itsumi M, et al. Glutathione Primes T Cell Metabolism for Inflammation. Immunity. 2017;46:675–689. doi: 10.1016/j.immuni.2017.03.019. [DOI] [PubMed] [Google Scholar]
- Man K, Miasari M, Shi W, Xin A, Henstridge DC, Preston S, Pellegrini M, Belz GT, Smyth GK, Febbraio MA, et al. The transcription factor IRF4 is essential for TCR affinity-mediated metabolic programming and clonal expansion of T cells. Nat Immunol. 2013;14:1155–1165. doi: 10.1038/ni.2710. [DOI] [PubMed] [Google Scholar]
- Martinez GJ, Pereira RM, Aijo T, Kim EY, Marangoni F, Pipkin ME, Togher S, Heissmeyer V, Zhang YC, Crotty S, et al. The transcription factor NFAT promotes exhaustion of activated CD8(+) T cells. Immunity. 2015;42:265–278. doi: 10.1016/j.immuni.2015.01.006. [DOI] [PMC free article] [PubMed] [Google Scholar]
- Maus M, Cuk M, Patel B, Lian J, Ouimet M, Kaufmann U, Yang J, Horvath R, Hornig-Do HT, Chrzanowska-Lightowlers ZM, et al. Store-Operated Ca2+ Entry Controls Induction of Lipolysis and the Transcriptional Reprogramming to Lipid Metabolism. Cell Metab. 2017;25:698–712. doi: 10.1016/j.cmet.2016.12.021. [DOI] [PMC free article] [PubMed] [Google Scholar]
- Mognol GP, Carneiro FR, Robbs BK, Faget DV, Viola JP. Cell cycle and apoptosis regulation by NFAT transcription factors: new roles for an old player. Cell Death Dis. 2016;7:e2199. doi: 10.1038/cddis.2016.97. [DOI] [PMC free article] [PubMed] [Google Scholar]
- Mognol GP, Spreafico R, Wong V, Scott-Browne JP, Togher S, Hoffmann A, Hogan PG, Rao A, Trifari S. Exhaustion-associated regulatory regions in CD8+ tumor-infiltrating T cells. Proc Natl Acad Sci U S A. 2017;114:E2776–E2785. doi: 10.1073/pnas.1620498114. [DOI] [PMC free article] [PubMed] [Google Scholar]
- Muller MR, Rao A. NFAT, immunity and cancer: a transcription factor comes of age. Nat Rev Immunol. 2010;10:645–656. doi: 10.1038/nri2818. [DOI] [PubMed] [Google Scholar]
- Oh-Hora M, Yamashita M, Hogan PG, Sharma S, Lamperti E, Chung W, Prakriya M, Feske S, Rao A. Dual functions for the endoplasmic reticulum calcium sensors STIM1 and STIM2 in T cell activation and tolerance. Nat Immunol. 2008;9:432–443. doi: 10.1038/ni1574. [DOI] [PMC free article] [PubMed] [Google Scholar]
- Patra AK, Avots A, Zahedi RP, Schuler T, Sickmann A, Bommhardt U, Serfling E. An alternative NFAT-activation pathway mediated by IL-7 is critical for early thymocyte development. Nat Immunol. 2013;14:127–135. doi: 10.1038/ni.2507. [DOI] [PubMed] [Google Scholar]
- Pearce EL, Poffenberger MC, Chang CH, Jones RG. Fueling immunity: insights into metabolism and lymphocyte function. Science. 2013;342:1242454. doi: 10.1126/science.1242454. [DOI] [PMC free article] [PubMed] [Google Scholar]
- Picard C, McCarl CA, Papolos A, Khalil S, Luthy K, Hivroz C, LeDeist F, Rieux-Laucat F, Rechavi G, Rao A, et al. STIM1 mutation associated with a syndrome of immunodeficiency and autoimmunity. N Engl J Med. 2009;360:1971–1980. doi: 10.1056/NEJMoa0900082. [DOI] [PMC free article] [PubMed] [Google Scholar]
- Prakriya M, Feske S, Gwack Y, Srikanth S, Rao A, Hogan PG. Orai1 is an essential pore subunit of the CRAC channel. Nature. 2006;443:230–233. doi: 10.1038/nature05122. [DOI] [PubMed] [Google Scholar]
- Scarpulla RC. Metabolic control of mitochondrial biogenesis through the PGC-1 family regulatory network. Biochimica et biophysica acta. 2011;1813:1269–1278. doi: 10.1016/j.bbamcr.2010.09.019. [DOI] [PMC free article] [PubMed] [Google Scholar]
- Schaballie H, Rodriguez R, Martin E, Moens L, Frans G, Lenoir C, Dutre J, Canioni D, Bossuyt X, Fischer A, et al. A novel hypomorphic mutation in STIM1 results in a late-onset immunodeficiency. J Allergy Clin Immunol. 2015;136:816–819. e814. doi: 10.1016/j.jaci.2015.03.009. [DOI] [PubMed] [Google Scholar]
- Shaw PJ, Weidinger C, Vaeth M, Luethy K, Kaech SM, Feske S. CD4(+) and CD8(+) T cell-dependent antiviral immunity requires STIM1 and STIM2. J Clin Invest. 2014;124:4549–4563. doi: 10.1172/JCI76602. [DOI] [PMC free article] [PubMed] [Google Scholar]
- Shi LZ, Wang R, Huang G, Vogel P, Neale G, Green DR, Chi H. HIF1alpha-dependent glycolytic pathway orchestrates a metabolic checkpoint for the differentiation of TH17 and Treg cells. J Exp Med. 2011;208:1367–1376. doi: 10.1084/jem.20110278. [DOI] [PMC free article] [PubMed] [Google Scholar]
- Vaeth M, Eckstein M, Shaw PJ, Kozhaya L, Yang J, Berberich-Siebelt F, Clancy R, Unutmaz D, Feske S. Store-Operated Ca(2+) Entry in Follicular T Cells Controls Humoral Immune Responses and Autoimmunity. Immunity. 2016;44:1350–1364. doi: 10.1016/j.immuni.2016.04.013. [DOI] [PMC free article] [PubMed] [Google Scholar]
- Vaeth M, Gogishvili T, Bopp T, Klein M, Berberich-Siebelt F, Gattenloehner S, Avots A, Sparwasser T, Grebe N, Schmitt E, et al. Regulatory T cells facilitate the nuclear accumulation of inducible cAMP early repressor (ICER) and suppress nuclear factor of activated T cell c1 (NFATc1) Proc Natl Acad Sci U S A. 2011;108:2480–2485. doi: 10.1073/pnas.1009463108. [DOI] [PMC free article] [PubMed] [Google Scholar]
- Vaeth M, Muller G, Stauss D, Dietz L, Klein-Hessling S, Serfling E, Lipp M, Berberich I, Berberich-Siebelt F. Follicular regulatory T cells control humoral autoimmunity via NFAT2-regulated CXCR5 expression. J Exp Med. 2014;211:545–561. doi: 10.1084/jem.20130604. [DOI] [PMC free article] [PubMed] [Google Scholar]
- Vaeth M, Schliesser U, Muller G, Reissig S, Satoh K, Tuettenberg A, Jonuleit H, Waisman A, Muller MR, Serfling E, et al. Dependence on nuclear factor of activated T-cells (NFAT) levels discriminates conventional T cells from Foxp3+ regulatory T cells. Proc Natl Acad Sci U S A. 2012;109:16258–16263. doi: 10.1073/pnas.1203870109. [DOI] [PMC free article] [PubMed] [Google Scholar]
- Vaeth M, Yang J, Yamashita M, Zee I, Eckstein M, Knosp C, Kaufmann U, Karoly Jani P, Lacruz RS, Flockerzi V, et al. ORAI2 modulates store-operated calcium entry and T cell-mediated immunity. Nature communications. 2017;8:14714. doi: 10.1038/ncomms14714. [DOI] [PMC free article] [PubMed] [Google Scholar]
- Wang R, Dillon CP, Shi LZ, Milasta S, Carter R, Finkelstein D, McCormick LL, Fitzgerald P, Chi H, Munger J, et al. The transcription factor Myc controls metabolic reprogramming upon T lymphocyte activation. Immunity. 2011;35:871–882. doi: 10.1016/j.immuni.2011.09.021. [DOI] [PMC free article] [PubMed] [Google Scholar]
Associated Data
This section collects any data citations, data availability statements, or supplementary materials included in this article.