

Summary
Fatty acids (FAs) activate and fuel UCP1-mediated non-shivering thermogenesis (NST) in brown adipose tissue (BAT). Release of FAs from intracellular fat stores by adipose triglyceride lipase (ATGL) is considered a key step in NST. Accordingly, the severe cold intolerance of global ATGL knockout (AKO) mice has been attributed to defective BAT lipolysis. Here we show that this conclusion is incorrect. We demonstrate that although the BAT-specific loss of ATGL impairs BAT lipolysis and alters BAT morphology, it does not compromise the β3-adrenergic thermogenic response or cold-induced NST. Instead, NST depends on nutrient supply or lipolysis in white adipose tissue during fasting, suggesting that circulating energy substrates are sufficient to fuel NST. Cold intolerance in AKO mice is not caused by BAT dysfunction as previously suspected but by severe cardiomyopathy. We conclude that functional NST requires adequate substrate supply and cardiac function, but does not depend on ATGL-mediated lipolysis in BAT.
Keywords: adipose triglyceride lipase, lipolysis, thermogenesis, cold, brown adipose tissue, white adipose tissue, heart
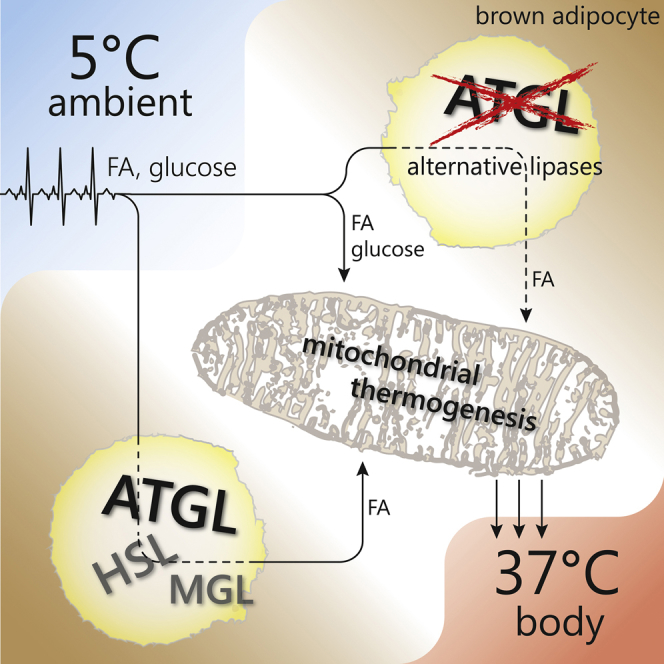
Graphical Abstract
Highlights
-
•
ATGL in BAT is not a prerequisite for cold-induced thermogenesis in vivo
-
•
ATGL in WAT is crucial to liberate fatty acids for energy combustion during fasting
-
•
Loss of ATGL in the heart induces hypothermia due to insufficient cardiac reserve
-
•
Adaptive thermogenesis is normal in mice lacking ATGL in BAT
Schreiber et al. demonstrate that ATGL-mediated lipolysis in brown adipose tissue is not a prerequisite for cold-induced non-shivering thermogenesis in vivo. Instead, ATGL in white adipose tissue and the heart is essential for supplying fatty acids during fasting and for meeting increased demands on the cardiovascular system in the cold, respectively.
Introduction
Maintaining constant body temperature in changing temperature environments is essential for survival of homeothermic vertebrates. Upon exposure to low ambient temperatures, mammals increase their oxidative metabolism for the production of heat. The major site for cold-induced non-shivering thermogenesis (NST) is brown adipose tissue (BAT), which contains the unique uncoupling protein-1 (UCP-1). UCP-1 resides within the inner mitochondrial membrane of brown adipocytes, where it dissipates the proton gradient generated by the electron transport chain (Cannon and Nedergaard, 2011, Fedorenko et al., 2012). The futile cycling of protons drives the oxidation of high amounts of energy substrates and produces heat. Based on the potential relevance of BAT function for energy expenditure in humans (Cypess et al., 2009, van Marken Lichtenbelt et al., 2009, Nedergaard et al., 2007, Virtanen et al., 2009), interest in stimulating BAT thermogenesis as a potential treatment strategy for metabolic disorders has been renewed (Bartelt et al., 2011, Chondronikola et al., 2014, Hanssen et al., 2015, Schrauwen and van Marken Lichtenbelt, 2016, Stanford et al., 2013).
Cold sensation is transmitted to BAT primarily via the sympathetic nervous system. Catecholamines activate β3-adrenergic receptors, leading to an increase of cellular cAMP concentrations and activation of protein kinase A (PKA). Upon short-term cold exposure for several hours (acute cold), PKA increases the transcription of UCP-1 and peroxisome proliferator-activated receptor (PPAR)-γ co-activator 1α (PGC-1α). PGC-1α, in turn, co-activates PPAR-α, a crucial nuclear receptor orchestrating the transcriptional program for substrate oxidation and thermogenesis in BAT (Puigserver et al., 1998). A sustained increase in sympathetic tone upon long-term cold exposure for several weeks (cold acclimation) additionally induces the recruitment of new brown adipocytes, leading to tissue hyperplasia and hypertrophy (Bukowiecki et al., 1986, Cameron and Smith, 1964, Davis et al., 1960).
Cold-induced adrenergic signaling also induces the hydrolysis of intracellular triacylglycerol (TG) stores (lipolysis) via the activation of the major TG hydrolases adipose triglyceride lipase (ATGL) and hormone-sensitive lipase (HSL) (Zechner et al., 2012). According to the current view, BAT lipolysis is essential for cold-induced NST because BAT-derived fatty acids (FAs) (1) activate UCP-1 and (2) act as primary fuel substrate (Cannon and Nedergaard, 2004). Several key findings supported this conclusion. (1) Global or adipocyte-specific ATGL knockout (AKO and AAKO, respectively) mice were unable to maintain body temperature upon acute cold and exhibited a lipolytic defect in BAT, leading to severe BAT hypertrophy due to TG accumulation (Ahmadian et al., 2011, Haemmerle et al., 2006). (2) In differentiated brown adipocytes, pharmacological inhibition of ATGL activity attenuated cellular respiration, suggesting impaired UCP-1 activation and fuel supply (Li et al., 2014). (3) Enzymatically active ATGL is pivotal for the transcriptional activity of PPAR-α (Haemmerle et al., 2011, Mottillo et al., 2012). The findings that HSL and monoglyceride lipase (MGL) knockout mice are not cold sensitive (Osuga et al., 2000, Wang et al., 2001; own observations) suggested that especially ATGL function is crucial for cold-induced NST. However, the tissue-specific impact of ATGL in BAT, white adipose tissue (WAT), and cardiac muscle in cold-induced NST has not been directly addressed in vivo.
To define the physiological relevance of ATGL in individual tissues, we studied cold-induced NST in informative mutant mouse models (Table 1). We demonstrate that in the presence of exogenous substrate supply, either from the diet during feeding, or from WAT lipolysis during fasting, ATGL in BAT is not essential for cold-induced NST. Instead, our results emphasize the importance of a functional cardiovascular system for the maintenance of normal body temperature.
Table 1.
Mouse Models Used in This Study
| Synonym | Genotype | Reference | ATGL Protein Expressed in: |
|||
|---|---|---|---|---|---|---|
| BAT | WAT | CM | Other Tissues | |||
| AKO | ATGL knockout | Haemmerle et al., 2006 | – | – | – | – |
| iBAKO | inducible BAT-specific ATGL knockout | this study | – | + | + | + |
| AAKO | adipocyte-specific ATGL knockout | Schoiswohl et al., 2015 | – | – | + | + |
| iHAKO | inducible heart-specific ATGL knockout | Kienesberger et al., 2013 | + | + | – | + |
| AKO/cTg | AKO overexpressing a cardiac-specific α-MHC-ATGL transgene | Schreiber et al., 2015 | – | – | + | – |
This table gives an overview of mouse models used in this study and indicates ATGL protein expression in respective tissues. BAT, brown adipose tissue; WAT, white adipose tissue; CM, cardiac muscle; (–) indicates that no ATGL protein is expressed; (+) indicates that ATGL protein is expressed.
Results
Global ATGL Deficiency Causes Cold-Induced Hypothermia and BAT Hypertrophy, but Does Not Alter Mitochondrial Function in BAT
We first revisited AKO mice (Table 1; Haemmerle et al., 2006) to better understand how defective ATGL-mediated lipolysis affects key players in thermogenesis. ATGL deficiency decreased in vitro TG hydrolase activities in BAT lysates by 72% (Figure 1A). Addition of a specific small-molecule inhibitor for HSL (HSLi) further inhibited TG hydrolase activities more than 90% in AKO lysates compared to wild-type (WT). These data indicate that, as in WAT (Schweiger et al., 2006), ATGL and HSL are the predominant TG hydrolases in BAT. Acute cold exposure at 5°C for 3–6 hr evoked severe hypothermia (body temperature <31°C) in AKO mice (Figure 1B), but not in WT, confirming cold intolerance in AKO mice (Haemmerle et al., 2006). BAT of AKO mice was hypertrophic (∼6-fold increase in tissue weight) and resembled WAT morphology with large, unilocular adipocytes (Figures 1C and 1D). Consistent with the effect of ATGL knockdown in brown adipocytes (Mottillo et al., 2012), global Atgl gene deletion resulted in lower BAT transcript levels for PPAR-α target genes (Figure S1A) and classical BAT markers (Figure 1E). In contrast to decreased mRNA levels, UCP-1 protein abundance in isolated BAT mitochondria was similar in AKO and WT mice (Figure 1F).
Figure 1.

Global ATGL Deficiency Causes Cold-Induced Hypothermia and BAT Hypertrophy, but Does Not Alter Mitochondrial Function in BAT
(A) TG hydrolase activities of BAT infranatants in the absence or presence of HSL inhibitor (HSLi) from mice housed at 22°C–23°C (n = 3).
(B) Body temperature in ad libitum-fed mice upon acute cold exposure at 5°C for 3–6 hr (n = 6).
(C) BAT weight (n = 7).
(D) Histology of BAT. Scale bar, 100 μm.
(E) Relative mRNA expression of classical brown fat genes upon acute cold exposure (n = 6).
(F) UCP-1 immunoblot of isolated BAT mitochondria upon acute cold exposure.
(G) Total DNA content in whole BAT depots (n = 6).
(H) DNA content in isolated brown adipocytes (adi) and stroma-vascular fraction (SVF; n = 3).
(I) Total protein content in isolated mitochondria from whole BAT depots (n = 10).
(J) Relative mtDNA content in BAT assessed by qPCR and calculated from copy numbers of the mtDNA-encoded MtCO1 gene and the nuclear DNA-encoded Ndufv1 gene (n = 6).
(K) Representative transmission electron micrographs from BAT. Scale bar, 0.5 μm.
(L) Oxygen consumption rates (OCRs) in BAT homogenates (hom) using pyruvate (pyr), glycerol-3-P (G3P) in the absence or presence of rotenone (R, G3P/R), and guanosine 5′-diphosphate (GDP). OCRs were calculated for whole BAT depots (n = 6–7).
Analyses were performed in male mice, except for (H), which used female mice, aged 9–10 weeks. Data are presented as means ± SD. Statistical significance was evaluated by unpaired two-tailed Student’s t test. ∗p < 0.05, ∗∗p < 0.01, and ∗∗∗p < 0.001. See also Figure S1.
Total DNA content of whole BAT depots was higher in AKO than in WT mice (Figure 1G), suggesting hyperplasia in the absence of ATGL. BAT cell fractionation revealed an increased DNA content in both the brown adipocytes and the stroma-vascular fraction (SVF) of AKO mice (Figure 1H). Increased abundance of SVF cells resulted in increased mRNA levels of several immune cell markers (F4/80, CD11c, and IL-6) in BAT from AKO mice (Figure S1B). These results suggested that global ATGL deficiency—in addition to BAT hypertrophy—also causes BAT hyperplasia.
In contrast to total DNA content in BAT, the total protein content from isolated mitochondria per whole BAT depot was not different between AKO and WT mice (Figure 1I), suggesting a decrease in the number of mitochondria in relation to total cell number. This finding was confirmed when we determined the ratio of mitochondrial DNA (mtDNA) to nuclear DNA (nDNA). The dosage of the mtDNA-encoded gene cytochrome oxidase-1 (MtCO1) was decreased by 55% in relation to the dosage of the nDNA-encoded gene Ndufv1 (Figure 1J).
ATGL deficiency leads to mitochondrial dysfunction in cardiomyocytes and β cells (Haemmerle et al., 2011, Tang et al., 2013). Thus, we assessed whether loss of ATGL also affects mitochondrial function in BAT as a potential cause for cold intolerance. Transmission electron microscopy provided no evidence for altered mitochondrial morphology displaying intact and dense mitochondrial cristae in both genotypes (Figure 1K). High-resolution respirometry of BAT homogenates demonstrated that oxygen consumption rates (OCRs) in BAT of AKO and WT mice were similar independently of whether respiration was fueled via complex-I, complex-II, or complex-I and complex-II substrates. OCRs were also comparable between genotypes in the presence of the UCP-1 inhibitor guanosine 5′-diphosphate (GDP). Thus, global ATGL deficiency causes pronounced morphological and cellular alterations in BAT, but does not overtly impair respiratory capacity ex vivo.
ATGL in BAT Is Not Essential for Thermogenesis during Acute Cold
To delineate the importance of ATGL in BAT for cold-induced NST, we generated mice lacking ATGL exclusively in BAT (Table 1) and assessed cold tolerance. Breeding of ATGLflox/flox control (Sitnick et al., 2013) with tamoxifen-inducible UCP-1-CreER mice (Rosenwald et al., 2013) yielded inducible BAT-specific ATGL knockout (iBAKO) mice. Tamoxifen administration resulted in a substantial decrease of ATGL protein abundance (>80%) in BAT homogenates of iBAKO mice (Figure 2A). Considering that brown adipocytes comprise less than 50% of the cell population in BAT (Rosenwald et al., 2013) and that other cell types such as endothelial and immune cells also express low levels of ATGL (Schlager et al., 2015, Schrammel et al., 2014), we assume that Atgl gene deletion in brown adipocytes reaches an efficiency of close to 100%. To investigate whether Atgl gene deletion in brown adipocytes affected lipolysis, we determined BAT glycerol release and BAT lysate TG hydrolase activities. Ex vivo glycerol release under basal conditions was 54% lower from iBAKO-BAT than from ATGLflox/flox-BAT (Figure 2B). A similar decrease was observed for isoproterenol (ISO)-stimulated glycerol release (−54%). In vitro TG hydrolase activities were 38% lower in BAT lysates from iBAKO than from ATGLflox/flox control mice (Figure 2C). Addition of the specific small-molecule ATGL inhibitor Atglistatin (ATGLi) (Mayer et al., 2013) decreased TG hydrolase activities by 40% in BAT lysates from ATGLflox/flox control, but not from iBAKO mice, arguing for efficient inactivation of ATGL in iBAKO mice. Similar to AKO mice, BAT mass from iBAKO mice was hypertrophic (∼4-fold increase in tissue weight) and contained large, unilocular adipocytes (Figures 2D and 2E). In contrast to BAT, epididymal WAT and inguinal WAT (epiWAT and ingWAT) showed normal ATGL protein expression, basal and ISO-stimulated glycerol release (from epiWAT), and tissue mass (Figures S2A–S2C), indicating that the UCP-1-CreER promoter is specific for BAT. BAT-specific Atgl gene deletion did not alter body weight of iBAKO compared to ATGLflox/flox control mice (Figure S2D).
Figure 2.

ATGL in BAT Is Not Essential for Thermogenesis during Acute Cold
(A) ATGL immunoblot of BAT homogenates (n = 4; representative of at least two independent analyses).
(B) Ex vivo lipolysis in BAT under basal and isoproterenol (ISO)-stimulated conditions (n = 4).
(C) TG hydrolase activities in BAT infranatants in the absence or presence of ATGL inhibitor Atglistatin (ATGLi) from mice exposed to 5°C for 6 hr (n = 5).
(D) BAT weight (n = 11) and tissue gross morphology (inset).
(E) Histology of BAT. Scale bar, 100 μm.
(F) Body temperature in ad libitum-fed mice during acute cold exposure at 5°C (n ≥ 5).
(G) DNA content in brown adipocytes (adi) and stroma-vascular fraction (SVF; n = 3).
(H) UCP-1 immunoblot of isolated BAT mitochondria upon acute cold exposure.
(I) Oxygen consumption rates (OCRs) in BAT homogenates (hom) using pyruvate (pyr), glycerol-3-P (G3P) in the absence and presence of rotenone (G3P/R), and guanosine 5′-diphosphate (GDP). OCRs were calculated for whole BAT depots (n = 6).
Analyses were performed in male mice, except for (G), which used female mice, aged 9–11 weeks and 4 weeks upon tamoxifen administration. Data are presented as means ± SD. Statistical significance was evaluated by unpaired two-tailed Student’s t test or two-way ANOVA with Bonferroni post hoc tests. ∗p < 0.05, ∗∗p < 0.01, and ∗∗∗p < 0.001 versus ATGLflox/flox control and §p < 0.05 versus basal. See also Figure S2.
In stark contrast to AKO mice, iBAKO mice exhibited normal or even moderately increased body temperature during acute cold exposure at 5°C for 6 hr (Figure 2F). Unlike in AKO BAT, transcript levels of classical BAT marker genes as well as PPAR-α and its target genes were either not or only moderately decreased in BAT of iBAKO versus ATGLflox/flox control mice (Figures S2E and S2F compared with Figures 1E and S1A). Nevertheless, we found a higher DNA content in both isolated brown adipocytes and SVF cells (Figure 2G) and increased transcript levels of immune cell markers like F4/80, CD11c, and IL-6 (Figure S2G), indicating that ATGL deficiency in BAT causes brown adipocyte hyperplasia.
UCP-1 protein abundance and respiratory capacity in BAT homogenates in the presence of complex-I, complex-II, or complex-I and complex-II substrates were similar in both genotypes and independent of the absence or presence of the UCP-1 inhibitor GDP (Figure 2I). Together, these results show that the BAT-specific loss of ATGL changes BAT morphology, but does not impair respiratory function or cold-induced NST.
ATGL-Mediated Lipolysis in WAT Is Essential to Fuel Thermogenesis during Fasting
iBAKO and AKO mice exhibit a different physiological response to cold stress. This suggests that other defects than impaired FA mobilization in brown adipocytes cause defective cold-induced NST in AKO mice. AKO mice develop hypothermia during cold, but also upon prolonged fasting at room temperature (Haemmerle et al., 2006). Food deprivation during cold amplifies the need for lipolysis to supply FAs for thermogenesis. To differentiate whether the pronounced susceptibility to hypothermia in AKO mice is due to (1) an autonomous defect in FA supply causing a local fuel deficiency within BAT or (2) impaired FA mobilization from WAT leading to a systemic fuel deficiency, we pursued two strategies. First, we fasted iBAKO mice either overnight for 12 hr at 22°C–23°C or for 6 hr at 5°C. iBAKO mice maintained their body temperature upon food deprivation in both conditions (Figures S3A and 3A). Upon food deprivation for 6 hr at 5°C, iBAKO mice retained normal blood glucose and plasma glycerol concentrations but exhibited higher plasma FA (+17%) and TG (+90%) levels than ATGLflox/flox control mice (Figure 3B).
Figure 3.

ATGL-Mediated Lipolysis in WAT Is Essential to Fuel Thermogenesis during Fasting
(A and C) Body temperature in iBAKO (A) and AAKO (C) mice during fasting at 5°C at indicated time points.
(B and D) Blood glucose, plasma FA, glycerol, and TG levels upon fasting at 5°C for 6 hr in iBAKO mice (B) (n = 5–8) and for 2 hr in AAKO mice (D) (n = 7).
Analyses were performed in female iBAKO and ATGLflox/flox mice aged 40 weeks and 8 weeks upon tamoxifen administration and AAKO mice of mixed sex aged 10–16 weeks. Data are presented as means ± SD. Statistical significance was evaluated by unpaired two-tailed Student’s t test. ∗p < 0.05, ∗∗p < 0.01, and ∗∗∗p < 0.001. See also Figure S3.
Second, we analyzed AAKO mice (Table 1; Schoiswohl et al., 2015), which we generated by breeding ATGLflox/flox control with adiponectin-Cre mice (Eguchi et al., 2011), leading to Atgl gene deletion in both adipose tissue depots, BAT and WAT. Similar to AKO mice (Haemmerle et al., 2006), an overnight fast for 12 hr at 22°C–23°C decreased body temperature of AAKO mice to ≤32°C, but mice regained normal body temperature upon refeeding for 1 hr (Figure S3B). Food deprivation during cold exposure at 5°C caused hypothermia in AAKO mice already within 90 min (Figure 3C), confirming previous results (Ahmadian et al., 2011). Hypothermia in cold-exposed fasted AAKO mice was associated with depletion of circulating energy substrates including blood glucose, plasma FA, glycerol, and TG concentrations (Figure 3D). In contrast, cold-exposed ad libitum-fed AAKO mice maintained normal body temperature for at least 6 hr (Figure S3C). Thus, the supply of FAs for energy combustion and cold-induced NST critically depends on ATGL in WAT, but not BAT.
Impaired Heart Function Due to Cardiac ATGL Deficiency Causes Hypothermia
Global AKO mice, but not iBAKO or AAKO, exhibit impaired cold-induced NST in the ad libitum-fed state. These data suggest that ATGL-mediated lipolysis in tissues other than adipose tissues contributes to cold intolerance in AKO mice. We have previously shown that AKO mice exhibit a progressive dilated cardiomyopathy leading to premature death (Haemmerle et al., 2006, Haemmerle et al., 2011). Initial evidence for a role of the failing heart in the pathogenesis of cold intolerance was obtained when ad libitum-fed AKO mice of different ages and stages of heart disease were acutely transferred from 22°C to 5°C. While 6-week-old AKO mice were able to maintain their body temperature at euthermia of ≥35°C for at least 8 hr, 10-week-old AKO mice became hypothermic (body temperature ≤30°C) as soon as 2 hr after acute cold exposure (Figure 4A). Evaluation of cardiac function by magnetic resonance imaging (MRI) revealed a shift from a compensated increase in left ventricular (LV) mass with normal ejection fraction in 6-week-old AKO mice to a decompensated cardiomyopathy characterized by a further increase in LV mass associated with severely impaired ejection fraction in 10-week-old AKO mice (Figures 4B and 4C). These data suggest that impaired cardiac function by the age of 10 weeks underlies cold intolerance of AKO mice.
Figure 4.

Impaired Heart Function Due to Cardiac ATGL Deficiency Causes Hypothermia
(A and D) Kaplan-Meier plots depicting mice maintaining euthermia (body temperature ≥35°C) during acute cold exposure at 5°C at indicated time points from AKO (A) and iHAKO mice (D).
(B, E, and H) Left ventricular (LV) mass from AKO (B), iHAKO (E), and AKO/cTg mice (H).
(C, F, and I) Ejection fraction from AKO (C), iHAKO (F), and AKO/cTg mice (I).
(G) Body temperature of male AKO/cTg mice during acute cold at 5°C for 3–6 hr (n ≥ 8).
Male AKO mice were analyzed at the age of 6 and 10 weeks (n ≥ 6). iHAKO mice of mixed sex were studied at the age of 12 months and 6 and 10 weeks upon tamoxifen administration (postTAM) (n ≥ 6). Male AKO/cTg mice aged 5–6 months were used to study LV mass and ejection fraction (n = 5). Data are presented as means ± SD, except for Kaplan-Meier plot showing median. Statistical significance was evaluated by Gehan-Breslow-Wilcoxon test for Kaplan-Meier plots or two-way ANOVA and Bonferroni post hoc tests. ∗∗p < 0.01 and ∗∗∗p < 0.001 versus control and ###p < 0.001 versus 6-week-old respective groups. See also Figures S4 and S5.
To test whether cardiac ATGL deficiency affected heart performance, we measured heart rate (HR) by telemetry and determined the low-to-high frequency (LF/HF) ratio of HR variability as measures for cardiac output and autonomic activity, respectively. At baseline at 22°C–23°C, AKO mice had higher HR and sympathetic activation than WT mice (Figures S4A and S4B). Upon acute cold exposure at 5°C and compared to baseline, WT and AKO mice increased HR (Figure S4C). However, AKO mice exhibited lower HR that progressively decreased with the reduction in body temperature. Changes in body temperature may affect HR and vice versa. Thus, we applied statistical tests using ANCOVA and corrected our data upon cold exposure (1) for body temperature or (2) for HR. At a hypothetical body temperature of 34°C, AKO mice had still lower and unstable HR than WT mice (Figure S4D). Correcting body temperature for an HR of 689 bpm, there were no differences in estimated body temperature between genotypes (Figure S4E). Together, these findings imply an impaired cardiac reserve as a cause for cold intolerance in AKO mice.
To substantiate the evidence that cardiac dysfunction causes cold intolerance in AKO mice, we used two additional mouse models. First, we studied mice lacking ATGL exclusively in the heart (Table 1). We used tamoxifen-inducible heart-specific ATGL knockout (iHAKO) mice (Kienesberger et al., 2013) at different times upon gene deletion and performed acute cold studies. Up to 6 weeks upon tamoxifen administration (postTAM), iHAKO mice maintained normal body temperature upon 8 hr cold exposure at 5°C (Figure 4D). This ability to cope with cold diminished with prolonged Atgl gene deletion. Ten weeks postTAM, iHAKO mice became severely hypothermic as early as 1 hr after acute cold exposure. As expected, cold intolerance was not observed in CreER+ control mice (data not shown). Both treatment groups of iHAKO mice showed increased LV mass, but again, only mice with 10 weeks of tamoxifen-induced Atgl gene deletion had a decreased ejection fraction (Figures 4E and 4F).
Second, we performed a reverse experiment and “rescued” the lethal heart phenotype of AKO mice by re-introducing ATGL expression exclusively in the heart of AKO mice using a cardiac-specific α-MHC-ATGL transgene (AKO/cTg; Table 1). AKO/cTg mice express ATGL in cardiomyocytes, but lack the enzyme in all other tissues. AKO/cTg mice have a normal heart phenotype and life expectancy, but otherwise phenocopy AKO mice (Haemmerle et al., 2011, Schreiber et al., 2015). Increased BAT weight and morphology, decreased expression of classical BAT marker genes, normal UCP-1 protein abundance in isolated mitochondria, increased total DNA content in whole BAT depots, unchanged total protein content in isolated BAT mitochondria, reduced mtDNA content, decreased expression of PPAR-α target genes, elevated inflammation markers, and mitochondrial morphology were essentially identical in BAT of AKO/cTg and AKO mice (Figures S5A–S5I, compared to Figures 1C–1K, S1A, and S1B). Respiration capacity of BAT homogenates from AKO/cTg and age-matched WT mice expressing the cardiac-specific ATGL transgene (WT/cTg) was similar under all conditions except for a small increase of complex-II-mediated respiration (Figure S5J) and resembled the respiration capacity of AKO mice (Figure 1L). In contrast to AKO mice, however, 12- to 16-week-old ad libitum-fed AKO/cTg mice maintained euthermia upon acute cold exposure at 5°C for 3–6 hr (Figure 4G). Similar to AAKO mice, AKO/cTg mice demonstrated cold intolerance during fasting at 5°C for 80 min (Figure S5K, compared to Figure 3C). MRI confirmed that LV mass and ejection fraction were similar in AKO/cTg and WT/cTg mice (Figures 4H and 4I). These data (1) demonstrate that cardiac dysfunction due to the loss of ATGL in the heart causes hypothermia upon acute cold exposure and (2) corroborate evidence that defective BAT lipolysis can be compensated by circulating substrate delivery when cardiac function is normal.
Because substrate deficiency in response to fasting induced pronounced hypothermia in mice lacking ATGL in WAT (AKO, AAKO, and AKO/cTg), we asked whether hypothermia in 10-week-old ad libitum-fed iHAKO mice was due to energy deficiency. Ten weeks postTAM treatment, iHAKO mice had higher blood glucose (+22%), plasma FA (+60%), glycerol (+60%), and TG (+58%) levels, while plasma parameters were similar between groups upon 6 weeks postTAM (Table S1). Increased plasma concentrations of FAs and glycerol were explained by increased in vitro TG hydrolase activities in epiWAT of iHAKO mice (data not shown), indicating an increased lipolytic flux. Thus, despite effective mobilization of endogenous energy depots and increased concentrations of circulating energy substrates, iHAKO mice were unable to maintain euthermia (body temperature for ATGLflox/flox control = 37.3°C ± 0.9°C and iHAKO = 26.8°C ± 2.4°C, p < 0.001), suggesting that the cardiac defect rather than restricted substrate availability causes cold intolerance in iHAKO mice.
ATGL-Deficient Mice Survive upon Cold Acclimation and Exhibit Normal Brown Adipocyte Recruitment
The contribution of BAT to thermogenesis during acute cold depends on the thermal history of mice (Cannon and Nedergaard, 2011). While mice kept at thermoneutrality (28°C–30°C) have little BAT and react to acute cold exposure predominantly by shivering, mice kept at room temperature (22°C–23°C) have more BAT and respond to acute cold exposure by both BAT activation (NST) and shivering. Prolonged cold exposure (cold acclimation) provokes the recruitment of new brown adipocytes and the biogenesis of mitochondria to cope with chronically increased thermogenesis by the uncoupling process in BAT (Davis et al., 1960). This acclimation process requires several weeks (adaptive NST). To test whether ATGL-deficient mice can cope with cold acclimation for 3 weeks at 5°C, we used AKO/cTg mice lacking ATGL in all cells of the body except cardiomyocytes and measured core body temperature (CBT) using implanted telemetry devices and analyzed brown adipocyte recruitment.
AKO/cTg mice tolerated cold well during cold acclimation (Figure 5A). Over a time course of 3 weeks, the mean CBT was higher in AKO/cTg (+1.0°C and +0.4°C during light and dark phase) than in WT/cTg mice (Figure 5B). Similar to AKO/cTg mice, AAKO and iBAKO mice maintained body temperature during cold acclimation at 5°C (data not shown), consistent with the assumption that BAT-ATGL is not required for NST. Similar to our observations in mice during acute cold exposure (Figure S5C), analyses of relative gene expression revealed decreased levels of classical brown fat genes upon cold acclimation (Figure S6). A physiological relevant measure for thermogenic capacity is the amount of UCP-1 protein per animal (Cannon and Nedergaard, 2004). As expected, UCP-1 protein expression per milligram protein of BAT homogenate increased in both genotypes upon cold acclimation compared to normal housing temperatures, but was relatively lower in AKO/cTg mice when normalized to GAPDH expression (Figure 5C). Total protein content in whole BAT depots also increased upon cold acclimation in both genotypes and was higher in AKO/cTg than in WT/cTg mice due to hyperplasia (Figure 5D). Accordingly, a calculation of total UCP-1 protein amount in BAT depots revealed no difference between AKO/cTg and WT/cTg mice (Figure 5E). Together, these results are consistent with normal recruitment of brown adipocytes in AKO/cTg mice.
Figure 5.

ATGL-Deficient Mice Survive upon Cold Acclimation and Exhibit Normal Brown Adipocyte Recruitment
(A and B) Time course (A) and mean (B) core body temperature (CBT) of ad libitum-fed AKO/cTg mice during cold acclimation at 5°C for 3 weeks using implantable telemetry transmitters (n = 5).
(C) UCP-1 immunoblot of BAT homogenates.
(D) Total protein content from whole BAT depots (n = 3–5).
(E) Calculated total UCP-1 protein amount per BAT of mice housed at 22°C (n = 3) or 5°C for 3 weeks (n = 5).
Analyses were performed in ad libitum-fed male AKO/cTg mice aged 10–12 weeks. Data are presented as means ± SD. Statistical significance was evaluated by unpaired two-tailed Student’s t test. ∗p < 0.05 and ∗∗∗p < 0.001. See also Figure S6.
Adaptive NST Is Intact in ATGL-Deficient BAT
To establish a potential role of ATGL in adaptive NST, we analyzed the metabolic response to the β3-receptor agonist CL 316,243 (CL) and measured metabolic rates (VO2) using indirect calorimetry as well as plasma FA concentrations. We used the iBAKO and AAKO mouse models to differentiate between BAT- and WAT-specific effects of ATGL deficiency on NST in vivo. Moreover, we performed the experiments in two separate cohorts of mice upon prior acclimation for 3 weeks to either thermoneutrality or cold. BAT should be “inactive” at thermoneutrality, but maximally “active” upon cold acclimation. Thus, the difference in metabolic rates between thermoneutrality and cold acclimation represents BAT-NST mediated via UCP-1 (Golozoubova et al., 2006, Virtue and Vidal-Puig, 2013).
BAT gross morphology of cold-acclimatized iBAKO and AAKO mice (Figures S7A and S7C) was similar as observed during normal housing temperatures at 22°C–23°C (Figure 2D). Histological analyses revealed morphological changes in both knockout models with many multilocular lipid droplets upon cold acclimation compared to unilocular lipid droplets during normal housing temperatures (Figures S7B and S7D, compared to Figure 2E). Glycerol kinase (GyK), a key enzyme in re-esterification and replenishment of the TG pool, was upregulated in both knockout models (Figures S7F and S7E). The underlying mechanism for this upregulation is currently unclear.
CL treatment of iBAKO and ATGLflox/flox control mice kept at thermoneutrality resulted in an indistinguishable response with regard to metabolic rates, plasma FA concentrations, and body temperature (Figures 6A–6D). In contrast, AAKO mice exhibited a severely impaired β3-adrenergic response to CL at thermoneutrality with blunted metabolic rates, decreased plasma FA concentrations, and decreased body temperature. Upon cold acclimation, metabolic rates increased in mice of all genotypes. Yet while iBAKO mice behaved similarly to ATGLflox/flox control mice in response to CL, AAKO exhibited a considerably decreased response (Figure 6E–6H). Interestingly, and similar to AKO/cTg upon cold acclimation (Figures 5A and 5B), cold-acclimatized iBAKO mice exhibited moderately higher body temperature than ATGLflox/flox control mice upon 60 min of CL administration (Figure 6H). Although the reason why mice lacking ATGL in BAT “overheat” remains elusive, it is evident that iBAKO mice respond normally to β3-adrenergic stimulation in the absence of BAT-ATGL, arguing for functional WAT lipolysis and intact NST. In contrast, the absence of ATGL-mediated lipolysis in WAT of AAKO mice leads to insufficient substrate supply and a concomitant decrease in metabolic rates and body temperature in response to CL. This inadequate response was observed in mice acclimatized to thermoneutrality and cold at 5°C for 3 weeks.
Figure 6.

Adaptive NST Is Intact in ATGL-Deficient BAT
(A–D) Studies in mice acclimatized to thermoneutrality (28°C–30°C).
(E–H) Studies in mice acclimatized to cold (5°C).
(A and E) Time course of metabolic rates (VO2) during basal and upon CL administration upon acclimation to thermoneutrality (A) and to cold (E) (n = 5–9).
(B and F) Mean metabolic rates during basal and upon CL administration upon acclimation to thermoneutrality (B) and to cold (F) (n = 5–9).
(C and G) Plasma FA levels upon 15 min of CL injection upon acclimation to thermoneutrality (C) and to cold (G) (n = 5–9).
(D and H) Body temperature upon 60 min of CL injection upon acclimation to thermoneutrality (D) and to cold (H) (n = 4–6).
For analyses upon thermoneutrality, male iBAKO, AAKO, and ATGLflox/flox control mice aged 25–30 weeks were acclimatized for 3 weeks to thermoneutrality at 28°C–30°C (A–D). For analyses upon cold acclimation, male iBAKO, AAKO, and ATGLflox/flox control mice aged 8–12 weeks were acclimatized to cold at 5°C for 3 weeks (E–H). For iBAKO mice, Atgl gene deletion was induced 1 week prior to acclimation to thermoneutrality or cold. During cold acclimation, iBAKO and ATGLflox/flox control mice received tamoxifen twice per week to maintain Atgl gene deletion. Analyses in iBAKO mice were performed 4 weeks upon tamoxifen administration. Independent of prior acclimation temperatures, metabolic rates (VO2) were analyzed at 28°C–30°C in pentobarbital-anesthetized mice using indirect calorimetry (Phenomaster, TSE). Data are presented as means ± SD, except for (A) and (E) showing means. Statistical significance was evaluated by unpaired two-tailed Student’s t test or two-way ANOVA and Bonferroni post hoc tests. ∗p < 0.05, ∗∗p < 0.01, and ∗∗∗p < 0.001 versus control and §p < 0.05 and §§§p < 0.001 versus basal. See also Figure S7.
Consistent with defective lipolysis in WAT, cold-acclimatized AKO/cTg and AAKO mice exhibited lower plasma FA concentrations and consumed more food during the light period than cold-acclimatized control or iBAKO mice that are able to mobilize FAs via WAT lipolysis (Table S2). The ability of iBAKO to mobilize FAs from WAT led to moderately smaller epiWAT depots upon cold acclimation, while AKO/cTg and AAKO mice retained increased WAT depots (Table S2).
Impaired or less active BAT may be compensated by alternative mechanisms of heat production like browning of ingWAT. To test whether this occurs upon loss of ATGL, we used iBAKO and AAKO mice and acclimatized them to cold at 5°C for 3 weeks. Marked UCP-1 protein levels were present in ingWAT of mutant and control mice (Figures S7G and S7H). However, we observed normal or decreased UCP-1 protein levels in iBAKO and AAKO ingWAT, respectively, compared to ingWAT of ATGLflox/flox control mice. This suggested that the loss of BAT-ATGL does not cause increased WAT browning.
Discussion
For more than a decade, the lipolytic hydrolysis of TGs in brown adipocytes has been considered essential for cold-induced NST. In particular, the indispensable role of ATGL in this process was emphasized based on both in vivo findings and cell culture experiments. Key observations in this context included the severe cold intolerance of AKO and AAKO mice (Ahmadian et al., 2011, Haemmerle et al., 2006). Additional mechanistic studies with brown adipocyte cell lines or isolated brown adipocytes assigned a crucial role to ATGL-mediated lipolysis for the provision of FAs for UCP-1 activation (Li et al., 2014), oxidation and generation of reducing equivalents, and PPAR-α signaling (Mottillo et al., 2012). Nevertheless, direct proof for an indispensable role for ATGL action in BAT-mediated thermogenesis is missing.
In the current study, we used five different mouse models to elucidate the significance of tissue-specific ATGL expression in BAT, WAT, and cardiac muscle for NST upon acute and chronic cold exposure. Contradicting the current view, we found that ATGL activity in BAT is not required for cold-induced NST. Our conclusion is based on three fundamental findings. (1) iBAKO, AAKO, and “heart-rescued” AKO/cTg mice, all of which lack ATGL in brown adipocytes, maintained normal body temperature during acute cold exposure and cold acclimation in the ad libitum-fed state. (2) iBAKO mice responded normally to β3-adrenergic stimulation with regard to metabolic rates, plasma FA levels, and body temperature at thermoneutrality and cold acclimation. (3) ATGL-deficient BAT expressed normal amounts of UCP-1 protein per BAT depot and compensatory mechanisms like browning of ingWAT were not observed. Together, these findings strongly argue for an intact adaptive NST in mice lacking ATGL in BAT.
This raises the question of the origin of FAs—independent of ATGL—for UCP-1 activation (Prusiner et al., 1968), oxidation (Cannon and Nedergaard, 2004), and PPAR-α regulation (Ahmadian et al., 2011, Barbera et al., 2001) in BAT. In principle, four sources exist to supply FAs. (1) Endogenous FAs are generated by intracellular lipolytic pathways in BAT. In the absence of ATGL, alternative neutral lipases such as HSL or lipophagy (Martinez-Lopez et al., 2016) may fulfill this task and detectable remnant lipase activities in ATGL-deficient BAT argue for the presence of alternative TG hydrolases in BAT. (2) Exogenous FAs are delivered via the circulation and derive from the diet (during feeding) or from WAT lipolysis (during fasting). (3) Exogenous FAs can be additionally delivered by circulating lipoproteins such as intestinal chylomicrons or liver-derived VLDL. The release of FAs from lipoprotein-associated TGs requires either the activity of lipoprotein lipase in the capillary lumen or whole lipoprotein particle uptake into BAT and subsequent lysosomal TG hydrolysis (Bartelt et al., 2011, Young and Zechner, 2013). (4) Although more unlikely, FAs may originate from de novo synthesis.
Our data highlight the crucial importance of these alternative pathways in NST. During fasting, ATGL-catalyzed TG hydrolysis in WAT is indispensable for NST. In iBAKO mice, lacking ATGL exclusively in BAT, the β3-adrenergic response to CL stimulation led to normal increases in metabolic rates, plasma FA concentrations (due to intact WAT lipolysis), and body temperature. This response was severely impaired in AAKO mice lacking ATGL in BAT and WAT. Consistent with a strict dependence on ATGL-mediated lipolysis in WAT during fasting, all mouse lines lacking ATGL in WAT (AAKO and AKO/cTg) were highly sensitive to food restriction during cold exposure. In fact, even at room temperature (22°C–23°C), fasting caused a pronounced hypothermia. In the cold, hypothermia was aggravated and lethal upon food deprivation, but reversible upon refeeding. These observations not only show that functional NST depends on WAT lipolysis during fasting, but also emphasize the metabolic flexibility of BAT. We assume that during feeding, chow-derived glucose, circulating unesterified FAs, and/or TG-rich lipoprotein-associated FAs are sufficient as energy substrates for thermogenesis in mice lacking ATGL in WAT and BAT.
Finally, our data emphasize the importance of a functional cardiovascular and hemodynamic system to meet the increased metabolic demand during cold. Mice with impaired heart function (“old” AKO and iHAKO mice) were unable to maintain their body temperature during acute cold while mice with normal heart function (“young” AKO and iHAKO as well as AKO/cTg mice) tolerated cold well. Heart failure in AKO mice was characterized by maladaptive hypertrophy and low ejection fraction. Our data also suggest that AKO mice exhibit tachycardia and autonomic imbalance (sympathetic hyperactivation) under normal conditions. Upon cold stress, AKO mice were incapable of adequately increasing HR and thus cardiac output, which may cause impaired blood flow and substrate supply for thermogenesis. Our statistical model reinforces the hypothesis that impaired cardiac reserve in AKO mice is responsible for cold intolerance. Early studies in BAT research already showed that cold not only stimulates NST, but also increases cardiac output and blood flow (Foster and Frydman, 1979, Jansky and Hart, 1968). Similarly, cold intolerance was also shown in other models of impaired heart function (Gao et al., 2015, Mancuso et al., 2007, Xiong et al., 2014). The cold intolerance in AKO and iHAKO was independent of the presence or absence of ATGL in BAT and/or WAT.
In summary, using highly informative mutant mouse models, we delineate the tissue-specific role of ATGL-mediated lipolysis in NST under energy-sufficient and energy-deprived conditions. Our study demonstrates that ATGL in neither BAT nor WAT is essential for NST in the presence of sufficient dietary (mostly carbohydrate) substrate supply. In the absence of food, ATGL-mediated lipolysis in WAT becomes an indispensable process to provide FAs as fuel substrate. These results imply that both glucose and FAs are utilized as fuel for coping with cold, arguing for a high metabolic flexibility of BAT depending on the nutritional status. Finally, our data reinforce the importance of an intact cardiovascular system to manage cold stress.
STAR★Methods
Key Resources Table
| REAGENT or RESOURCE | SOURCE | IDENTIFIER |
|---|---|---|
| Antibodies | ||
| ATGL | Cell Signaling | Cat#2138; RRID: AB_2167955 |
| UCP-1 | Abcam | Cat#ab10983; RRID: AB_2241462 |
| Glycerol kinase (GyK) | Abcam | Cat#ab126599; RRID: AB_11129767 |
| GAPDH | Cell Signaling | Cat#2118; RRID: AB_561053 |
| Ndufs1 | Abcam | Cat#ab157221 |
| Rabbit-HRP | Cell Signaling | Cat#7074; RRID: AB_2099233 |
| Chemicals, Peptides, and Recombinant Proteins | ||
| CL 316,243 | Sigma | Cat#C5976 |
| Leupeptin | Roth | Cat#CN33.3 |
| Antipain | Roth | Cat#2933.2 |
| Pepstatin | Roth | Cat#2936.2 |
| PVDF membrane, 0.45 μm | Roth | Cat#T830.1 |
| Protein Assay Dye | Bio-Rad | Cat#500-0006 |
| BCA Protein Assay | Pierce | Cat#23225 |
| Clarity Western ECL Substrate | Bio-Rad | Cat#170-5061 |
| Triolein | Sigma-Aldrich | Cat#T7140 |
| Triolein, [9,10-3H(N)] | Perkin Elmer | Cat#NET431L |
| Phosphatidyl-Choline | Sigma-Aldrich | Cat#P3556 |
| Phosphatidyl-Inositiol | Sigma-Aldrich | Cat#P0639 |
| BSA, essentially fatty acid free, 96% | Sigma-Aldrich | Cat#A6003 |
| Rotiszint eco plus (scintillation cocktail) | Roth | Cat#0016.3 |
| Collagenase Type CLS II | Worthington | Cat#LS004177 |
| Dispase II | Sigma-Aldrich | Cat#04942078001 |
| DNeasy Blood & Tissue Kit | QIAGEN | Cat#69504 |
| Trizol | Invitrogen, Thermo Fisher Scientific | Cat#15596-018 |
| Dnase I | Invitrogen, Thermo Fisher Scientific | Cat#18068-015 |
| High-Capacity cDNA Reverse Transcription Kit | Applied Biosystems, Thermo Fisher Scientific | Cat#4374966 |
| Maxima SYBR Green | Fermentas, Thermo Fisher Scientific | Cat#K0223 |
| Pyruvate, sodium salt | Sigma-Aldrich | Cat#P2256 |
| Glycerol-3-phosphate, bis(cyclohexylammonium) salt | Sigma-Aldrich | Cat#G7886 |
| Rotenone | Sigma-Aldrich | Cat#R8875 |
| Guanosine 5′-diphosphate, disodium salt | Sigma-Aldrich | Cat#51060 |
| Atglistatin (ATGLi) | Mayer et al., 2013 | N/A |
| HSL inhibitor (HSLi) | Novo Nordisk, DK; Schweiger et al., 2006 | N/A |
| Critical Commercial Assays | ||
| NEFA-HR(2) R1 Set | Wako Chemicals | Cat#434-91795 |
| NEFA-HR(2) R2 Set | Wako Chemicals | Cat#436-91995 |
| Infinity Triglyceride Reagent | Thermo Fisher Scientific | Cat#TR22421 |
| Free gylcerol reagent | Sigma-Aldrich | Cat#F6428 |
| Experimental Models: Organisms/Strains | ||
| Mouse: AKO: ATGL−/−; B6;129P2-Pnpla2tm1Rze/J | (Haemmerle et al., 2006); The Jackson Laboratory | Cat#019003 |
| Mouse: AKO/cTg: ATGL−/−/α-MHC-ATGL transgene+/− | (Haemmerle et al., 2011, Schreiber et al., 2015) | N/A |
| Mouse: ATGLflox/flox: B6N.129S-Pnpla2tm1Eek/J | (Sitnick et al., 2013); The Jackson Laboratory | Cat#024278 |
| Mouse: UCP1-CreER | (Rosenwald et al., 2013) | N/A |
| Mouse: Adiponectin-Cre: B6; FVB-Tg(Adipoq-cre)1Evdr/J | (Eguchi et al., 2011); The Jackson Laboratory | Cat#010803 |
| Mouse: α-MHC-MerCreMer: B6.FVB(129)-A1cfTg(Myh6-cre/Esr1∗)1Jmk/J | The Jackson Laboratory | Cat#005657 |
| Mouse: iBAKO: ATGLflox/flox/ UCP1-CreER+/− | This paper | N/A |
| Mouse: AAKO: ATGLflox/flox/ Adiponectin-Cre+/− | (Schoiswohl et al., 2015); this paper | N/A |
| Mouse: iHAKO: ATGLflox/flox/ α-MHC-MerCreMer+/− | (Kienesberger et al., 2013); this paper | N/A |
| Mouse: UKO: UCP1−/−; B6.129-Ucp1tm1Kz/J | The Jackson Laboratory | Cat#003124 |
| Oligonucleotides | ||
| A full list of sequences is listed in Table S3. | This paper | N/A |
| Software and Algorithms | ||
| Image Lab software (version 5.2.1) | Bio-Rad | http://www.bio-rad.com/en-us/product/image-lab-software |
| PhenoMaster software | TSE | N/A |
| Dataquest A.R.T. software (version 4.31) | DSI | N/A |
| DatLab software (version 5.1.1.91) | OROBOROS Instruments | N/A |
| MATLAB | MathWorks | N/A |
| itk-SNAP (version 3.2.0) | (Yushkevich et al., 2006) | http://www.itksnap.org/pmwiki/pmwiki.php |
| GraphPad Prism 6 | GraphPad Software | N/A |
| SPSS Statistics 24 | IBM | N/A |
| Other | ||
| R/M-H Extrudate | Ssniff | Cat#V1126-037 |
Contact for Reagent and Resource Sharing
Further information and requests for resources and reagents should be directed to and will be fulfilled by the Lead Contact, Rudolf Zechner (rudolf.zechner@uni-graz.at).
Experimental Model and Subject Details
Animal Models
General animal study details
All animal protocols were approved by the Austrian Federal Ministry for Science, Research, and Economy (protocol numbers BMWF-66.007/0017/-II/3b/2013 and BMWFW-66.007/0006/-WF/V/3b/2014) and the ethics committee of the University of Graz, and were conducted in compliance with the council of Europe Convention (ETS 123).
Mice were bred and maintained under specific pathogen free conditions. Cages and water were autoclaved, and regular chow diet (R/M-H Extrudate, V1126-037, Ssniff Spezialdiäten GmbH, Soest, Germany) was irridated. Cages were supplemented with nesting material and gnawing sticks, and were changed once weekly. Health status of mice was monitored according to FELASA (Federation of European Laboratory Animal Science Associations) guidelines 3 times per year using the dirty bedding sentinel program. Regular housing temperatures were maintained between 22°C–23°C (71.6°F–73.4°F) with a 14 hr light – 10 hr dark cycle. Mice were maintained in groups with 2–4 mice per cage and had ad libitum access to water and regular chow diet. After animal protocols were completed, mice were anesthetized using isoflurane and blood was collected via the retro-orbital sinus. Mice were euthanized by cervical dislocation; tissues were dissected and immediately processed or flash-frozen in liquid N2. Plasma and tissue samples were stored at −80°C until further analyses.
For all studies, age- and sex-matched littermates were used as controls. Genotype, sex, age, and number of mice are indicated for each experiment in the appropriate figure legends. Mice were allocated to experimental groups according to genotype and sex. Immune status of mice was not compromised due to the various genetic deletions. Mice were treatment naive at the time of the study – except for inducible mutant mice receiving tamoxifen treatment (please see below for iBAKO and iHAKO mice).
Global ATGL knockout mice
Global ATGL knockout (AKO) mice were generated by breeding heterozygous AKO mice (Haemmerle et al., 2006, Haemmerle et al., 2011). AKO mice were backcrossed into C57BL/6J for > 10 generations. Independent of sex, AKO mice fed a regular chow diet are moderately obese with a ∼2-fold increase in total body fat mass and develop a progressive cardiomyopathy leading to premature death at the age of ≥ 12 weeks for males and ≥ 16 weeks for females (Haemmerle et al., 2006). Cold experiments were performed in 6- to 10-week-old AKO mice.
Inducible BAT-specific ATGL knockout mice
ATGLflox/flox control mice (Sitnick et al., 2013; The Jackson Laboratory; JAX stock number 024278; backcrossed into C57BL/6J for two generations) were bred with UCP1-CreER (Rosenwald et al., 2013; genetic background: C57BL/6N) mice to obtain inducible BAT-specific ATGL knockout (iBAKO) mice. Atgl gene deletion was induced by oral gavage of 2 mg tamoxifen (Sigma-Aldrich, St. Louis, MO) solubilized in peanut oil (Sigma) per mouse for 5 consecutive days. Both iBAKO and ATGLflox/flox littermates obtained tamoxifen treatment. As indicated in the figure legends, studies were performed 4–8 weeks after the first tamoxifen administration.
Prior to acclimation of iBAKO and ATGLflox/flox control mice for 3 weeks to thermoneutrality at 28°C–30°C or cold at 5°C, Atgl gene deletion was induced as described above. Thereafter, mice were allowed to acclimatize to the new ambient temperature. To maintain Atgl gene deletion during cold acclimation, an extended treatment strategy was applied to iBAKO and ATGLflox/flox littermates with 2 mg tamoxifen per mouse being orally administered twice per week.
Adipocyte-specific ATGL knockout mice
ATGLflox/flox mice were crossbred with Adiponectin-Cre mice (Eguchi et al., 2011; The Jackson Laboratory; JAX stock number 010803; genetic background: C57BL/6J) to obtain adipocyte-specific ATGL knockout (AAKO) mice. Body composition of AAKO mice was similar as previously published (Schoiswohl et al., 2015). Body weight was unchanged compared to ATGLflox/flox control mice, but fat mass was ∼1.7-fold higher.
“Heart-rescued” AKO mice
Mutant AKO mice with a cardiac-specific ATGL transgene overexpression (AKO/cTg mice; “heart-rescued” AKO mice) were generated by breeding heterozygous AKO with heterozygous AKO mice that were also heterozygous for the cardiomyocyte-specific α-MHC-ATGL transgene (Haemmerle et al., 2011, Schreiber et al., 2015). Wild-type (WT) mice overexpressing the α-MHC-ATGL transgene (WT/cTg) were used as controls. AKO/cTg mice were backcrossed into C57BL/6J for > 10 generations. Independent of sex, AKO/cTg phenocopy AKO mice in regard to body composition, but exhibit no cardiomyopathy and show a life expectancy similar to WT/cTg mice (Haemmerle et al., 2011, Schreiber et al., 2015).
Inducible Heart-specific ATGL knockout mice
ATGLflox/flox mice were bred with α-MHC-MerCreMer mice (The Jackson Laboratory, JAX stock number 005657; backcrossed into C57BL/6J for > 10 generations) to obtain inducible heart-specific ATGL knockout (iHAKO) mice. Deletion of the Atgl gene was induced in mice aged ≥ 12 weeks by oral gavage of 50 mg tamoxifen per kg body weight for 5 consecutive days. Both iHAKO and ATGLflox/flox littermates obtained tamoxifen treatment. Experimental protocols were performed in mice 6- or 10-weeks after the first tamoxifen administration (postTAM). Heart-specific Atgl gene deletion did not change overall body, but affected heart function (Kienesberger et al., 2013; and results within this study).
UCP-1 knockout mice
Heterozygous mice were used to breed UCP-1 knockout (UKO) mice (The Jackson Laboratory; JAX stock number 003124) at standard ambient temperatures at 22°C–23°C.
Method Details
In vivo studies
Studies at cold and thermoneutrality
For acute cold studies, mice were transferred from 22°C–23°C to 5°C for indicated time periods. Acute cold studies were started between 9–10 am. For cold acclimation studies, mice were transferred from 22°C–23°C to 5°C and maintained at 5°C for 3 weeks. For all cold studies, mice were single-housed without nesting material and had free access to food and water unless otherwise stated. For acclimation to thermoneutrality, mice were transferred to a room with controlled ambient temperature at 28°C– 30°C and a humidity of 35–45% for 3 consecutive weeks.
Body temperature
Body temperature was assessed in conscious mice using a rectal probe RET-3 (Physitemp, Clifton, NJ). Core body temperature (CBT) was studied using implantable telemetry devices (TA-F10, Data Sciences International, DSI, St. Paul, MN). For the implantation of telemetry devices, mice were anesthetized with 80 μg ketamine and 8 μg xylazine per g body weight. The abdominal skin region was depilated and disinfected with iodine-containing solution (Betadine). Thereafter, a small vertical skin incision was made in the center of the abdomen, the peritoneal cavity was opened, and a sterile telemetry device was inserted. The peritoneum and the abdominal skin were closed using absorbable sutures and wound clips, respectively. Mice were returned to their home cages and kept on heating plates at 37°C until full consciousness was retrieved. Animals received 0.1 mg enrofloxacin and 2 mg ibuprofen per ml drinking water for 1 week. Together, mice were allowed to recover from surgery for at least 2 weeks. Finally, wound clips were removed before the start of analyses. CBT was continuously assessed at an interval of 2 min for indicated time periods. Data acquisition and analyses were performed using Dataquest A.R.T. software (version 4.31; DSI). CBT is presented as mean over group.
Fasting regimen
Overnight fasting studies were performed at 22°C–23°C from 7 pm until 7 am and subsequent refeeding for 1 hr. For fasting experiments at 5°C, ad libitum-fed mice were transferred to new cages at 9 am for indicated time periods. Mice were removed from the cold when their body temperature dropped below 28°C.
Food intake
During cold acclimation at 5°C for 3 weeks, food intake was determined by manually weighing the food from single cages every day at 9 am and 6 pm representing dark and light periods, respectively.
Magnetic resonance imaging
Magnetic resonance imaging (MRI) measurements were performed using a 7T small animal MRI (Bruker BioSpec, Ettlingen, Germany) equipped with a 660 mT/m gradient coil. A 86-mm-diameter transmit coil was used in combination with a 20-mm-diameter surface coil for receive. Mice were anesthetized (1.5–2.0% isoflurane with 98–98.5% O2) and scanned in prone position. Body temperature was maintained at 37°C by a water heated animal bed. ECG electrodes were placed on the right front and left back paws, and a balloon pressure sensor was placed on the abdomen for respiratory gating.
Cine MR images were acquired using an ECG-triggered and respiratory-gated gradient echo sequence with the following parameters: pulse repetition time/echo time = 11.5/2.65 ms, α = 15°, 8 averages, an image matrix of 192 × 192 at a FOV of 25 × 25 mm2 and a slice thickness of 1 mm. Two slices were acquired per repetition with an inter-slice gap of 1 mm. Whole heart coverage in short axis view was achieved by 4 slice packages interleaved by 1 mm inter-slice shift resulting in 8 image slices without slice gaps covering the heart from apex to base. MRI acquisitions started at the up-slope of the ECG R-wave and 9 cardiac frames were consecutively recorded. Total imaging time was approximately 20 min.
The myocardial wall was manually segmented in all short axis views using itk-SNAP (version 3.2.0) (Yushkevich et al., 2006) to obtain left-ventricular (LV) epicardial and endocardial volumes at the end-diastole and end-systole while papillary muscles were excluded from the lumen. LV mass was calculated from end-diastolic myocardial volume using a tissue density of 1.04 g/cm3. Ejection fraction was obtained by the difference of end-diastolic and end-systolic endocardial volume divided by the end-diastolic endocardial volume multiplied by 100%.
ECG and heart rate analyses using telemetry
ECG recordings were obtained using radio frequency transmitters (TA10ETA-F20, DSI). ECG telemetry devices were implanted subcutaneously in the back space (lead II configuration) of 7-week-old male AKO mice and age-matched WT littermates (body weight: 21–25 g) under general anesthesia using avertin (0.025 mg per kg body weight). Body temperature was maintained at 37°C by a thermostatically controlled heating pad until recovery from anesthesia. Mice were allowed to recover from the surgery for 6 days and body weight was daily monitored. After convalescence and reaching the age of 8 weeks, telemetry was continuously recorded for 24 hr starting at 6 am in ambulatory, unrestrained mice at an ambient temperature of 22°C–23°C for baseline measurements. Then, mice were exposed to acute cold at 5°C for 4 hr. ECG signals were acquired at a sampling rate of 1 kHz.
Beat-to-beat alterations in the heart rate (HR) were analyzed offline using a custom-made script (MATLAB, MathWorks, Natick, MA) using the periodic variation in R-R intervals. ECG signals were scanned for R-wave detection and calculation of R-R intervals and HR. Given the non-stationary nature of ECG signals in mice, multiple short-term recordings were analyzed (Thireau et al., 2008). A total of 6 recordings in 2 hr intervals and each lasting for 180 s during a period of minimal animal movement (telemetry-monitored motor activity) were selected. The selected recordings were examined visually (on the tachogram) and by predefined formulas in the script for the detection of any ectopic beats, which were strictly excluded to avoid confounding effects on the HR variability analysis. All included recordings had less than 5% of the total beat count identified as ectopic.
R-R interval time-series were transformed and studied in the frequency domain using the power spectral density analysis with moderate modifications to adapt the analysis for the fast heart rates of a mouse (Abdellatif et al., 2016). R-R interval values were linearly interpolated to generate an equi-distant time-series at a new sampling frequency of 20 Hz and were then detrended using a sixth-order polynomial fitting. Power spectral density analysis was performed using the Welch method by dividing the signal into 1800-point segments with 50% overlap followed by a fast Fourier transformation on each hanning-windowed segment. Segments were averaged and squared to obtain the frequency components of each time-series. The resulting periodograms had a minimum frequency resolution of 0.0111 Hz. Autospectra were integrated between the cut-offs of low and high frequency (LF and HF, respectively) powers of mouse HR variability, 0.4-1.5 Hz and 1.5-4 Hz, respectively. The LF/HF ratio was calculated as a measure of autonomic activity.
To analyze the effect of the two dependent parameters of body temperature on HR and vice versa, we used analysis of covariance (ANCOVA) (Tschöp et al., 2011). For details, please see the “Quantification and Statistical Analysis” section.
Analyses of non-shivering thermogenesis
To test the non-shivering thermogenic (NST) capacity, metabolic rates upon administration of the β3-receptor agonist CL 316,243 (Sigma) were studied using a laboratory animal monitoring system (PhenoMaster, TSE Systems GmbH, Bad Homburg, Germany). Mice were anesthetized with pentobarbital (75 mg per kg body weight, i.p. injection), which does not inhibit NST (Fischer et al., 2016, Virtue and Vidal-Puig, 2013). Basal metabolic rates were monitored for subsequent 30 min until reaching steady-state. Then, CL 316,243 was injected i.p. using a dosage of 1 mg per kg body weight. The subsequent increase in metabolic rates was monitored for 60–80 min. Prior to the analyses, mice were acclimatized for 3 weeks to thermoneutrality at 28°C–30°C or cold at 5°C (see also “Studies at cold and thermoneutrality”). Metabolic rates were monitored at thermoneutral temperature (28°C–30°C) independent of prior acclimation temperatures (Virtue and Vidal-Puig, 2013). Control and knockout mice were analyzed in parallel in an interval of 2 min (1 min per cage). Data were analyzed using PhenoMaster software and are expressed as VO2 (ml/h).
Ex vivo studies
BAT fractionation
Fresh BAT depots were collected and freed from WAT. BAT was finely minced into small pieces and digested using Collagenase Type CLS II (1 mg/ml, 332 U/mg; Worthington Biochemical Incorp., Lakewood, NJ) and Dispase II (3.3 mg/ml; 0.9 U/mg; Sigma) dissolved in PBS supplemented with 10 mM CaCl2 for 45–60 min at 37°C and 110 rpm. Enzymes were inactivated by the addition of DMEM containing 10% FBS. Then, cell suspensions were filtered through a 100 µm cell strainer. To fractionate different cell types, brown adipocytes were allowed to float (for AKO and iBAKO mice only to avoid undesired bursting of lipid-loaden adipocytes) and adipocytes from AKO and iBAKO were collected. Then, the remaining cell suspensions of all genotypes were spun for 10 min at room temperature and 200 x g. The floating brown adipocytes were collected. To pellet cells from the stroma-vascular fraction (SVF), the remaining cell suspensions were centrifuged for 10 min at room temperature and 1,000 x g. Supernatants were disposed, SVF cells were treated with erythrocyte lysis buffer (154 mM NH4Cl, 10 mM KHCO3, 0.1 mM EDTA pH: 7.4) for 2 min, and cells were washed with PBS. Fractionation of BAT from control and mutant mice was performed in parallel. DNA from isolated brown adipocytes and SVF was isolated as described below.
Analyses of oxygen consumption rates
Fresh BAT depots were collected and freed from WAT. BAT was finely minced into small pieces, homogenized in ice-cold 250 mM sucrose for 2–3 s using Ultra-Turrax Homogenizer. Prior to the analyses, homogenates were freed from connective tissue using a 100 µm cell strainer. Oxygen consumption rates (OCRs) were measured at 37°C by high-resolution respirometry using polarographic oxygen sensors in a two-chamber oxygraph (OROBOROS Instruments, Innsbruck, Austria). An aliquot of 50 µl of BAT homogenate (total volume = 1 mL per half BAT depot) was incubated in a medium containing 125 mM sucrose, 20 mM K-Tes (pH: 7.2), 2 mM MgCl2, 1 mM EDTA, 4 mM KH2PO4, 3 mM malate, and 0.1% essentially fatty acid (FA)-free BSA. Respiration was analyzed by the following protocol adding substrates sequentially upon reaching steady-state: 5 mM pyruvate (pyr; complex-I), 5 mM glycerol-3-phosphate (G3P; complex-II), 0.5 µM rotenone (R; inhibitor of complex-I), and 2 mM guanosine 5¢-diphosphate (GDP, dissolved in 20 mM K-Tes-buffer pH: 7.2). Substrates and inhibitors were prepared according to Oroboros O2k Protocols (http://www.bioblast.at/index.php/ MiPNet03.02_Chemicals-Media). Data acquisition and analyses were performed using DatLab software (version 5.1.1.91). Analyses of control and mutant mice were prepared and run in parallel. OCRs in BAT homogenates were calculated for whole BAT depot per mouse and are expressed as nmol per s and total BAT depot.
Lipolysis assays
Fresh BAT and epiWAT depots were dissected from ad libitum-fed mice and put into DMEM (GIBCO, Invitrogen, Thermo Fisher Scientific, Waltham, MA) supplemented with 2% FA-free BSA. Adipose tissue (AT) depots were cut into small pieces and transferred into DMEM supplemented with 2% FA-free BSA in 96-well plates for 30 min (pre-incubation). To analyze basal lipolysis, AT pieces were transferred into 150 µl fresh media and incubated for further 60 min. Then, AT pieces were transferred into 150 µl DMEM supplemented with 2% FA-free BSA in the presence of 10 µM isoproterenol (ISO) in 96-well plates and pre-incubated for 30 min. To analyze stimulated lipolysis, AT pieces were transferred into 150 µl fresh media containing 10 µM ISO and incubated for another 60 min. To determine basal and stimulated lipolysis, glycerol content was analyzed in the media. Please see “Blood chemistry” for the analyses of glycerol content. At the end of the experiment, AT pieces were delipidated by CHCl3 extraction and solubilized in 0.3 N NaOH/0.1% SDS at 65°C overnight. Protein content was determined using Pierce BCA Protein assay (Pierce, Thermo Fisher Scientific) and BSA as standard. For each mouse, fat depot, and condition, five replicates were ran in parallel. Data are expressed as glycerol per mg tissue protein.
In vitro studies
Histology
BAT was fixed in 4% buffered formaldehyde and embedded in paraffin. Sections were stained with hematoxylin and eosin using standard protocols. Scale bar, 100 µm.
Transmission electron microscopy
BAT depots from mice exposed to acute cold at 5°C were collected and small fragments of tissue were fixed in 2.5% glutaraldehyde and 0.5% paraformaldehyde in 0.1 M phosphate buffer, pH: 7.4 for 2 hr. Then, tissues were rinsed in 0.1 M phosphate buffer for 30 min and post-fixed in 2% osmium tetroxide for 60 min. Tissue pieces were rinsed in 0.1 M phosphate buffer for 30 min and dehydrated in 50%, 70%, 90%, and 100% cold acetone for 20 min each. Thereafter, tissues were infiltrated by 2:1, 1:1, and 1:2 mixtures of 100% acetone and agar 100 epoxy resin (Gröpl, Tulln, Austria) and pure agar 100 epoxy resin for 4 hr. The tissues were then placed in agar 100 epoxy resin at room temperature for 8 hr, transferred into embedding molds and polymerized at 60°C for 48 hr. Ultrathin sections of 75 nm were cut with a Reichert Ultracut S Ultramicrotome and stained with lead citrate for 5 min and with uranyl acetate for 15 min. Images were taken using a Zeiss EM 902 transmission electron microscope equipped with a digital camera system. Scale bar, 0.5 µm.
Tissue Homogenization
AT depots (BAT, epiWAT, ingWAT) were homogenized in ice-cold solution A (0.25 M sucrose, 1 mM EDTA, 1 mM dithiothreitol, pH: 7.0 supplemented with 20 µg/ml leupeptin, 2 µg/ml antipain, 1 µg/ml pepstatin; Carl Roth GmbH & Co KG, Karlsruhe, Germany) using Ultra-Turrax Homogenizer (IKA, Staufen, Germany). For immunoblotting of proteins in AT, homogenates were centrifuged for 10 min at 4°C and 1,000 x g. An aliquot of the supernatant including the fat cake was then delipidated overnight at -20°C using a 5-fold volume of ice-cold acetone. Proteins were precipitated by centrifugation for 30 min at 4°C and 20,000 x g, and solubilized by sonification in solution A. For in vitro TG hydrolase activity assays, homogenates were centrifuged for 30 min at 4°C and 20,000 x g and low-fat tissue infranatants were collected. Protein concentrations were determined using Protein Assay Dye (Bio-Rad Laboratories, Hercules, CA) and BSA as standard.
Isolation of BAT mitochondria
Mitochondria from whole BAT depots were isolated from fresh tissues according to Shabalina et al. (2010). Therefore, BAT depots were cleaned from visible WAT, placed into ice-cold 250 mM sucrose, finely minced, and homogenized using Ultra-Turrax Homogenizer. BAT homogenates were filtered through a 100 µm cell strainer and centrifuged for 10 min at 4°C and 8,500 x g. The resulting supernatant containing floating fat was discarded. Pellets containing nuclei and mitochondria were gently re-suspended in ice-cold 250 mM sucrose using a Potter homogenizer (loose fit) and centrifuged for 10 min at 4°C and 800 x g. The resulting pellets (nuclei) were discarded and the supernatant was again centrifuged for 10 min at 4°C and 8,500 x g. Then, the mitochondrial pellets were washed twice with 100 mM KCl, 20 mM K-Tes (pH: 7.2) were re-pelleted by centrifugation for 10 min at 4°C and 8,500 x g. Mitochondrial protein concentrations were determined using Protein Assay Dye (Bio-Rad) and BSA as standard.
Immunoblotting
Unless otherwise stated, protein samples of 10–50 µg were solubilized, denatured in SDS sample buffer, resolved by SDS-PAGE (10%–12.5% Tris-glycine) and transferred onto a polyvinylidene fluoride (PVDF) transfer membrane (Roth) in CAPS buffer (10 mM CAPS, 10% methanol, pH: 11.0). The membrane was blocked with 10% blotting grade milk powder (Roth) in TST (50 mM Tris-HCl, 0.15 M NaCl, 0.1% Tween-20, pH: 7.4). A list of antibodies is indicated in the Key Resources Table.
Protein expression was visualized by enhanced chemiluminescence using Clarity Western ECL Substrate and ChemiDoc Touch Imaging System (both Bio-Rad). Signal intensities were quantified by densitometric analyses using Image Lab software (version 5.2.1; Bio-Rad).
For the quantification of total UCP-1 tissue protein content upon cold acclimation, whole BAT depots were crushed in liquid N2 using a mortar and pestle. An aliquot was weighed, homogenized, and protein concentrations were determined using Protein Assay Dye (Bio-Rad) and BSA as standard. Total tissue protein content was calculated accounting for total BAT mass. Similarly, an aliquot of indicated total BAT protein was resolved via SDS-PAGE and UCP-1 signal intensities were determined and normalized to GAPDH. Total UCP-1 protein content was calculated accounting for whole BAT protein content.
TG hydrolase activities
Lipolytic activities were assessed as described (Holm and Osterlund, 1999, Schweiger et al., 2014). The TG substrate consisted of 165 nmol triolein (Sigma) and ~1 × 10⁶ cpm triolein [9,10-3H(N)] (NET431L, Perkin Elmer, Waltham, MA) per assay emulsified with 45 µM phosphatidyl-choline/-inositol (3:1, 20 mg/ml, Sigma) in 100 mM K-phosphate buffer (pH: 7.0). Substrates were emulsified by sonication on ice (Virsonic 475, Virtis, Gardiner, NJ). After sonication, substrates were adjusted to 2% FA-free BSA (Sigma). To determine TG hydrolase activities, 100 µl substrate were mixed with 25 µg tissue lysates to obtain a final volume of 200 µl. As blank, 100 µl solution A were incubated under the same conditions as samples. TG hydrolase activities were inhibited using small-molecule inhibitors specific for ATGL (Atglistatin, ATGLi; final concentration: 40 µM, synthesized by R. Breinbauer/TUG, Graz, Austria; Mayer et al., 2013) or for HSL (HSLi; final concentration: 10 µM; gift from NovoNordisk, Copenhagen, DK; Schweiger et al., 2006). The reaction mixture was incubated in a water bath at 37°C for 1 hr. Then, 3.25 mL of methanol/chloroform/heptane (10/9/7, v/v/v) and 1 mL of 0.1 M potassium-carbonate/0.1 M boric acid (pH: 10.5) were added to terminate the reaction. The reaction mixture was intensively vortexed and centrifuged for 10 min at 800 x g. An aliquot of 0.4 mL of the upper aqueous phase was collected in 2 mL Rotiszint eco plus (Roth) and the radioactivity was analyzed using liquid scintillation counting (Rotiszint eco plus, Roth; Tri-Carb 2100TR, Packard Instrument Company, Downers Grove, IL). Corrections for background were accounted using counts obtained for blank incubation. Samples from control and mutant mice were run in parallel and analyzed in duplicates. TG hydrolase activities are expressed as released FA per h and normalized to mg protein.
Nucleic acid isolation and quantification
DNA from whole BAT depots or from fractionated BAT cell types was isolated following manufacturer’s instructions using DNeasy Tissue Kit (QIAGEN, Hilden, Germany). Total RNA was extracted from snap-frozen tissues using Trizol reagent following manufacturer’s instruction (Invitrogen). The quality of RNA was verified by standard agarose gel electrophoresis. DNA and RNA concentrations were analyzed using NanoDrop microvolume spectrophotometer (Thermo Fisher Scientific).
Gene expression and mitochondrial DNA content
For relative gene expression analyses, whole BAT RNA was used to prepare BAT cDNA. To avoid DNA contaminations, 2 µg RNA were digested with Dnase I (Invitrogen; 1U/µl) at 25°C for 15 min followed by heat inactivation of the enzyme at 65°C for 10 min. Thereafter, 1 µg RNA was transcribed using random primers and a High-Capacity cDNA Reverse Transcription Kit (both Applied Biosystems, Thermo Fisher Scientific). Independent of tissue RNA or DNA content, 8–40 ng BAT cDNA or whole BAT DNA were used for the PCR reaction using 10 pmol of forward and reverse primers, Maxima SYBR Green (Fermentas, Thermo Fisher Scientific), and StepOnePlus Real-Time PCR System (Thermo Fisher Scientific). Relative gene expression and mitochondrial (mt) DNA content were analyzed using the ΔΔ-Ct method (Livak and Schmittgen, 2001). Relative gene expression was normalized to TBP or 36B4. Relative mtDNA content was determined as ratio of the copy numbers from the mtDNA encoded gene (MtCO1) to the nuclear DNA encoded gene (Ndufv1). A list of gene-specific primers is available in Table S3.
Blood chemistry
Plasma FA (NEFA-HR(2) R1 and R2 Set, Wako Chemicals, Neuss, Germany), TG (Infinity Triglyceride Reagent, Thermo Fisher Scientific), and glycerol (Free glycerol reagent, Sigma) concentrations were quantified using enzymatic colorimetric methods following manufacturer’s instructions. Blood glucose levels were monitored using Wellion Calla glucometer (MedTrust, Marz, Austria).
Quantification and Statistical Analysis
Figures were prepared using GraphPad Prism 6 (GraphPad Software, San Diego, CA). All data are shown as means ± SD, except otherwise stated. In each experiment, n defines the number of mice. Statistical significance between two groups was determined by unpaired, two-tailed Student’s t test and between more than two groups using two-way analyses of variance (ANOVA) and Bonferroni post hoc tests (SPSS Statistics 24, IBM, Armonk, NY). Statistical significance of Kaplan-Meier plots was analyzed using Gehan-Breslow-Wilcoxon test (GraphPad). A general mixed linear model was used to perform two-way repeated-measurements analysis of covariance (ANCOVA; SPSS Statistics 24) of HR and body temperature, which generated the estimated HR and estimated body temperature values (Tschöp et al., 2011). Normal distribution of data for HR and body temperature residuals and equality of variances were confirmed by Shapiro-Wilk test and Levene’s test, respectively. Apart from this, no statistical method was used to determine whether the data met assumptions of the statistical approach. For HR and ANCOVA analyses, data were excluded from animals whose body temperature did not drop during cold exposure of 4 hr. Apart from this, no exclusion or inclusion criteria had been used for data analyses. Group differences were considered statistically different for ∗, p < 0.05, ∗∗, p < 0.01, and ∗∗∗, p < 0.001. Statistical parameters can be found in the figure legends.
Author Contributions
Conceptualization, R.S. and R.Z.; Methodology, R.S. and R.Z.; Investigation, R.S., C.D., G.S., U.F., N.W., M.A., D.K., J.H., and S.S.; Visualization, R.S.; Resources, E.E.K.; Writing – Original Draft, R.S. and R.Z.; Writing – Review & Editing, R.S., G.S., E.E.K., S.S., P.S., G.H., and R.Z.; Supervision, R.S. and R.Z.; Funding Acquisition, G.S., E.E.K., and R.Z.
Acknowledgments
We thank Sabrina Huetter for excellent technical assistance, Matthias Rosenwald and Christian Wolfrum for the UCP1-CreER mouse, Lukas Groschner and Wolfgang Graier for assistance with high-resolution respirometry analyses, Silvia Schauer and Wael Al-Zoughbi for patho-histological analyses, Thomas O. Eichmann for artwork, and Ellen Zechner for critically reading the manuscript. R.Z. was funded by the Fondation Leducq Transatlantic Network grant 12CVD04, the Louis-Jeantet Prize for Medicine 2015, the European Research Council (ERC) under the European Union’s Seventh Framework Programme (FP/2007-2013)/ERC Grant Agreement n. 340896, LipoCheX, as well as the Wittgenstein Award Z136 and SFB LIPOTOX F3001/F3002, both funded by the Austrian Science Fund (FWF). E.E.K. was funded by NIH R03-DK-077697 and R01-DK-090166. G.S. was funded by P28882-B21. The authors gratefully acknowledge the support of NAWI Graz.
Published: October 5, 2017
Footnotes
Supplemental Information includes seven figures and three tables and can be found with this article online at https://doi.org/10.1016/j.cmet.2017.09.004.
Contributor Information
Renate Schreiber, Email: renate.schreiber@uni-graz.at.
Rudolf Zechner, Email: rudolf.zechner@uni-graz.at.
Supplemental Information
References
- Abdellatif M., Leite S., Alaa M., Oliveira-Pinto J., Tavares-Silva M., Fontoura D., Falcão-Pires I., Leite-Moreira A.F., Lourenço A.P. Spectral transfer function analysis of respiratory hemodynamic fluctuations predicts end-diastolic stiffness in preserved ejection fraction heart failure. Am. J. Physiol. Heart Circ. Physiol. 2016;310:H4–H13. doi: 10.1152/ajpheart.00399.2015. [DOI] [PubMed] [Google Scholar]
- Ahmadian M., Abbott M.J., Tang T., Hudak C.S.S., Kim Y., Bruss M., Hellerstein M.K., Lee H.-Y.Y., Samuel V.T., Shulman G.I. Desnutrin/ATGL is regulated by AMPK and is required for a brown adipose phenotype. Cell Metab. 2011;13:739–748. doi: 10.1016/j.cmet.2011.05.002. [DOI] [PMC free article] [PubMed] [Google Scholar]
- Barbera M.J., Schluter A., Pedraza N., Iglesias R., Villarroya F., Giralt M. Peroxisome proliferator-activated receptor alpha activates transcription of the brown fat uncoupling protein-1 gene. A link between regulation of the thermogenic and lipid oxidation pathways in the brown fat cell. J. Biol. Chem. 2001;276:1486–1493. doi: 10.1074/jbc.M006246200. [DOI] [PubMed] [Google Scholar]
- Bartelt A., Bruns O.T., Reimer R., Hohenberg H., Ittrich H., Peldschus K., Kaul M.G., Tromsdorf U.I., Weller H., Waurisch C. Brown adipose tissue activity controls triglyceride clearance. Nat. Med. 2011;17:200–205. doi: 10.1038/nm.2297. [DOI] [PubMed] [Google Scholar]
- Bukowiecki L.J., Géloën A., Collet A.J. Proliferation and differentiation of brown adipocytes from interstitial cells during cold acclimation. Am. J. Physiol. 1986;250:C880–C887. doi: 10.1152/ajpcell.1986.250.6.C880. [DOI] [PubMed] [Google Scholar]
- Cameron I.L., Smith R.E. Cytological responses of brown fat tissue in cold-exposed rats. J. Cell Biol. 1964;23:89–100. doi: 10.1083/jcb.23.1.89. [DOI] [PMC free article] [PubMed] [Google Scholar]
- Cannon B., Nedergaard J. Brown adipose tissue: function and physiological significance. Physiol. Rev. 2004;84:277–359. doi: 10.1152/physrev.00015.2003. [DOI] [PubMed] [Google Scholar]
- Cannon B., Nedergaard J. Nonshivering thermogenesis and its adequate measurement in metabolic studies. J. Exp. Biol. 2011;214:242–253. doi: 10.1242/jeb.050989. [DOI] [PubMed] [Google Scholar]
- Chondronikola M., Volpi E., Børsheim E., Porter C., Annamalai P., Enerbäck S., Lidell M.E., Saraf M.K., Labbe S.M., Hurren N.M. Brown adipose tissue improves whole-body glucose homeostasis and insulin sensitivity in humans. Diabetes. 2014;63:4089–4099. doi: 10.2337/db14-0746. [DOI] [PMC free article] [PubMed] [Google Scholar]
- Cypess A.M., Lehman S., Williams G., Tal I., Rodman D., Goldfine A.B., Kuo F.C., Palmer E.L., Tseng Y.-H., Doria A. Identification and importance of brown adipose tissue in adult humans. N. Engl. J. Med. 2009;360:1509–1517. doi: 10.1056/NEJMoa0810780. [DOI] [PMC free article] [PubMed] [Google Scholar]
- Davis T.R.A., Johnston D.R., Bell F.C., Cremer B.J. Regulation of shivering and non-shivering heat production during acclimation of rats. Am. J. Physiol. 1960;198:471–475. doi: 10.1152/ajplegacy.1960.198.3.471. [DOI] [PubMed] [Google Scholar]
- Eguchi J., Wang X., Yu S., Kershaw E.E., Chiu P.C., Dushay J., Estall J.L., Klein U., Maratos-Flier E., Rosen E.D. Transcriptional control of adipose lipid handling by IRF4. Cell Metab. 2011;13:249–259. doi: 10.1016/j.cmet.2011.02.005. [DOI] [PMC free article] [PubMed] [Google Scholar]
- Fedorenko A., Lishko P.V., Kirichok Y. Mechanism of fatty-acid-dependent UCP1 uncoupling in brown fat mitochondria. Cell. 2012;151:400–413. doi: 10.1016/j.cell.2012.09.010. [DOI] [PMC free article] [PubMed] [Google Scholar]
- Fischer A.W., Hoefig C.S., Abreu-Vieira G., de Jong J.M.A., Petrovic N., Mittag J., Cannon B., Nedergaard J. Leptin raises defended body temperature without activating thermogenesis. Cell Rep. 2016;14:1621–1631. doi: 10.1016/j.celrep.2016.01.041. [DOI] [PubMed] [Google Scholar]
- Foster D.O., Frydman M.L. Tissue distribution of cold-induced thermogenesis in conscious warm- or cold-acclimated rats reevaluated from changes in tissue blood flow: the dominant role of brown adipose tissue in the replacement of shivering by nonshivering thermogenesis. Can. J. Physiol. Pharmacol. 1979;57:257–270. doi: 10.1139/y79-039. [DOI] [PubMed] [Google Scholar]
- Gao X., van der Veen J.N., Fernandez-Patron C., Vance J.E., Vance D.E., Jacobs R.L. Insufficient glucose supply is linked to hypothermia upon cold exposure in high-fat diet-fed mice lacking PEMT. J. Lipid Res. 2015;56:1701–1710. doi: 10.1194/jlr.M059287. [DOI] [PMC free article] [PubMed] [Google Scholar]
- Golozoubova V., Cannon B., Nedergaard J. UCP1 is essential for adaptive adrenergic nonshivering thermogenesis. Am. J. Physiol. Endocrinol. Metab. 2006;291:E350–E357. doi: 10.1152/ajpendo.00387.2005. [DOI] [PubMed] [Google Scholar]
- Haemmerle G., Lass A., Zimmermann R., Gorkiewicz G., Meyer C., Rozman J., Heldmaier G., Maier R., Theussl C., Eder S. Defective lipolysis and altered energy metabolism in mice lacking adipose triglyceride lipase. Science. 2006;312:734–737. doi: 10.1126/science.1123965. [DOI] [PubMed] [Google Scholar]
- Haemmerle G., Moustafa T., Woelkart G., Büttner S., Schmidt A., van de Weijer T., Hesselink M., Jaeger D., Kienesberger P.C., Zierler K. ATGL-mediated fat catabolism regulates cardiac mitochondrial function via PPAR-α and PGC-1. Nat. Med. 2011;17:1076–1085. doi: 10.1038/nm.2439. [DOI] [PMC free article] [PubMed] [Google Scholar]
- Hanssen M.J.W., Hoeks J., Brans B., van der Lans A.A., Schaart G., van den Driessche J.J., Jörgensen J.A., Boekschoten M.V., Hesselink M.K., Havekes B. Short-term cold acclimation improves insulin sensitivity in patients with type 2 diabetes mellitus. Nat. Med. 2015;21:863–865. doi: 10.1038/nm.3891. [DOI] [PubMed] [Google Scholar]
- Holm C., Osterlund T. Hormone-sensitive lipase and neutral cholesteryl ester lipase. Methods Mol. Biol. 1999;109:109–121. doi: 10.1385/1-59259-581-2:109. [DOI] [PubMed] [Google Scholar]
- Jansky L., Hart J.S. Cardiac output and organ blood flow in warm- and cold-acclimated rats exposed to cold. Can. J. Physiol. Pharmacol. 1968;46:653–659. doi: 10.1139/y68-096. [DOI] [PubMed] [Google Scholar]
- Kienesberger P.C., Pulinilkunnil T., Nagendran J., Young M.E., Bogner-Strauss J.G., Hackl H., Khadour R., Heydari E., Haemmerle G., Zechner R. Early structural and metabolic cardiac remodelling in response to inducible adipose triglyceride lipase ablation. Cardiovasc. Res. 2013;99:442–451. doi: 10.1093/cvr/cvt124. [DOI] [PMC free article] [PubMed] [Google Scholar]
- Li Y., Fromme T., Schweizer S., Schöttl T., Klingenspor M. Taking control over intracellular fatty acid levels is essential for the analysis of thermogenic function in cultured primary brown and brite/beige adipocytes. EMBO Rep. 2014;15:1069–1076. doi: 10.15252/embr.201438775. [DOI] [PMC free article] [PubMed] [Google Scholar]
- Livak K.J., Schmittgen T.D. Analysis of relative gene expression data using real-time quantitative PCR and the 2(-Delta Delta C(T)) Method. Methods. 2001;25:402–408. doi: 10.1006/meth.2001.1262. [DOI] [PubMed] [Google Scholar]
- Mancuso D.J., Sims H.F., Han X., Jenkins C.M., Guan S.P., Yang K., Moon S.H., Pietka T., Abumrad N.A., Schlesinger P.H., Gross R.W. Genetic ablation of calcium-independent phospholipase A2gamma leads to alterations in mitochondrial lipid metabolism and function resulting in a deficient mitochondrial bioenergetic phenotype. J. Biol. Chem. 2007;282:34611–34622. doi: 10.1074/jbc.M707795200. [DOI] [PMC free article] [PubMed] [Google Scholar]
- Martinez-Lopez N., Garcia-Macia M., Sahu S., Athonvarangkul D., Liebling E., Merlo P., Cecconi F., Schwartz G.J., Singh R. Autophagy in the CNS and periphery coordinate lipophagy and lipolysis in the brown adipose tissue and liver. Cell Metab. 2016;23:113–127. doi: 10.1016/j.cmet.2015.10.008. [DOI] [PMC free article] [PubMed] [Google Scholar]
- Mayer N., Schweiger M., Romauch M., Grabner G.F., Eichmann T.O., Fuchs E., Ivkovic J., Heier C., Mrak I., Lass A. Development of small-molecule inhibitors targeting adipose triglyceride lipase. Nat. Chem. Biol. 2013;9:785–787. doi: 10.1038/nchembio.1359. [DOI] [PMC free article] [PubMed] [Google Scholar]
- Mottillo E.P., Bloch A.E., Leff T., Granneman J.G. Lipolytic products activate peroxisome proliferator-activated receptor (PPAR) α and δ in brown adipocytes to match fatty acid oxidation with supply. J. Biol. Chem. 2012;287:25038–25048. doi: 10.1074/jbc.M112.374041. [DOI] [PMC free article] [PubMed] [Google Scholar]
- Nedergaard J., Bengtsson T., Cannon B. Unexpected evidence for active brown adipose tissue in adult humans. Am. J. Physiol. Endocrinol. Metab. 2007;293:E444–E452. doi: 10.1152/ajpendo.00691.2006. [DOI] [PubMed] [Google Scholar]
- Osuga J., Ishibashi S., Oka T., Yagyu H., Tozawa R., Fujimoto A., Shionoiri F., Yahagi N., Kraemer F.B., Tsutsumi O., Yamada N. Targeted disruption of hormone-sensitive lipase results in male sterility and adipocyte hypertrophy, but not in obesity. Proc. Natl. Acad. Sci. USA. 2000;97:787–792. doi: 10.1073/pnas.97.2.787. [DOI] [PMC free article] [PubMed] [Google Scholar]
- Prusiner S.B., Cannon B., Lindberg O. Oxidative metabolism in cells isolated from brown adipose tissue. 1. Catecholamine and fatty acid stimulation of respiration. Eur. J. Biochem. 1968;6:15–22. doi: 10.1111/j.1432-1033.1968.tb00413.x. [DOI] [PubMed] [Google Scholar]
- Puigserver P., Wu Z., Park C.W., Graves R., Wright M., Spiegelman B.M. A cold-inducible coactivator of nuclear receptors linked to adaptive thermogenesis. Cell. 1998;92:829–839. doi: 10.1016/s0092-8674(00)81410-5. [DOI] [PubMed] [Google Scholar]
- Rosenwald M., Perdikari A., Rülicke T., Wolfrum C. Bi-directional interconversion of brite and white adipocytes. Nat. Cell Biol. 2013;15:659–667. doi: 10.1038/ncb2740. [DOI] [PubMed] [Google Scholar]
- Schlager S., Goeritzer M., Jandl K., Frei R., Vujic N., Kolb D., Strohmaier H., Dorow J., Eichmann T.O., Rosenberger A. Adipose triglyceride lipase acts on neutrophil lipid droplets to regulate substrate availability for lipid mediator synthesis. J. Leukoc. Biol. 2015;98:837–850. doi: 10.1189/jlb.3A0515-206R. [DOI] [PMC free article] [PubMed] [Google Scholar]
- Schoiswohl G., Stefanovic-Racic M., Menke M.N., Wills R.C., Surlow B.A., Basantani M.K., Sitnick M.T., Cai L., Yazbeck C.F., Stolz D.B. Impact of reduced ATGL-mediated adipocyte lipolysis on obesity-associated insulin resistance and inflammation in male mice. Endocrinology. 2015;156:3610–3624. doi: 10.1210/en.2015-1322. [DOI] [PMC free article] [PubMed] [Google Scholar]
- Schrammel A., Mussbacher M., Wölkart G., Stessel H., Pail K., Winkler S., Schweiger M., Haemmerle G., Al Zoughbi W., Höfler G. Endothelial dysfunction in adipose triglyceride lipase deficiency. Biochim. Biophys. Acta. 2014;1841:906–917. doi: 10.1016/j.bbalip.2014.03.005. [DOI] [PMC free article] [PubMed] [Google Scholar]
- Schrauwen P., van Marken Lichtenbelt W.D. Combatting type 2 diabetes by turning up the heat. Diabetologia. 2016;59:2269–2279. doi: 10.1007/s00125-016-4068-3. [DOI] [PMC free article] [PubMed] [Google Scholar]
- Schreiber R., Hofer P., Taschler U., Voshol P.J., Rechberger G.N., Kotzbeck P., Jaeger D., Preiss-Landl K., Lord C.C., Brown J.M. Hypophagia and metabolic adaptations in mice with defective ATGL-mediated lipolysis cause resistance to HFD-induced obesity. Proc. Natl. Acad. Sci. USA. 2015;112:13850–13855. doi: 10.1073/pnas.1516004112. [DOI] [PMC free article] [PubMed] [Google Scholar]
- Schweiger M., Schreiber R., Haemmerle G., Lass A., Fledelius C., Jacobsen P., Tornqvist H., Zechner R., Zimmermann R. Adipose triglyceride lipase and hormone-sensitive lipase are the major enzymes in adipose tissue triacylglycerol catabolism. J. Biol. Chem. 2006;281:40236–40241. doi: 10.1074/jbc.M608048200. [DOI] [PubMed] [Google Scholar]
- Schweiger M., Eichmann T.O., Taschler U., Zimmermann R., Zechner R., Lass A. Measurement of lipolysis. Methods Enzymol. 2014;538:171–193. doi: 10.1016/B978-0-12-800280-3.00010-4. [DOI] [PMC free article] [PubMed] [Google Scholar]
- Shabalina I.G., Ost M., Petrovic N., Vrbacky M., Nedergaard J., Cannon B. Uncoupling protein-1 is not leaky. Biochim. Biophys. Acta. 2010;1797:773–784. doi: 10.1016/j.bbabio.2010.04.007. [DOI] [PubMed] [Google Scholar]
- Sitnick M.T.T., Basantani M.K.K., Cai L., Schoiswohl G., Yazbeck C.F.F., Distefano G., Ritov V., DeLany J.P.P., Schreiber R., Stolz D.B.B. Skeletal muscle triacylglycerol hydrolysis does not influence metabolic complications of obesity. Diabetes. 2013;62:3350–3361. doi: 10.2337/db13-0500. [DOI] [PMC free article] [PubMed] [Google Scholar]
- Stanford K.I., Middelbeek R.J., Townsend K.L., An D., Nygaard E.B., Hitchcox K.M., Markan K.R., Nakano K., Hirshman M.F., Tseng Y.H., Goodyear L.J. Brown adipose tissue regulates glucose homeostasis and insulin sensitivity. J. Clin. Invest. 2013;123:215–223. doi: 10.1172/JCI62308. [DOI] [PMC free article] [PubMed] [Google Scholar]
- Tang T., Abbott M.J., Ahmadian M., Lopes A.B., Wang Y., Sul H.S. Desnutrin/ATGL activates PPARδ to promote mitochondrial function for insulin secretion in islet β cells. Cell Metab. 2013;18:883–895. doi: 10.1016/j.cmet.2013.10.012. [DOI] [PMC free article] [PubMed] [Google Scholar]
- Thireau J., Zhang B.L., Poisson D., Babuty D. Heart rate variability in mice: a theoretical and practical guide. Exp. Physiol. 2008;93:83–94. doi: 10.1113/expphysiol.2007.040733. [DOI] [PubMed] [Google Scholar]
- Tschöp M.H., Speakman J.R., Arch J.R.S., Auwerx J., Brüning J.C., Chan L., Eckel R.H., Jr., Farese R.V., Jr., Galgani J.E., Hambly C. A guide to analysis of mouse energy metabolism. Nat. Methods. 2011;9:57–63. doi: 10.1038/nmeth.1806. [DOI] [PMC free article] [PubMed] [Google Scholar]
- van Marken Lichtenbelt W.D., Vanhommerig J.W., Smulders N.M., Drossaerts J.M., Kemerink G.J., Bouvy N.D., Schrauwen P., Teule G.J. Cold-activated brown adipose tissue in healthy men. N. Engl. J. Med. 2009;360:1500–1508. doi: 10.1056/NEJMoa0808718. [DOI] [PubMed] [Google Scholar]
- Virtanen K.A., Lidell M.E., Orava J., Heglind M., Westergren R., Niemi T., Taittonen M., Laine J., Savisto N.J., Enerbäck S., Nuutila P. Functional brown adipose tissue in healthy adults. N. Engl. J. Med. 2009;360:1518–1525. doi: 10.1056/NEJMoa0808949. [DOI] [PubMed] [Google Scholar]
- Virtue S., Vidal-Puig A. Assessment of brown adipose tissue function. Front. Physiol. 2013;4:128. doi: 10.3389/fphys.2013.00128. [DOI] [PMC free article] [PubMed] [Google Scholar]
- Wang S.P., Laurin N., Himms-Hagen J., Rudnicki M.A., Levy E., Robert M.F., Pan L., Oligny L., Mitchell G.A. The adipose tissue phenotype of hormone-sensitive lipase deficiency in mice. Obes. Res. 2001;9:119–128. doi: 10.1038/oby.2001.15. [DOI] [PubMed] [Google Scholar]
- Xiong D., He H., James J., Tokunaga C., Powers C., Huang Y., Osinska H., Towbin J.A., Purevjav E., Balschi J.A. Cardiac-specific VLCAD deficiency induces dilated cardiomyopathy and cold intolerance. Am. J. Physiol. Heart Circ. Physiol. 2014;306:H326–H338. doi: 10.1152/ajpheart.00931.2012. [DOI] [PMC free article] [PubMed] [Google Scholar]
- Young S.G., Zechner R. Biochemistry and pathophysiology of intravascular and intracellular lipolysis. Genes Dev. 2013;27:459–484. doi: 10.1101/gad.209296.112. [DOI] [PMC free article] [PubMed] [Google Scholar]
- Yushkevich P.A., Piven J., Hazlett H.C., Smith R.G., Ho S., Gee J.C., Gerig G. User-guided 3D active contour segmentation of anatomical structures: significantly improved efficiency and reliability. Neuroimage. 2006;31:1116–1128. doi: 10.1016/j.neuroimage.2006.01.015. [DOI] [PubMed] [Google Scholar]
- Zechner R., Zimmermann R., Eichmann T.O., Kohlwein S.D., Haemmerle G., Lass A., Madeo F. FAT SIGNALS—lipases and lipolysis in lipid metabolism and signaling. Cell Metab. 2012;15:279–291. doi: 10.1016/j.cmet.2011.12.018. [DOI] [PMC free article] [PubMed] [Google Scholar]
Associated Data
This section collects any data citations, data availability statements, or supplementary materials included in this article.