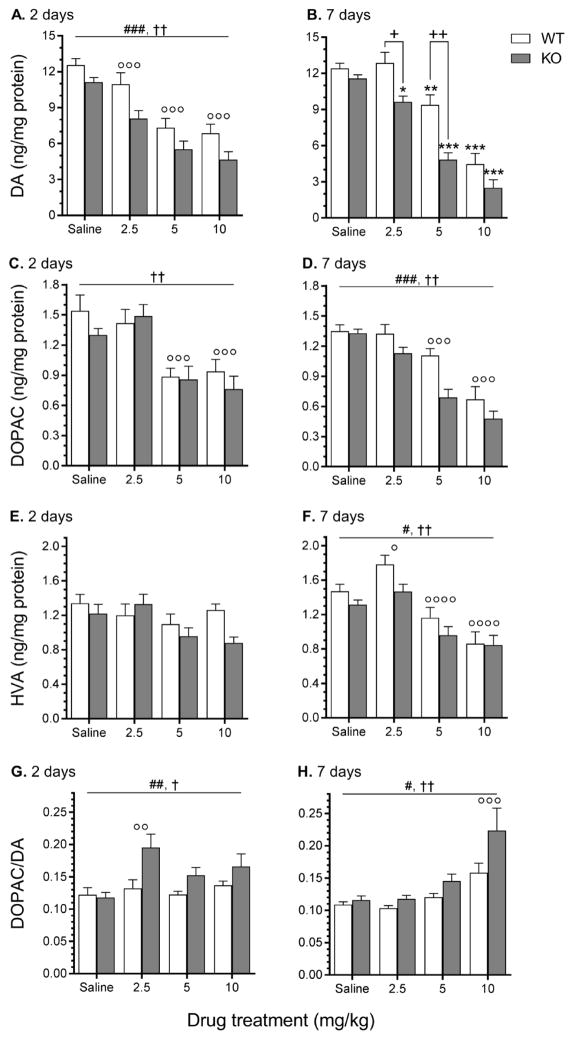
Figure 2.
Striatal levels of DA, DOPAC, HVA and DA turnover measured 2 and 7 days following saline or MA treatment. Taar1-WT and -KO mice received 4 i.p. injections of saline or MA (2.5, 5, or 10 mg/kg), spaced 2 hr apart and were euthanized either 2 or 7 days following the final injection for striatal tissue collection. Values were normalized to the amount of protein in each tissue sample. Data represent means ± SEM of 7–11 mice per group. *: p < 0.05, **: p < 0.01, ***: p < 0.001 compared to saline-treated controls; +: p < 0.001, ++: p < 0.0001 between genotypes; #: p < 0.05, ##: p < 0.01, ###: p < 0.001 for main effect of genotype; †: p < 0.01, ††: p < 0.0001 for main effect of dose; ∘: p < 0.05, ∘∘: p < 0.01, ∘∘∘: p < 0.001, ∘∘∘∘: p < 0.0001 compared to saline-treated controls, regardless of genotype.

