Abstract
Objectives: Although pulmonary hypertension (PH) caused by left heart disease (PH-LHD) is more common in PH, little is known about its properties of pulmonary artery (PA) in PH-LHD. The purpose of this study was to measure pulmonary regional pulse wave velocity (PWV) and to quantify the magnitude of reflected waves in patients with PH-LHD by the analysis of the pressure–velocity loops (PU-loop).
Methods: High-fidelity PA pressure (Pm) and PA velocity (Vm) were measured in 11 subjects with PH-LHD (mean Pm>25 mmHg), 1 subject with atrial septal defect (ASD) without PH and 12 control subjects, using multisensor catheters. PWV was calculated as the slope of the initial part of the PU-loop in early systole. The similarity in the shapes of the pressure and flow velocity waveforms over one PU-loop was quantified as the magnitude of reflected wave by calculating the standard error of the estimate (Sy/x) from linear regression analysis between Pm and corresponding Vm. PWV and Sy/x during a Valsalva maneuver (VM) were also assessed in nine control subjects.
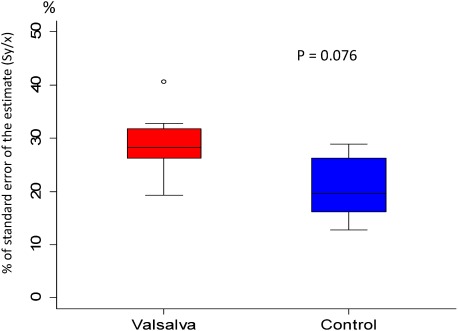
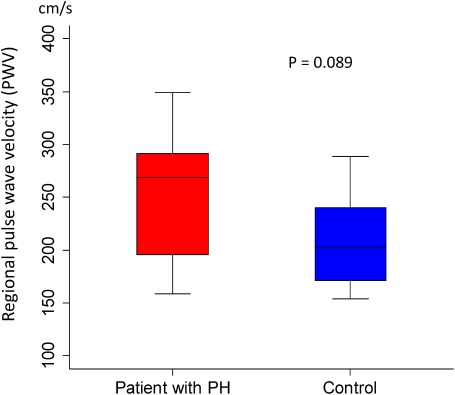
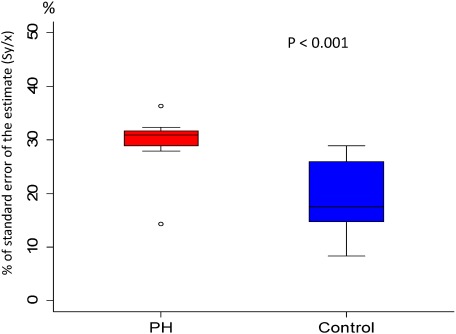
Results: The contour of PU-loop was so characteristic between control and PH-LHD. Max. PWV (349 cm/s) was recorded in PH-LHD and min. PWV (111 cm/s) was recorded in ASD. VM increased Pm (12 [7–15] mmHg vs. 50 [18–110] mmHg; p=0.009) and PWV (200 [148–238] cm/s vs. 260 [192–306] cm/s; p=0.009) significantly without significant increase of Sy/x (19.6 [12.7–28.9]% vs. 28.2 [19.3–40.7]%; p=0.079). Although Sy/x was significantly higher in PH-LHD than in control and ASD (31.0 [14.3–36.3]% vs. 17.5 [8.4–28.9]%; p=0.009, ASD: 18.2%) , no significant difference was found in PWV between PH-LHD and control (269 [159–349] cm/s vs. 203 [154–289] cm/s; p=0.089).
Conclusions: 1) The magnitude of wave reflection was elevated in PH-LHD significantly as compared with control and ASD. 2) Despite the significant increase in PA-PWV caused by abrupt elevation in Pm during VM in control, chronic elevation in Pm did not increase PA-PWV in PH-LHD significantly. It was hypothesized that the PA constituted a self-regulating system for maintaining the arterial stiffness stable against the chronic elevation in Pm in PH-LHD by a remodeling of increasing proximal pulmonary arterial crosssectional area gradually, which was compatible with the Moens–Korteweg equation. The PU-loop could provide a new simple and conventional method for assessing the pulmonary arterial properties, clinically. (This is a translation of J Jpn Coll Angiol 2016; 56: 45–53.)
Keywords: regional pulse wave velocity, multisensor catheter, Valsalva maneuver, wave reflection, Moens–Korteweg equation
Introduction
As the population ages, pulmonary hypertension caused by left heart disease (PH-LHD) has increased with the increase in patients with heart failure. Currently, PH-LHD is the most common form of PH.1) The structure of the right ventricle (RV) is not adequate for coping with an increase in pulmonary arterial pressure. Accordingly, persistent elevation of pulmonary arterial pressure leads to RV failure with high mortality. To maintain right ventricular function and prevent right heart failure, the capacitance properties of the pulmonary artery (PA) must be maintained.
However, few studies have analyzed PA properties in patients with PH-LHD because of limited measurement techniques.
In this study, we measured the regional pulse wave velocity (PWV) as a marker of PA stiffness and quantitatively evaluated the influence of wave reflection on the main PA in patients with PH-LHD by analyzing the pressure–blood flow velocity waveform similarity utilizing the pressure–velocity loop (PU-loop).
Subjects and Methods
Subjects
The subjects were 11 patients with PH-LHD related to mitral or aortic valve diseases (mean pulmonary arterial pressure: ≥25 mmHg, mean PA wedge pressure: >15 mmHg) who had a left ventricular ejection fraction (LVEF) of ≥55%, without a history of heart failure. In addition, 12 controls with normal cardiopulmonary function, for whom right heart catheterization was performed, and 1 patient with high-shunt atrial septal defect (ASD) (pulmonary to systemic flow ratio: 2.3) and marked PA dilation in the absence of PH were investigated (Table 1).
Table 1 Patients characteristics.
| Control | Patients with PH-LHD | ASD | |
|---|---|---|---|
| Patient (n) | 12 | 11 | 1 |
| Age (years) | 59±18 | 62±14 | 57 |
| Male/female | 9/3 | 2/9 | 0/1 |
| Pulmonary arterial pressure (mmHg) | |||
| ★Maximum | 20±4 | 51±30 | 22 |
| ★Minimum | 6±3 | 21±9 | 6 |
| ★Mean | 12±2 | 33±15 | 13 |
| Mean Pulmonary artery wedge pressure (mmHg) | 7±4 | 23±9 | — |
| Diagnosis | |||
| Arrhythmia | 3 | 0 | — |
| Chest pain syndrome | 9 | 0 | — |
| Mitral valve diseases | 0 | 8 | — |
| Aortic valve diseases | 0 | 3 | — |
PH-LHD: pulmonary hypertension owing to left heart disease; ASD: atrial septal defect
Prior to the study, informed consent was obtained from all patients. The protocol was approved by the Ethics Review Board of the medical institution.
Methods
Measurement rationale for regional PWV based on PU-loop.2–4)
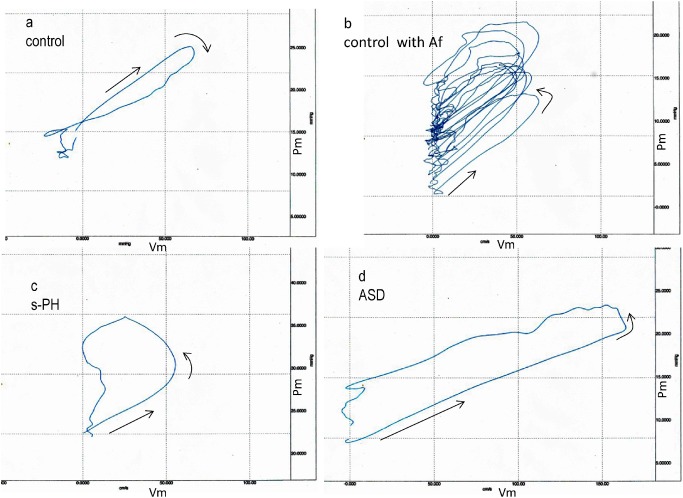
A loop (PU-loop) was obtained by plotting the PA pressure (P) against flow velocity (U) measured at the same site. A typical PU-loop obtained in the main PA of a control is shown in Fig. 1a. The initial slope of the PU-loop was linear (→), and the loop rotated in a clockwise direction after the Pm reached a peak, forming a flat loop. The good P-U linearity indicates that there is no influence of wave reflection in early systole. So, the following water-hammer formula (1) is completed5):
 |
(1) |
where, Pm is the measured pulmonary arterial pressure (dyne/cm2), ρ is the density of blood (assumed to be 1.05 g/cm3), and Vm is the measured pulmonary blood flow velocity (cm/s).
Fig. 1 a: Pulmonary artery pressure and velocity loop during a cardiac cycle in a control subject. b: 10 consecutive pulmonary artery PU-loops in another control patient with atrial fibrillation (Af). c: Pulmonary artery PU-loop during a cardiac cycle in a patient with PH-LHD. d: Pulmonary artery PU-loop during a cardiac cycle in a patient with atrial septal defect (ASD) without pulmonary hypertension.
Therefore, the PWV is calculated using formula (2) from the initial slope of the PU-loop corresponding to early systole.
 |
(2) |
The water-hammer formula (1) indicates that there is a linear relationship between the change in pressure and the change in velocity during the periods when there is no influence of reflected waves.6) In normal PA, the influence of wave reflection is sufficiently limited such that the similarity of pressure and flow velocity waveforms is expected to be highly maintained.7) If there is similarity between the change in Pm and Vm over a cardiac cycle, then the PU-loop should become linear. Accordingly, the standard error (Sy/x) of an estimated linear value obtained on the linear regression analysis of Pm to Vm per PU-loop, as shown below, indicates the degree of deviation from linearity:
 |
where n is the number of data, (bo+b1Vm) is the regression equation and SSres is the residual sum of squares.
As induced by the water-hammer formula (1), if only forward waves are present, the Sy/x value should reach zero and vice versa. Therefore, it is possible to quantitatively evaluate the similarity of pressure and flow velocity waveforms, that is, the intensity of wave reflection based on the Sy/x value.
First, a high-fidelity custom-designed multisensor catheter (Millar Inc., VPC-series)8) was inserted into the pulmonary trunk on right heart catheterization, and the Pm and Vm at the same site were measured simultaneously under stable condition in 24 patients. In addition, the Pm and Vm were also recorded during the four phases of the Valsalva maneuver in 9 controls.
Data sampling of pressure and velocity was performed every 2 msec. PWV was calculated from the linear regression equation for the initial slope of the PU-loop. The arithmetic mean of the values obtained for 5 consecutive heart beats in patients with sinus rhythm or for 10 consecutive heart beats in those with atrial fibrillation was regarded as the final definitive value of PWV. The Sy/x was calculated using the Pm and Vm values obtained from sampling every 20 msec.
A Narcomatic-RT500 blood flow meter was used. Data analysis/processing were conducted using BIOPAC Systems MP-series.
Statistical analysis
All data are expressed as the median (minimum–maximum). The PWV and Sy/x were compared between the PH and control groups using Wilcoxon’s rank sum test. The Pm and PWV on Valsalva loading were compared to the Sy/x using Wilcoxon’s signed-rank test. A p-value of <0.05 was regarded as significant. The above analyses were conducted using R version 3.0.2 software.
Results
Typical examples of the PU-loops of the main PA in the controls, patients with PH-LHD, and one patient with ASD are shown in Figs. 1a–1d. Each loop is plotted in the same scale to ease comparison.
The clockwise rotation of the PU-loop shown in Fig. 1a (a control) indicates that the Vm was still increasing after a reflection-induced reduction in the pressure (Pm). A wave reflection is usually considered to act only on an increase in the Pm as a backward compression wave, but “backward expansion waves,” which act on a decrease in the Pm and increase in the Vm, are confirmed to be present in normal PA.9) The Sy/x in this patient was 13.5%.
Figure 1b shows 10 consecutive PU-loops obtained in another control with nonvalvular atrial fibrillation. All loops rotated counterclockwise, reflecting the development of backward compression waves and formed thicker loops differing from the PU-loop in the control (Fig. 1a). All loops were nearly linear in early systole, and the slopes of the linear segment were almost constant. The Sy/x in this patient was calculated as 26.2%, higher than in the control shown in Fig. 1a.
A typical PU-loop in the patient with PH-LHD is shown in Fig. 1c. In early systole, the Pm–Vm linearity was well maintained (→). After the Vm and Pm reached close to its peak, the linear portion markedly rotated counterclockwise, depicting a large trapezoid-shaped loop. This reflects the arrival of the backward compression wave acting on increase in the Pm and decrease in the Vm. The contour of PU-loop is quite different from those of controls. The Sy/x in this patient was 32.0%, higher than in former controls.
Figure 1d shows the PU-loop of the pulmonary trunk in the patient with ASD. In early systole, the Pm–Vm linearity was well maintained, and its slope was less steep than those of control and PH. After the Vm reached a peak, the loop rotated counterclockwise from the linear portion with a slight increase in the Pm and slight decrease in Vm, forming a rectangular-shaped loop, which was thicker than those of the controls. The Sy/x in this patient was 18.2%, which was close to the control value.
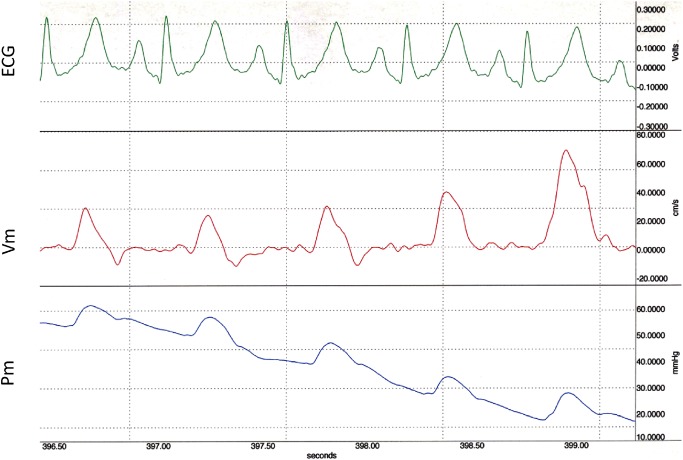
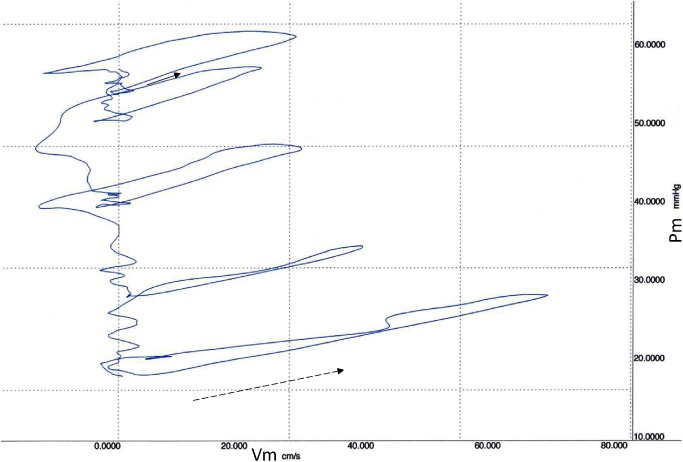
Pm and Vm waveforms for 5 consecutive heart beats recorded during Valsalva maneuver (phase-3) in the control are displayed in Fig. 1a and its PU-loops are shown in Figs. 2 and 3, respectively. The linearity of the initial part of the loops in early systole was maintained irrespective of the change in pressure. The initial slope became less steep, and the loop gradually became thinner with a reduction in pressure. The Sy/x at the first beat was 26.2%, which was higher than at steady state.
Fig. 2 Simultaneous 5 consecutive flow velocity (Vm) and pressure (Pm) tracings from main pulmonary artery during release of Valsalva maneuver in the same control subject as in Fig. 1a.
Fig. 3 Main pulmonary arterial pressure (Pm) and velocity (Vm) loops (PU-loops) during the release of Valsalva maneuver from the waveform shown in Fig. 2. The initial part of the first loop, indicating a wave speed of 283 cm/s (solid arrow), became more gentle in accordance with the decrease in diastolic pressure, resulting in a wave speeds of 212 cm/s (dotted arrow) at the last PU-loop.
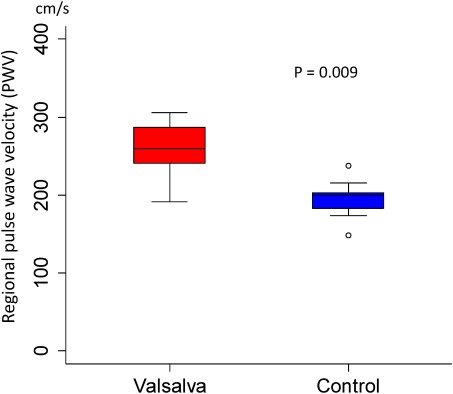
The Pm and PWV (median [minimum–maximum]) measured during steady state and during Valsalva maneuver in 9 controls were 12 [7–15] vs. 50 [18–110] mmHg (p=0.009) and 200 [148–238] vs. 260 [192–306] cm/s (p=0.009), respectively; Valsalva loading significantly increased the PWV as shown in Fig. 4. The Sy/x during steady state and on Valsalva loading is expressed as a box pot in Fig. 5. The values were 19.6 [12.7–28.9] and 28.2 [19.3–40.7]% (p=0.079), respectively; there was no significant increase in Sy/x despite an increase in Pm.
Fig. 4 Change of regional pulse wave velocity at pulmonary trunk before and during Valsalva maneuver in 9 control subjects. Data are presented as a box and whisker plot with median and 25–75th percentiles.
Fig. 5 Change of Sy/x at pulmonary trunk before and during Valsalva maneuver in 9 control subjects. Data are presented as a box and whisker plot with median and 25–75th percentiles.
The PWV in the control and PH groups was 203 [154–289] and 269 [159–349] cm/s (p=0.089), respectively; the median, minimum, and maximum in the PH group were all higher than those in the control group, but there were no significant differences (Fig. 6). Conversely, the Sy/x values in the control and PH-LHD groups were 17.5 [8.4–28.9] and 31.0 [14.3–36.3]%, respectively (p<0.001), showing a significant difference (Fig. 7).
Fig. 6 Comparison of regional pulse wave velocity (PWV) at pulmonary trunk in patients with PH-LHD and in control subjects. Data are presented as a box and whisker plot with median and 25–75th percentiles.
Fig. 7 Comparison of Sy/x at pulmonary trunk in patients with PH-LHD and in control subjects. Data are presented as a box and whisker plot with median and 25–75th percentiles.
Discussion
With a rapidly aging population, the incidence of heart failure has exceeded that of ischemic heart disease, and heart failure is a major aging-associated disease.10) Due to this, the number of patients with PH-LHD has been increasing. Because the dominant movement of the RV is pressing the RV-free wall against the septum to create a bellow effect that empties into the pulmonary circulation with very low driving pressure, the RV does not tolerate high pressure. This is supported by the fact that right heart failure is observed in approximately 30% of patients treated with a left ventricular assist device (LVAD).11) Therefore, as the population ages, the number of patients with right heart failure should increase. Importantly, PH-LHD accounts for the highest percentage of PH.
To keep a right ventricular pressure low, the distensibility of the PA, as a capacitance vessel, is essential. Rigid blood vessels lose this property. The stiffness of arteries increases with an increase in the intra-arterial pressure.12) Such an increase in stiffness increases PWV.13) An increase in PWV may lead to right heart failure through an increase in right ventricular afterload by early superimposition of reflected pressure waves.14) Indeed, increase in Pm resulted in increase in PWV during Valsalva maneuver without exception. Therefore, it is speculated that PWV also increases in PH patients, but few studies have reported the relationship between PH and PWV due to methodological restrictions.
The studies dealing with this so far are summarized in Table 2.15–17) PWV values in the PH patients from those studies are markedly higher than in the PH-LHD patients in our study. This may be related to differences in the measurement method, grade of PH, and pathogenesis between secondary and primary PH. However, all pressure measurements in Table 2 were performed using a fluid-filled catheter (intraoperative puncture of the PA in some cases). For accurate PWV measurement, it is essential to use an accurate pressure/velocity-measuring system. Specifically, one study determined PWV measurements for patients with idiopathic pulmonary arterial hypertension (PAH) using the foot-to-foot method by withdrawal via a 6F Judkins catheter.17) Accordingly, the mean PWV (3.5 m/s) in the control group was markedly higher than in our study (2 m/s). On magnetic resonance imaging (MRI), PWV of the normal main PA was approximately 2 m/s, which was very close to our results; the PWV values described in Table 2 do not seem to be reliable. As reference for a normal PWV of the main PA and differences in PWV between the water-hammer and two-point measurement methods, see the previous article.4)
Table 2 Comparison of reported pulmonary artery pulse wave velocity in patients with PH.
| Vessel (Sites of pressure measurement) | PWV (cm/s) | Patient (n), (M/F, Age) | Method | Reference | Pm (mmHg) |
|---|---|---|---|---|---|
| MPA to d-MPA or r-PA to r-PA | 182 | Normal: 4, (4/1, 53–69) | f-f | Caro et al. (1962) | 10.1 (7.0–17.0) |
| MPA to d-MPA or r-PA to r-PA | 406 | PH-LHD: 7, (6/1, 27–72) | f-f | 30.8 (24.3–51.8) | |
| MPA | 168 | Normal: 3, (1/2, 21–53) | mv | Milnor et al. (1969) | 13.9 (12.1–14.8) |
| MPA | 477 | s-PH: 7, (0/7, 35–58) | mv | 40.1 (15.4–59.0) | |
| MPA to l-PA | 350 | Normal: 10, (4/6, 44–58) | f-f | Kopec et al. (2013) | 13.0 (12.0–15.0) |
| MPA to l-PA | 1000 | IPAH: 26, (10/16, 45–66) | f-f | 50.0 (44.0–63.0) |
PMV: pulse wave velocity; f-f: measured as foot-to-foot velocity; PH-LHD: pulmonary hypertension due to left ventricular disease; IPAH: idiopathic pulmonary hypertension; mv: mean value from frequency spectrum of phase velocity; Pm: mean pulmonary arterial pressure; S-PH: secondary pulmonary hypertension
In this study, there was no significant difference in PWV between the PH-LHD and control groups, contrary to our expectations. Although the PWV is a commonly-used index of arterial stiffness, “stiffness” is a generic conceptual term that indicates rigidity; therefore, we explain the reason for the above finding by considering the relation between Young’s modulus (E), as a physical index of arterial stiffness, and PWV.
Elasticity refers to a property by which a deformity returns to an original shape. A high elasticity rate (E) indicates that the deformity readily returns to its original shape, that is, rigidity without deformity. Therefore, E and stiffness may be regarded as synonyms. However, when E is extremely low (such as arteries), the PWV is expressed as the following Moens–Korteweg (M–K) formula.18)
 |
In this formula, “E” indicates Young’s modulus, “h” indicates vascular wall thickness, “D” indicates the inner vascular diameter, and “ρ” indicates the blood density. Young’s modulus (E) is calculated using the formula E=Σ/ε, regarding a strain on pulling a sample with stress Σ as ε. In industrial materials, such as metals, the Σ–ε relationship is linear, and E is constant; therefore, the stiffness can be evaluated based on E. However, in the vascular wall, the Σ–ε relationship is not linear, and the slope (E) increases with an increase in Σ. Briefly, blood vessels become rigid with an increase in blood pressure, making dilation difficult. Therefore, it is impossible to evaluate arterial stiffness using E in the presence of blood pressure changes. In the above Moens–Korteweg formula, ρ is constant, and PWV depends on E and h/D.
In patients with passive PH-LHD related to an increase in the left atrial pressure, the PA tends to dilate, increasing D. According to a recent study of PH,19) computed tomography (CT) confirmed a significant correlation between pulmonary arterial pressure and D. As the main pathological lesion in PH-LHD occurs at the peripheral vessels below 500 µm in diameter distal to muscular arteries, few studies have examined the wall thickness (h) of the elastic proximal PA in PH-LHD.20) However, in the aforementioned study, the inner diameter (D) and wall thickness (h) of the main PA were compared between patients with PAH and controls using intravascular ultrasound (IVUS), indicating that the rate of increase in D (1.33-fold) was greater than that in h (1.22-fold)17) for patients with PAH. This suggests that even in patients with PAH characterized by thickening of the PA as a main lesion the h/D of the proximal PA is slightly lower than in controls. In PH-LHD patients with passive dilation of the PA, it seems probable that the h/D is further reduced and this neutralizes the increase in PWV associated with the increase in E caused by PH. This is supported by the fact that the lowest PWV was noted in the ASD patient with marked dilation of the proximal PA. However, time is essential for a reduction in h/D; therefore, when there was a transient and rapid increase in Pm during Valsalva maneuver, the above compensatory mechanism may not have functioned, leading to a significant increase in PWV.
The PA maintains its capacitance through the following properties: (1) distensibility, (2) thinning of the wall, and (3) recanalization of the vascular bed. Even in a state with a physiological increase in pulmonary blood flow, such as exercise, a low pressure is maintained. The above factors, (1) and (3) contribute to an increase in D, and factor (2) contributes to a decrease in h. Therefore, a reduction in h/D related to the 3 factors may have neutralized an increase in E related to an increase in the pulmonary arterial pressure even in the presence of LHD. Simply, the results of this study suggest that the properties of the PA function as a self-protection mechanism against an increase in pulmonary arterial pressure.
The PWV is widely used as a simple and conventional surrogate of vascular stiffness. However, the intensity, presence, and type of reflected waves cannot be estimated with this index. If the PU-loop is utilized, PWV can be readily determined from its slope, and the intensity, direction, type, and timing of reflected waves are easily determined from its shape. In addition, quantitative assessment is possible using the Sy/x. A large, trapezoid-shaped counterclockwise PU-loop reflects the presence of backward compression waves characteristic of PH, and a linear or flat PU-loop reflects highly compliant PA. Among linear or flat PU-loops, a clockwise loop means the presence of an open-end wave reflection (expansion waves) as the ultimate reflection mode of capacitance vessels.21,22)
Early diagnosis and treatment of PH-LHD are essential to minimize morbidity and mortality before the development of right ventricular failure. Routine PU-loop follow-up could facilitate early diagnosis of PH before a pressure rise is manifest. If the PU-loop can be readily obtained noninvasively, this method may be appropriate for the bedside assessment of PH. Noninvasive visualization of a PU-loop of the carotid artery using Doppler ultrasonography and echo-tracking method has been developed.23) Because PU-loop requires only simultaneous measurements of pressure and flow velocity and because noninvasive high-fidelity measurements of both seem to be technically feasible, the early clinical application of PU-loop is expected to be forthcoming.
Study Limitations
This study was performed to estimate the feasibility of utilizing a PU-loop as a new surrogate marker of pulmonary wave reflection. Naturally, care must be taken in the interpretation of the results since the sample size was small and the study conditions were limited.
Conclusion
(1) A rapid increase in the pulmonary arterial pressure increased PA stiffness significantly, but there was no significant influence on wave reflection. (2) A chronic elevation in Pm did not increase PA stiffness significantly, but increased intensity of reflected waves significantly. (3) The PU-loop might serve as a useful clinical surrogate of PH status before a pressure rise is manifest.
Disclosure Statement
We assure that there is no conflict of interest regarding the contents described in this article.
This is a translation of J Jpn Coll Angiol 2016; 56: 45–53.
References
- 1).Enriquez-Sarano M, Rossi A, Seward JB, et al. Determinations of pulmonary hypertension in left ventricular dysfunction. J Am Coll Cardiol 1997; 29: 153-9. [DOI] [PubMed] [Google Scholar]
- 2).Dujardin JP, Stone DN. Characteristic impedance of the proximal aorta determined in the time and frequency domain: a comparison. Med Biol Eng Comput 1981; 19: 565-8. [DOI] [PubMed] [Google Scholar]
- 3).Khir AW, Parker KH. Measurements of wave speed and reflected waves in elastic tubes and bifurcations. J Biomech 2002; 35: 775-83. [DOI] [PubMed] [Google Scholar]
- 4).Hanya S, Kawai Y, Kondou Y. Validation of the water hammer formula for measuring the regional pulse wave velocity in the main pulmonary artery using a multisensor catheter. J Jpn Coll Angiol 2009; 49: 411-6. (in Japanese) [Google Scholar]
- 5).McDonald DA. Blood flow in arteries. London: Edward Arnold, 1974: 284.
- 6).Niki K, Sugawara M, Uchida K, et al. A noninvasive method of measuring wave intensity, a new hemodynamic index: application to the carotid artery in patients with mitral regurgitation before and after surgery. Heart Vessels 1999; 14: 263-71. [DOI] [PubMed] [Google Scholar]
- 7).van den Bos GC, Westerhof N, Randall OS. Pulse wave reflection: can it explain the differences between systemic and pulmonary pressure and flow waves? A study in dogs. Circ Res 1982; 51: 479-85. [DOI] [PubMed] [Google Scholar]
- 8).Hanya S. The multisensor catheter. The blood flow in the heart and large vessels. Tokyo: Springer-Verlag, 1989: 189-95.
- 9).Hanya S. Study of pulmonary backward expansion wave developed during Valsalva maneuver using wave-intensity analysis. J Clin Exp Med 2015; 252: 321-2. [Google Scholar]
- 10).Sakata Y, Shimokawa H. Epidemiology of heart failure in Asia. Circ J 2013; 77: 2209-17. [DOI] [PubMed] [Google Scholar]
- 11).Matthews JC, Koelling TM, Pagani FD, et al. The right ventricular failure risk score a pre-operative tool for assessing the risk of right ventricular failure in left ventricular assist device candidates. J Am Coll Cardiol 2008; 51: 2163-72. [DOI] [PMC free article] [PubMed] [Google Scholar]
- 12).Milnor WR, Conti CR, Lewis KB, et al. Pulmonary arterial pulse wave velocity and impedance in man. Circ Res 1969; 25: 637-49. [DOI] [PubMed] [Google Scholar]
- 13).Bramwell JC, Hill AV. The velocity of the pulse wave in man. Proc R Soc Lond, B 1922; 93: 298-306. [Google Scholar]
- 14).Elzinga G, Piene H, de Jong JP. Left and right ventricular pump function and consequences of having two pumps in one heart. A study on the isolated cat heart. Circ Res 1980; 46: 564-74. [DOI] [PubMed] [Google Scholar]
- 15).Caro CG, Harrison GK. Observations on pulse wave velocity and pulsatile blood pressure in the human pulmonary circulation. Clin Sci 1962; 23: 317-29. [PubMed] [Google Scholar]
- 16).Milnor WR, Conti CR, Lewis KB, et al. Pulmonary arterial pulse wave velocity and impedance in man. Circ Res 1969; 25: 637-49. [DOI] [PubMed] [Google Scholar]
- 17).Kopeć G, Moertl D, Jankowski P, et al. Pulmonary artery pulse wave velocity in idiopathic pulmonary arterial hypertension. Can J Cardiol 2013; 29: 683-90. [DOI] [PubMed] [Google Scholar]
- 18).Korteweg DJ. Über die Fortpflanzungsgeschwindigkeit des Schalles in Elastischen Röhren. Ann Phys 1878; 241: 525-42. (in German) [Google Scholar]
- 19).Corson N, Armato SG 3rd, Labby ZE, et al. CT-based pulmonary artery measurements for the assessment of pulmonary hypertension. Acad Radiol 2014; 21: 523-30. [DOI] [PMC free article] [PubMed] [Google Scholar]
- 20).Jordan SC, Hicken P, Watson DA, et al. Pathology of the lungs in mitral stenosis in relation to respiratory function and pulmonary haemodynamics. Br Heart J 1966; 28: 101-7. [DOI] [PMC free article] [PubMed] [Google Scholar]
- 21).Hollander EH, Wang JJ, Dobson GM, et al. Negative wave reflections in pulmonary arteries. Am J Physiol Heart Circ Physiol 2001; 281: H895-902. [DOI] [PubMed] [Google Scholar]
- 22).Smolich JJ, Mynard JP, Penny DJ. Simultaneous pulmonary trunk and pulmonary arterial wave intensity analysis in fetal lambs: evidence for cyclical, midsystolic pulmonary vasoconstriction. Am J Physiol Regul Integr Comp Physiol 2008; 294: R1554-62. [DOI] [PubMed] [Google Scholar]
- 23).Harada A, Okada T, Niki K, et al. On-line noninvasive one point measurements of pulse wave velocity. Heart Vessels 2002; 17: 61-8. [DOI] [PubMed] [Google Scholar]


