Abstract
Aim: We have recently established a novel swine model for studies of atherosclerosis using Microminipigs™ (µMPs) fed a high-fat/high-cholesterol diet (HcD). Using this swine model, we re-evaluated the effects of dietary cholic acid (CA) on serum lipid profile, atherosclerosis and hepatic injuries.
Methods: The µMPs were fed HcD supplemented with 0.7% CA (HcD+CA) for eight weeks, and the effect of CA on serum lipoprotein levels, expression of oxidative stress markers, adiposity and lesion formation in the aorta, liver, and other organs was investigated.
Results: The HcD+CA-fed group exhibited more visceral adiposity, progression of atherosclerosis and higher serum levels of oxidative stress markers than the HcD-fed group, even though they showed similar serum lipid levels. The liver demonstrated increased lipid accumulation, higher expression of oxidative stress markers, accelerated activation of foamy Kupffer cells and stellate cells, and increased hepatocyte apoptosis, indicating non-alcoholic fatty liver disease (NAFLD). Intriguingly, foamy macrophage mobilization was observed in various organs, including the reticuloendothelial system, pulmonary capillary vessels and skin very often in HcD+CA-fed µMPs.
Conclusion: To our knowledge, this is the first large animal model, in which visceral obesity, NAFLD and atherosclerosis are concomitantly induced by dietary manipulation. These data suggest the detrimental effects of CA, potentially through local and systemic activation of oxidative stress-induced signaling to macrophage mobilization, on the acceleration of visceral adiposity, atherosclerosis and NAFLD.
Keywords: Cholic acid, Microminipig, Nonalcoholic fatty liver disease, Oxidative stress, Metabolic syndrome
Introduction
A growing body of evidence shows that lipid metabolism in the liver plays a crucial role in the pathogenesis of metabolic syndrome, which is associated with manifestation of obesity, dyslipidemia, type 2 diabetes mellitus, atherosclerosis, and non-alcoholic fatty liver disease (NAFLD)1–3). To study the pathogenesis of metabolic syndrome, many diet-induced animal models using mice and rats are available. In contrast to human lipid metabolism, however, mice are high-density lipoprotein cholesterol-dominant in their serum lipid profile and are essentially resistant to a high-fat/high-cholesterol diet (HcD) to develop atherosclerosis. This is explained by complete absence of expression of several genes that are critical for lipid metabolism and atherogenesis4, 5). There are some mice models of NAFLD, which range from hepatic isolated steatosis to non-alcoholic steatohepatitis (NASH), however, they do not genuinely reflect the pathology of human NASH1–3). For example, mice that are fed a methionine and choline-deficient diet manifest NASH lesions with severe body weight loss and hypolipidemia and do not recapitulate the full spectrum of metabolic syndrome6–8). The pathogenesis underlying the transition to NASH and subsequent end-stage liver cirrhosis and hepatocellular carcinoma, remains to be elucidated2, 3).
In contrast, recent studies, including our own, suggest that bile acid (BA), as well as cholesterol metabolism, are involved in the pathogenesis of NAFLD9–11). BAs are known to contain variable derivatives of cholic acid (CA), and each BA displays a specific affinity to the BA receptors and functions as a signaling molecule with distinctive effects to induce oxidative stress, cytotoxicity and apoptosis12, 13). Metabolic syndrome has actually been reported to be related with higher levels of secondary BAs, such as deoxy-CA13). In this scenario, efficient hepatic and intestinal excretion, absorption and transport of lipids and BAs, via enterohepatic and systemic circulation, would be expected to have diverse and key roles in the process of nutrient metabolism and also in the initiation to the progression of metabolic syndrome7, 9–11).
Our laboratory has recently established a novel animal model for studies of hyperlipidemia-induced atherosclerosis using the world's smallest Microminipigs™ (µMPs), in which CA supplementation is not necessary to induce atherosclerosis14, 15). Unlike popular mouse and rabbit models, swine represent a potentially more appropriate experimental model, since their lipoprotein metabolism, as well as their anatomy, physiology and feeding and sleep habits, are much similar to those of humans15, 16).
Aim
Our specific aim was to re-evaluate the effects of CA on obesity, serum lipid metabolism, atherosclerosis and hepatic injuries, and also to evaluate those on hepatic and systemic macrophage activation, which would accelerate atherogenesis and hepatic injuries in HcD-fed µMPs.
Methods
Animals and Diets
Three-month-old male µMPs weighing 5–6 kg were used for all experiments. The µMPs were maintained in a room temperature of 24 °C ± 3°C at 50% ± 20% relative humidity in a light-controlled facility (on a 12–h light/dark cycle) with ad libitum access to tap water. Body weight (BW) was measured once a week in a fasted state. The swine were fed a normal chow diet (NcD; Kodakara 73, Marubeni Nisshin Feed, Tokyo, Japan) or special diets on a daily basis (3% of BW/day). The HcD consisted of NcD supplemented with 12% lard (Miyoshi Oil & Fat, Tokyo Japan) and 1.5% cholesterol (Wako Pure Chemical, Osaka, Japan). HcD with cholic acid (CA; Wako Pure Chemical) diet (HcD+CA) contained 0.7% CA in HcD. Fifteen µMPs were divided into three groups (n = 5 in each); NcD group (one µMP died within the experimental period), HcD group, and HcD+CA group. The blood glucose, blood cell counts, blood chemistry, lipoprotein levels and blood pressure were measured every two weeks in a fasted state. All µMPs were anesthetized and sacrificed via bilateral axillary artery exsanguination, and all of organs were excised, cut into appropriately sized pieces, and used for analyses after measuring the weight of each organ. We collected serum samples from the axillary vein and artery at sacrifice.
Ethical Considerations
All the protocols were approved by Ethics Committee of Animal Care and Experimentation, Kagoshima University, and were performed according to the Institutional Guidelines for Animal Experiments and the Law (no. 105) and Notification (no. 6) of the Japanese Government. The present study was also performed in accordance with animal welfare bylaws of Shin Nippon Biochemical Laboratories Ltd. (Kagoshima, Japan), a facility fully accredited by Association for Assessment and Accreditation of Laboratory Animal Care (AAALAC) International and approved by the International Animal Care and Use Committee.
Analyses of Hepatic, Fecal and Serum Lipid and Bile Acid Contents
Serum levels of aspartate aminotransferase (AST), alanine aminotransferase (ALT), γ-glutamyl transpeptidase (γ-GTP), and alkaline phosphatase (ALP), were measured using an assay kit (Wako Pure Chemical). To examine lipid and bile acid (BA) contents in the liver, feces and serum, each frozen sample was homogenized and extracted with chloroform-methanol (2/1 v/v) and ethanol solution, as previously described7, 17). The organic phase was dried and reconstituted in 2-propanol. Then, triglyceride (TG), free fatty acid (FFA), cholesteryl ester (CE), and BA contents were determined using an assay kit (Wako Pure Chemical).
Computed Tomography
Abdominal computed tomography (CT) images were obtained before the experiments and after eight-week feeding. The fat thickness of the back subcutaneous adipose tissue was measured and percent increase of the fat thickness was calculated.
Serum Lipoprotein Analyses
After the eight-week feeding, µMPs were fasted for 20 h, and blood was collected from the axillary artery into a tube containing five µl of 0.5 mol/L ethylenediaminetetraacetic acid. The samples were centrifuged for 12 min at 5,500 × g at 4°C and the serum was stored at −80°C until use. Total cholesterol (T-cho), chylomicron (CM), very low-density lipoprotein-(VLDL-cho), low-density lipoprotein-(LDL-cho), and high-density lipoprotein-cholesterol (HDL-cho), and TG were analyzed by an automated agarose gel electrophoresis apparatus (Epalyzer 2, Helena Laboratories, Saitama, Japan).
Serum Cytokine Analysis
Serum collected at eight-week feeding was assayed for interleukin-1β (IL-1β), interleukin-6 (IL-6), and tumor necrosis factor-α (TNF-α) using porcine-specific ELISA kits (R&D Systems, Minneapolis, MN) according to the manufacturer's instructions.
Blood Pressure
The arterial blood pressures were measured at the foreleg in conscious µMPs using a Manchette method with an apparatus made for human pediatric use.
Histology and Immunohistochemistry
The resected organs were fixed with 10% neutral buffered formalin for 24 h, and serial paraffin sections were applied to hematoxylin and eosin (H&E) stain or immunohistochemistry (IHC). Images from H&E, oil-red O, combined elastic and Masson trichrome (E-M), IHC and immunofluorescence (IF) stains were captured and quantified using a NIS-Elements D software program (Nikon, Tokyo, Japan)18). The degree of lipid accumulation (steatosis score) in H&E- and oilred O-stained frozen tissue sections was categorized into four grades as follows: no lipid droplets (score 0); lipid droplets in < 33% of hepatocytes (score 1); lipid droplets 33%–66% of hepatocytes (score 2) and lipid droplets in > 66% of hepatocytes (score 3)6, 8).
To evaluate accumulation of macrophages in each tissue, IHC using a polyclonal rabbit anti-human lysozyme antibody were performed (1:1,000; Dako, Glostrup, Denmark)15). The number of lysozyme-positive macrophages was counted in 10 randomly selected fields in each sections. To assess activation of stellate cells, the liver tissues were stained with a monoclonal mouse anti-human smooth muscle actin (α-SMA; Clone 1A4) antibody (1:100; Dako), and positive stellate cells was counted in 10 randomly selected fields per section as previously described7).
Hepatic lymphocytic infiltration (inflammation score) was classified into four grades as following: no inflammation (score 0); < 10 inflammatory foci, each consisting of > 5 inflammatory cells (score 1); ≥ 10 inflammatory foci (score 2) or uncountable diffuse or fused inflammatory foci (score 3)6, 8). The degree of liver cell ballooning (ballooning score) was classified into three grades as follows: none (score 0); few balloon cells (score 1) or many balloon cells/prominent ballooning (score 2). Hepatic fibrosis was quantified by combined E-M stain. To determine expression of reactive oxygen species (ROS) and oxidative stress in the liver, we used an anti-8-hydroxy-2′-deoxyguanosine (8-OHdG) monoclonal antibody (1:100; Japan Institute for the Control of Aging, Fukuroi, Japan) and anti-4-hydroxy-2-nonenal (4-HNE) monoclonal antibody (1:100; Japan Institute for the Control of Aging) for IHC and quantified the number of cells positive for either antibody in five randomly selected fields per section as previously described6, 7). The endogenous peroxidase activity was not blocked in the IHC for oxidative stress markers.
To evaluate the islet change and visceral adiposity, the pancreatic islet area and the size of visceral adipocytes were measured in five randomly selected fields per section using NIS-Elements D software program.
All histological slides were evaluated by two independent observers (S.Y. and H.K.), who were blinded to all data. In the case of disagreement, a consensus score was determined by a third observer (A.T.).
Assessment of Atherosclerosis
Each aorta was cut open longitudinally and fixed with 10% neutral buffered formalin for 24 h, then the aorta was stained with oil-red O stain for 20 min at room temperature. The en face images of the aorta were captured with a digital camera. The oil-red O-positive area relative to the whole surface area was measured with NIH image software program19). For histological examinations, six-step sections of every 1 cm of abdominal aorta were stained with H&E and IHC. For quantitative analysis, images of the six-step sections were scanned using NIS-Elements D software program to evaluate thickened intimal area20).
Hepatic Apoptosis
To determine apoptotic cell counts in the liver, we conducted TUNEL assays using an In Situ Cell Death Detection Kit (Roche Applied Science, Lewes, UK). The formalin-fixed liver sections were labeled with TUNEL reaction mixture, incubated with DAPI (1 µg/mL; Abbott Molecular Inc., Des Plaines, IL, USA), and visualized with anti-fluorescein-antibodies. The number of TUNEL-positive hepatocytes were counted in 10 randomly selected fields per section under a fluorescence microscope (BX51N-34; Olympus, Tokyo, Japan).
Serum Nitric Oxide Levels
After µMPs were fasted for 20 h, venous blood samples were collected and centrifuged at 3,000 rpm at 4 °C for 15 min. The supernatants were stored at −80°C until use. The blood nitric oxide (NOx) levels were assessed by the Griess method21).
Thiobarbituric Acid Reactive Substances Levels
Serum thiobarbituric acid reactive substances (TBARS) levels were measured using a TBARS Assay Kit (Cayman Chemical, Ann Arbor, MI, USA). The results are expressed as nM malondialdehyde (MDA)/mg LDL protein.
Monitoring of Intracellular O2− Levels by Dihydroethidium Stain
In situ O2− staining was performed using frozen liver sections to determine the levels of ROS and oxidative stress in hepatocytes. Frozen sections (3 µm in thickness) were stained with dihydroethidium (DHE; 5 µM) fluorescent dye (Molecular Probes, Eugene, OR, USA) for in situ O2− imaging. The oxidative fluorescent dye was freely permeable to cells, and in the presence of O2− was oxidized to ethidium bromide (EtBr), which was trapped by intercalation with DNA. After staining, we quantified the number of EtBr-positive nuclei in 10 randomly selected fields per section under BX51N-34 fluorescence microscope.
Real-time RT-PCR
Expression levels of mRNAs were quantified by a real-time RT-PCR on total RNA extracted with a ReliaPrep™ RNA Tissue Miniprep System (Promega, Madison, WI, USA). First-strand cDNA was synthesized with a High Capacity RNA-to-cDNA kit (Thermo Fisher Scientific, Waltham, MA, USA). A quantitative real-time RT-PCR was performed using a TaqMan fluorogenic probe method with a LightCycler® 96 System II PCR machine (Roche Diagnostics, Tokyo, Japan). The relative expression levels of each gene were normalized to those of 18S ribosomal RNA (rRNA). The pairs of specific primers for the genes tested are shown in Supplemental Table 1. The cycling conditions were as follows: 95°C for 10 min followed by 45 cycles of 95°C for 15 s and 60 °C for 1 min. The threshold cycle (CT) values that corresponded to the cycle number at which fluorescence emission occurred were measured and monitored in real time until they reached a threshold of 10 SDs above the mean baseline. Serial 1:10 dilutions of plasmid DNA containing each target cDNA were analyzed, and served as standard curves from which the rate of change in the CT values was determined. To determine the mRNA levels, an mRNA expression index was used wherein the mRNA expression levels were standardized by rRNA. The mRNA expression index in arbitrary units (AU) was calculated as follows: mRNA expression index =(copy numbers of target gene mRNA/copy numbers of 18S rRNA) × 1 AU.
Supplemental Table 1. Primers used for real-time RT-PCR.
| Gene | Assay ID | Custom made primers | RefSeq | GenBank |
|---|---|---|---|---|
| LDLR | Ss03374441_ul | NM_001206354.1 | AF065990.1 | |
| HMGCR | Ss03390147_mL | NM_001122988.1 | DQ432054.1 | |
| NPC1L1 | Forward: CCTGTTCGGAGCGAGTCTCTA | XM_003134893.1 | ||
| Reverse: GAAAGAGGAAATAGTCGAGCAGGTA | ||||
| Probe: CTGCCCAAGGACTC | ||||
| 18S rRNA | TaqMan Ribosomal RNA Control Reagents VIC Probe (Applied Biosystems, Cat. No. 4308329) | |||
The assay IDs are listed for the predesigned gene expression assay (ABI). The primers and probes for the NPC1L1 analyses were created based on swine sequences.
Statistical Analyses
All values are expressed as mean ± SE. Significant differences were analyzed using Student's t-test, Welch's t-test or one-way ANOVA. In all cases in which the ANOVA method was used to analyze non-parametric data, Tukey's multiple comparison post hoc test was used. p-values of < 0.05 were considered to indicate statistical significance.
Results
Body Weight and Visceral Adiposity
The BW of µMPs in each group increased gradually. HcD and HcD+CA groups displayed moderate obesity in comparison to NcD group, however, no statistical difference was observed among three groups after eight weeks (Fig. 1A). The relative organ weights of omentum, mesenterium, and liver, but not the spleen, of HcD+CA-fed µMPs increased in comparison to NcD- and HcD-fed µMPs (Fig. 1B). Histologically, the diameter of adipocytes of white adipose tissue (WAT) in HcD+CA-fed µMPs was significantly larger than that in NcD- and HcD-fed µMPs (Fig. 1C). The food consumption similarly increased in three groups along with the increase in BW (data not shown).
Fig. 1.
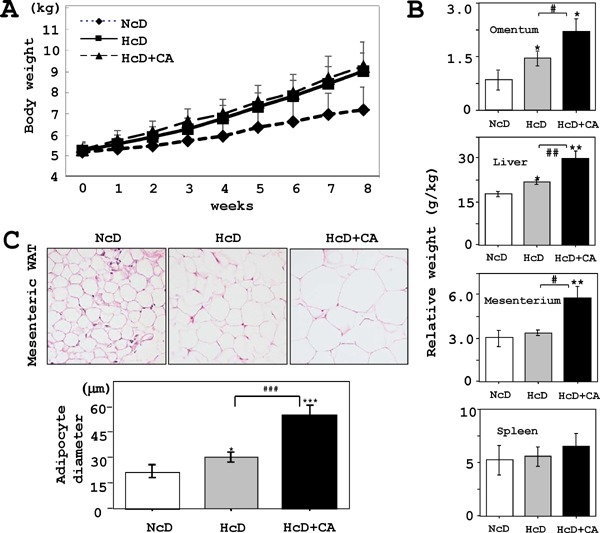
Growth curve and WAT adipocyte size.
A) The BW gradually increased in each group. HcD- and HcD+CA-fed groups displayed a tendency for moderate obesity in comparison to NcD-fed µMPs; however, there were significant differences among three groups after eight weeks of feeding. B) Relative organ weight of HcD-CA-fed µMPs increased in the omentum, liver, and mesenterium in comparison to those from NcD- and HcD-fed µMPs. C) Histologically, the adipocytes from HcD+CA-fed µMPs were significantly increased in size in comparison to those from NcD- and HcD-fed µMPs. The values represent mean ± SE. *p < 0.05, **p < 0.01, and ***p < 0.001 vs. NcD-fed µMPs; and #p < 0.05, ##p < 0.01 and ###p < 0.001 vs. HcD-fed µMPs.
Subcutaneous Fat Thickness in Abdominal CT
The fat thickness of the back (% increase) before and after eight–week feeding was significantly increased in HcD- and HcD+CA-fed µMPs in comparison to NcD-fed µMPs (NcD; 148% ± 39% vs. HcD; 235% ± 22% and HcD+CA; 232% ± 12%, p = 0.039 and p = 0.027, respectively), but there was no significant difference between HcD- and HcD+CA-fed µMPs.
Serum Lipid Profile
HcD- and HcD+CA-fed µMPs developed hyperlipidemia with increased levels of T-cho, CM, VLDLcho, LDL-cho and HDL-cho in comparison to NcD-fed µMPs. However, there was no significant difference in the serum lipid profiles between HcD-fed and HcD+CA-fed µMPs (Table 1).
Table 1. Serum lipid profile and BA level in µMPs.
| Serum | NcD (n = 4) | HcD (n = 5) | HcD+CA (n = 5) |
|---|---|---|---|
| T-cho (mg/dL) | 73.5 ± 6.1 | 609.0 ± 48.4*** | 744.8 ± 121.2** |
| CM (mg/dL) | 1.5 ± 0.6 | 19.4 ± 2.7** | 28.2 ± 9.2* |
| VLDL-cho (mg/dL) | 4.5 ± 0.6 | 33.2 ± 7.3** | 28.4 ± 7.0* |
| LDL-cho (mg/dL) | 37.0 ± 7.0 | 408.5 ± 29.2*** | 513.3 ± 93.3** |
| HDL-cho (mg/dL) | 30.3 ± 1.4 | 152.0 ± 10.3*** | 182.0 ± 20.9*** |
| TG (mg/dL) | 45.3 ± 8.6 | 39.0 ± 5.8 | 70.5 ± 16.7# |
| %LDL (%) | 49.3 ± 5.0 | 68.0 ± 1.4* | 68.0 ± 2.3** |
| %HDL (%) | 42.0 ± 3.5 | 24.0 ± 1.3*** | 23.3 ± 2.6** |
| BA (µM) | 0.4 ± 0.10 | 0.8 ± 0.04** | 1.1 ± 0.38* |
Values are means ± SE.
P < 0.05,
P < 0.01
P < 0.001 vs. NcD-fed µMPs;
P < 0.05 vs. HcD-fed µMPs.
Serum Inflammatory Cytokine Profile
After eight-week feeding, the serum levels of IL-1β, IL-6, and TNF-α were measured using ELISA. The serum levels of TNF-α, but not those of IL-1β and IL-6, showed a moderate increase only in HcD-CA-fed µMPs. This TNF-α increase was not statistically significant but showed a possible trend toward significance (p = 0.0569) (Supplemental Fig. 1).
Supplemental Fig. 1.
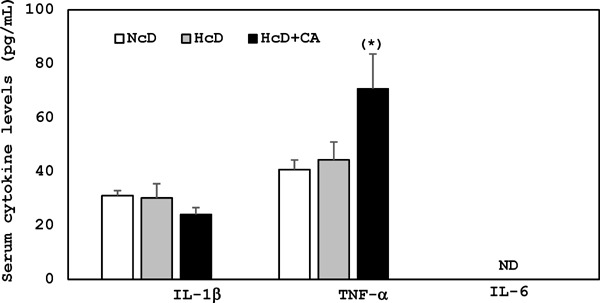
Serum inflammatory cytokines levels after 8 week feeding. The serum levels of TNF-α were moderately increased in HcD-CA-fed µMPs after 8 week feeding, but not those of IL-1β and IL-6 was not detected in our experimental conditions. (*) The increase of TNF-α showed a possible trend toward significance (p = 0.0569) vs. NcD-fed µMPs.
Blood Glucose and Blood Pressure
The blood glucose levels did not increase in any groups after eight weeks, and no significant differences were found among three groups, with exception of higher blood glucose in HcD+CA-fed µMPs in comparison to HcD–fed µMPs at two weeks and NcD-fed µMPs at six weeks (data not shown). The pancreatic tissues from three groups showed no remarkable change, and their islet areas were not significantly different (data not shown). The blood pressure did not significantly increase in any groups (systolic: 85–95 mmHg and diastolic: 45–60 mmHg).
Progressed Aortic Atherosclerosis in HcD+CA-fed µMPs
The en face analysis of aortas showed that atherosclerosis was pronounced in HcD+CA-fed µMPs in comparison to NcD- and HcD-fed µMPs (Fig. 2A), even though the serum lipid levels was not different in HcD- and HcD+CA-fed groups. Thickness of the intima of aortas was significantly increased in HcD- and HcD+CA-fed µMPs than that in NcD-fed µMPs. The thickened intima consisted of accumulation of macrophages and significantly larger numbers of macrophages were infiltrating the upper layer of aortic media in HcD+CA-fed µMPs (Fig. 2B).
Fig. 2.
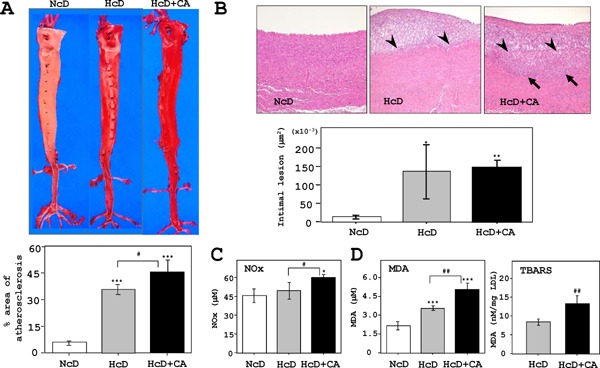
Analyses of atherosclerotic aortas.
A) The en face analysis of oil red-O-stained aortas revealed that the atherosclerotic lesion (red-stained) in HcD+CA-fed µMPs was further progressed than that in HcD-fed µMPs. B) Quantitative analyses showed that the thickening of the intimal areas of aorta was increased in HcD- and HcD+CA-fed µMPs as compared to NcD-fed µMPs. Histological examinations of the atherosclerotic lesions in HcD+CA-fed µMPs demonstrated that the thickened intimal areas predominantly consisted of accumulation of macrophages. Intriguingly, greater numbers of infiltrating foam cells were observed in the upper layer of the aortic media from HcD+CA-fed µMPs (arrows). Arrowheads denote the border between the intima and the media. C) Serum NOx levels were increased in HcD+CA-fed µMPs, in comparison to NcD- and HcD-fed µMPs after eight weeks of feeding. The NOx levels in NcD- and HcD-fed µMPs were not significantly different. D) Similarly, serum MDA levels in HcD+CA-fed µMPs were higher than those in NcD- and HcD-fed µMPs. The levels of another oxidative stress marker, TBARS, in HcD+CA-fed µMPs were increased in comparison to HcD-fed µMPs. Serum TBARS levels are expressed as nM MDA/mg LDL protein. The values represent mean ± SE. *p < 0.05, **p < 0.01, and ***p < 0.001 vs. NcD-fed µMPs; and #p < 0.05 vs. HcD-fed µMPs.
Serum Bile Acid and Fecal Lipid Profile and Bile Acid
The serum bile acid (BA) levels in HcD- and HcD+CA-fed µMPs were significantly higher than those in NcD-fed µMPs (Table 1). Both HcD- and HcD+CA-fed µMPs showed increased levels of fecal CE, FFA and TG in comparison to NcD-fed µMPs. On the other hand, the fecal BA content in HcD+ CA-fed µMPs was higher than that in NcD- and HcD-fed µMPs (Table 2).
Table 2. Fecal lipid and BA levels in µMPs.
| Feces | NcD (n = 4) | HcD (n = 5) | HcD+CA (n = 5) |
|---|---|---|---|
| CE (µEq/g) | 1.5 ± 0.14 | 9.4 ± 0.50** | 17.4 ± 2.65** |
| TG (mg/g) | 0.2 ± 0.06 | 2.1 ± 0.50* | 2.4 ± 0.35* |
| FFA (mg/g) | 7.5 ± 0.20 | 6.3 ± 0.22* | 6.8 ± 0.22* |
| BA (µM/g) | 0.1 ± 0.00 | 0.2 ± 0.04* | 0.7 ± 0.03***### |
Values are means ± SE.
P < 0.05,
P < 0.01
P < 0.001 vs. NcD-fed µMPs;
P < 0.001 vs. HcD-fed µMPs.
Serum NOx and TBARS Levels
The serum NOx levels in HcD+CA-fed µMPs were significantly increased in comparison to NcD- and HcD-fed µMPs after eight weeks, while those of NcD- and HcD-fed µMPs were not significantly different (Fig. 2C). Similarly, the serum MDA levels in HcD+CA-fed µMPs were markedly higher than those in NcD- and HcD-fed µMPs (Fig. 3B). The TBARS levels were significantly different between HcD- and HcD+CA-fed µMPs (Fig. 2D).
Fig. 3.
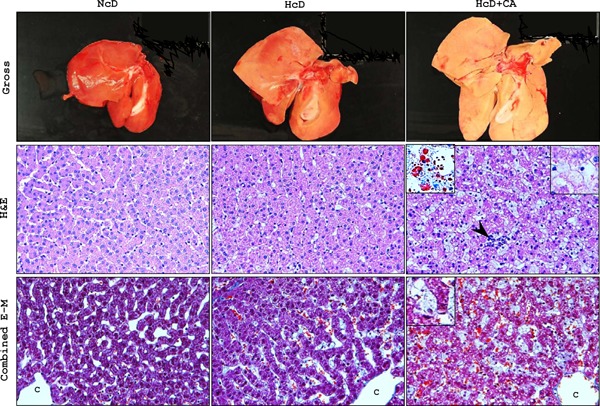
Histological analyses of livers.
Upper panels: In macroscopic examination after eight weeks of each diet, the livers of HcD+CA-fed µMPs, which were larger than the livers from NcD- and HcD-fed µMPs, were pale and yellowish in color, indicative of advanced lipid accumulation. The liver of NcD-fed µMPs showed no remarkable changes. Middle panels: Histological examination demonstrated that hepatic steatosis and inflammation (arrowhead) were accelerated in HcD+CA-fed µMPs in comparison to that in NcD and HcD-fed µMPs. Hepatocyte ‘ballooning’ (inset, right upper) was occasionally seen in high-power views of H&E-stained specimens from HcD+CA-fed µMPs; it was observed more frequently than in the other two groups. Oil red-O staining showed that HcD+CA-fed livers contained an increased number of small lipid droplets, which were diffusely deposited in both the hepatocytes and the sinusoidal foamy Kupffer cells, indicating microvesicular steatosis (inset, left upper). Lower panels: With combined E-M staining, perivenular, and pericellular fibrosis were rarely seen in the liver of any group of µMPs. In contrast, E-M staining clearly revealed the enlargement of the foamy Kupffer cells (inset). Representative photomicrographs of gross appearance and histological sections are shown for each group of µMPs. C = central vein
Histopathological Analyses of the Liver
After eight weeks, the livers of HcD+CA-fed µMPs were enlarged, pale and yellowish in color, whereas those of NcD- and HcD-fed µMPs showed no remarkable change (upper panels in Fig. 3). H&E sections showed that microvesicular steatosis and inflammation were significantly accelerated in HcD+CAfed µMPs in comparison to NcD- and HcD-fed µMPs (middle panels in Fig. 3 and Table 3). Furthermore, although hepatocyte ballooning was occasionally seen in the liver of HcD+CA-fed µMPs, the frequency was significantly higher than that in other two groups. Consequently, significant differences were observed in NAFLD scores between NcD- and HcD-fed µMPs and between HcD+CA-fed µMPs (NcD; 0.25 ± 0.25, HcD; 1.20 ± 0.20 and HcD+CA; 4.40 ± 0.60) (Table 3). Oil-red O stain demonstrated that the livers of HcD+CA-fed µMPs contained a larger number of small lipid droplets, which were diffusely deposited in both the hepatocytes and sinusoidal foamy Kupffer cells (middle panels in Fig. 3). Perivenular and pericellular fibrosis were rarely seen in the livers of any groups in combined E-M stain (lower panels in Fig. 3).
Table 3. Hepatic histological scores and lipid, BA contens, and blood chemistry.
| NcD (n = 4) | HcD (n = 5) | HcD+CA (n = 5) | |
|---|---|---|---|
| Steatosis score | 0.00 ± 0.00 | 0.40 ± 0.24 | 1.60 ± 0.24**# |
| Inflammation score | 0.25 ± 0.25 | 0.80 ± 0.20 | 1.80 ± 0.20 ***## |
| Ballooning score | 0.00 ± 0.00 | 0.00 ± 0.00 | 1.00 ± 0.32*# |
| NAFLD score | 0.25 ± 0.25 | 1.20 ± 0.20** | 4.40 ± 0.60***### |
| Hepatic TG (mg/g) | 4.2 ± 0.6 | 13.9 ± 1.4*** | 23.3 ± 0.3***## |
| Hepatic FFA (µEq/g) | 3.5 ± 0.3 | 7.6 ± 0.6** | 13.8 ± 0.6***## |
| Hepatic CE (mg/g) | 3.3 ± 0.4 | 25.7 ± 1.6*** | 30.6 ± 1.7***# |
| Hepatic BA (µM/g) | 0.3 ± 0.02 | 0.5 ± 0.08* | 0.6 ± 0.20* |
| AST (IU/L) | 41.3 ± 4.4 | 33.0 ± 1.2* | 50.5 ± 3.0*### |
| ALT (IU/L) | 44.7 ± 6.3 | 33.3 ± 1.4* | 52.8 ± 9.2# |
| γ-GTP (IU/L) | 50.3 ± 2.4 | 53.6 ± 2.1 | 74.0 ± 3.0****** |
| ALP (IU/L) | 685.8 ± 100.7 | 983.2 ± 135.1 | 1006.6 ± 68.4* |
Values are means ± SE.
P < 0.05,
P < 0.01
P < 0.001 vs. NcD-fed µMPs;
P < 0.05,
P < 0.01
P < 0.001 vs. HcD-fed µMPs.
Biochemical Analyses of the Liver
Hepatic TG, FFA and CE contents were markedly increased in HcD+CA-fed µMPs (Table 3). Although the levels of hepatic BA in HcD- and HcD +CA-fed groups were significantly higher than those in NcD-fed µMPs, there were no significant differences between two groups. The serum levels of AST, ALT, γ-GTP and ALP were increased in HcD+CAfed µMPs as compared to those in NcD- and HcDfed µMPs (Table 3). The expression levels of hydroxymethylglutaryl-CoA reductase (HMGCR) and LDL receptor (LDLR) were markedly lower in the livers of HcD+CA-fed µMPs in comparison to those of NcD- and HcD-fed µMPs (Supplemental Fig. 2).
Supplemental Fig. 2.

Cholesterol metabolism-related gene expression in the liver.
The real-time RT-PCRs demonstrated that expression levels of NPC1L1 in the livers of HcD+CA-fed µMPs were lower in comparison to NcD- and HcD-fed µMPs. Moreover, expression levels of HMGCR and LDLR in the livers of HcD+CA-fed µMPs were lower than those in the livers of NcD- and HcD-fed µMPs. The values represent mean ± SE and were normalized to the 18S rRNA expression. *p < 0.05, **p < 0.01, and ***p < 0.001 vs. NcD-fed µMPs; and #p < 0.05, ##p < 0.01 and ###p < 0.001 vs. HcD-fed µMPs.
Oxidative Stresses and Apoptosis in the Livers
The numbers of liver cells that accumulated 4-HNE or 8-OHdG, which were low in NcD- and HcD-fed µMPs, were significantly increased in HcD+ CA group (Fig. 4A). Correspondingly, significantly larger numbers of 4-HNE-positive and 8-OHdG-positive hepatocytes were observed in the livers of HcD+ CA-fed µMPs (Fig. 4A). The numbers of DHE-positive hepatocytes of NcD- and HcD-fed µMPs were quite small, while there was a significant increase in those in the nuclei of livers of HcD+CA-fed µMPs Fig. 4A). By TUNEL assay, HcD+CA-fed µMPs showed significantly increased numbers of apoptotic hepatocytes in comparison to NcD- and HcD-fed µMPs (Fig. 4B). These apoptotic hepatocytes occasionally showed condensed chromatin and fragmented nuclei (Fig. 4B).
Fig. 4.
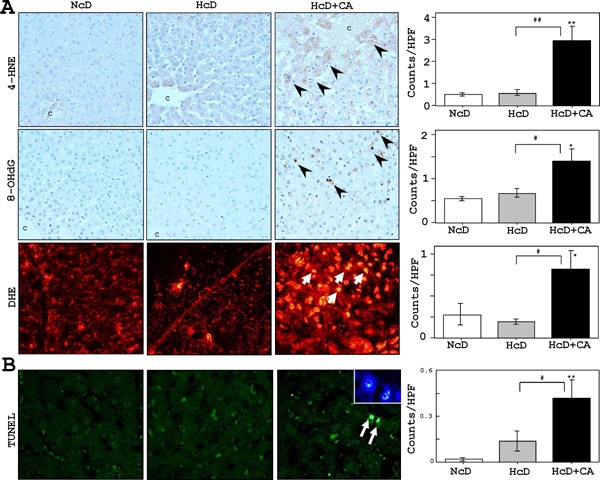
Hepatic oxidative stress markers and apoptotic activity.
A) IHC revealed that very small numbers of liver cells accumulated 4-HNE and 8-OHdG in NcD- and HcD-fed µMPs. The 4-HNE and 8-OHdG-positive cell numbers were increased in HcD+CA feeding (arrowheads). Furthermore, the numbers of DHE-positive hepatocytes in the livers of HcD+CA-fed µMPs (red-stained; arrows) were increased than in NcD- and HcD-fed µMPs after eight weeks of treatment. C= central vein. B) Significantly greater numbers of TUNEL-positive hepatocytes (green-stained; arrows) were observed in HcD+CA-fed µMPs in comparison to NcD- and HcD-fed µMPs. The apoptotic hepatocytes occasionally showed condensed chromatin and fragmented nuclei with DAPI staining (inset). The values represent mean ± SE. *p < 0.05 and **p < 0.01 vs. NcD-fed µMPs; and #p < 0.05 and ##p < 0.01 vs. HcD-fed µMPs.
Activated Kupffer Cells and Stellate Cells in the Livers of HcD+CA-fed µMPs
The livers of HcD+CA-fed µMPs contained increased numbers of lysozyme-positive sinusoidal macrophages with foamy cytoplasm (Kupffer cells) than those of NcD- and HcD-fed groups (Fig. 5A). In addition, fibrogenesis and stellate cell activation, as determined by IHC for α-SMA, were not apparent in NcDand HcD-fed µMPs (Fig. 6B). In contrast, IHC demonstrated a linear expression of α-SMA along the hepatic sinusoids of HcD+CA-fed µMPs. This was accompanied by increased numbers of activated hepatic stellate cells in HcD+CA-fed µMPs (Fig. 5B).
Fig. 5.
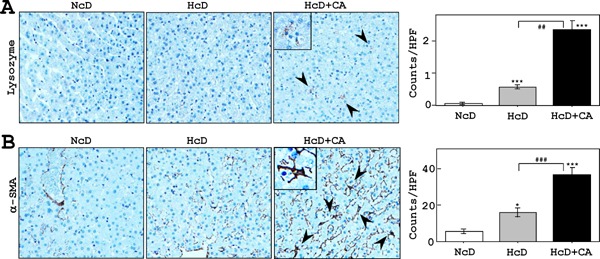
Analyses of activated Kupffer cells and stellate cells.
A) IHC to detect lysozymes showed that the livers of HcD+CA-fed µMPs contained increased numbers of infiltrating sinusoidal foamy macrophages; Kupffer cells (arrowheads and insert) in comparison to NcD- and HcD-fed groups. B) Activated stellate cells, which are positive for α-SMA, were not apparent in the livers of NcD-fed µMPs. In contrast, IHC revealed a linear expression of α-SMA along the hepatic sinusoids of HcD+CA-fed µMPs (inset) in comparison to NcD- and HcD-fed µMPs. This was confirmed by increased numbers of activated hepatic stellate cells (arrowheads). The values represent mean ± SE. *p < 0.05 and ***p < 0.001 vs. NcD-fed µMPs; and ##p < 0.01 and ###p < 0.01vs. HcD-fed µMPs.
Fig. 6.
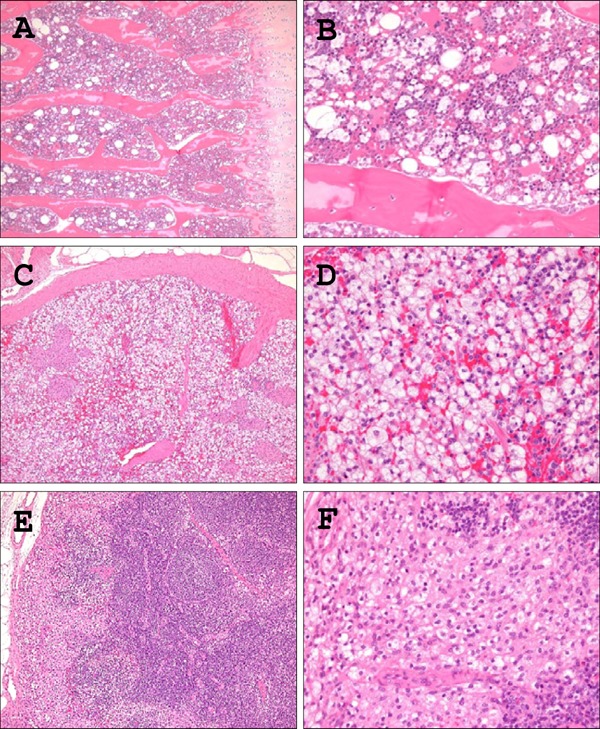
Histological analyses of mobilization of foamy macrophages in the reticuloendothelial system.
H&E sections demonstrated that the reticuloendothelial system, including the liver (as shown in Fig. 3), bone marrow (A, B), spleen (C, D), and lymph nodes (E, F) from HcD+CA-fed µMPs contained increased numbers of infiltrating foamy macrophages in comparison to NcD- and HcD-fed groups. Foamy macrophages were infiltrating in the sinuses in the spleen and lymph node. A) C) E), low power magnification; B) D) F), high power magnification
Systemic Mobilization of Foamy Macrophages in HcD+CA-fed µMPs
The reticuloendothelial system (RES), including bone marrow, spleen and lymph nodes, contained an inflammatory lesion consisting of a collection of foamy macrophages in HcD+CA-fed µMPs compared with NcD-fed groups (Fig. 6). The lesions in bone marrow and lymph nodes were very often found in HcD+ CA-fed µMPs (Table 4). In addition, an accumulation of foamy macrophages was observed in the capillary vessels of alveolar septa (pulmonary intravascular macrophages; PIM) and the upper dermis of the skin (cutaneous xanthoma cells) only in HcD+CA-fed µMPs, but not in other two groups (Fig. 7 and Table 4).
Table 4. Summary of histological findings.
| NcD | HcD | HcD+CA | ||||||
|---|---|---|---|---|---|---|---|---|
| n = 4 | n = 5 | n = 5 | ||||||
| Frequency | 1 | 2 | 3 | 4 | 5 | |||
| Atherosclerosis | 0/4 | 5/5 | 5/5 | + | + | + | + | + |
| Foamy Mφ infiltration | ||||||||
| Bone marrow | 0/4 | 2/5 | 5/5 | + | + | + | + | + |
| Spleen | 0/4 | 4/5 | 5/5 | + | + | + | + | + |
| Lymph node | 0/4 | 1/5 | 5/5 | + | + | + | + | + |
| Lung | 0/4 | 0/5 | 5/5 | + | + | + | + | + |
| Skin | 0/4 | 0/5 | 4/5 | + | + | + | − | + |
Fig. 7.
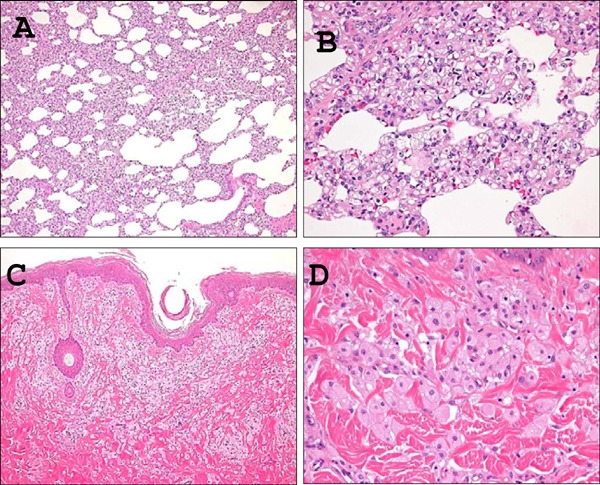
Histological analyses of mobilization of foamy macrophages in the lung and skin.
A large number of accumulated foamy macrophages were observed in the capillary vessels of pulmonary alveolar septa (pulmonary intravascular macrophages) (A, B) and the perivascular areas of upper dermis of the nipple (xanthoma cells) (C, D) from HcD+CA-fed µMPs. These cells were not found in any other two groups. A) C), low power magnification; B) D), high power magnification
The Histological and Molecular Analyses of Small Intestine
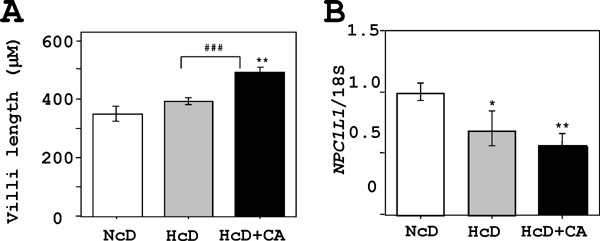
The jejunal villi length in HcD+CA-fed µMPs was significantly increased in comparison to NcD- and HcD-fed µMPs (Supplemental Fig. 3A). No accumulation of small lipid droplets in the enterocytes was observed in any three groups. The expression levels of NPC1L1 were significantly lower in the jejunum of HcD- and HcD+CA-fed µMPs in comparison to NcD-fed group. However, no significant differences were detected between HcD- and HcD+CA-fed µMPs (Supplemental Fig. 3B).
Supplemental Fig. 3.
Histological and biochemical analyses of the jejunum.
A) The jejunal villi length in HcD+CA µMPs was increased in comparison to that in NcD- and HcD-fed µMPs. Accumulation of small lipid droplets in the surface enterocytes was not observed in any µMPs. B) A real-time RT-PCR showed that expression levels of NPC1L1, one of key cholesterol-uptake transporters, in the jejunum of HcD- and HcD+CA-fed µMPs were lower in comparison to NcD-fed µMPs. This suggested a negative feedback process against pronounced cholesterol/BA absorption and transport. However, there were no significant differences between HcD- and HcD+CA-fed µMPs. The values represent mean ± SE and were normalized to 18S rRNA expression. *p < 0.05, **p < 0.01, and ***p < 0.001 vs. NcD-fed µMPs; and #p < 0.05, ##p < 0.01 and ###p < 0.001 vs. HcD-fed µMPs.
Discussion
Some studies have been reported to develop swine models for NAFLD or metabolic syndrome22–24). At present, however, a small number of studies have been reported to investigate the potential role of CA in the development of NAFLD using swine model25). In the present study, in comparison with HcD feeding, HcD+CA feeding enhanced visceral adiposity, progression of NAFLD, and atherosclerosis in µMPs. To our knowledge, this is the first large animal model, in which visceral obesity, NAFLD and atherosclerosis are concomitantly induced by eight-week dietary manipulation.
CA supplementation to HcD accompanied higher levels of serum oxidative stress markers, TNF-α and BA levels, and systemic foamy macrophage mobilization but no significant difference in serum lipid levels. In addition, increased hepatic TG, FFA, BA and oxidative stresses, and accelerated activation of sinusoidal foamy Kupffer cells and stellate cells, along with enhanced hepatocyte apoptosis, were observed in the livers of HcD+CA-fed µMPs, indicating that CA induces progression of NAFLD. Furthermore, increased numbers of foamy macrophages were identified in various organs, such as the RES, including bone marrow, liver, spleen and lymph nodes, as well as the pulmonary capillary vessels and skin in HcD+CA-fed µMPs. These results provide novel insights into the effects of CA on systemic macrophage activation possibly through oxidative stress, TNF-α signaling and progression of visceral adiposity, NAFLD and atherosclerosis. The administration of CA might augment the local (intrahepatic) and systemic (circulating) expression of oxidative stressors and TNF-α, and stimulate macrophages mobilization. These would accelerate visceral obesity, atherosclerosis, hepatic steatosis, inflammation, and apoptosis26–28).
In the studies of atherosclerosis animal models, especially using non-gene-modified mice and rabbits, CA is often supplemented with high-fat/cholesterol diet to enhance hypercholesterolemia by interfering with hepatobiliary excretion or by increased intestinal absorption of cholesterol, resulting in atherosclerosis29, 30). On the other hand, CA is not required for the development of atherosclerosis in LDLR-deficient mice, like in atherosclerosis model using µMP as previously reported31, 32). In the LDLR-deficient mice, the atherosclerotic lesion area of the aorta was not enhanced by a CA diet (40% fat, 1.25% cholesterol, and 0.5% cholic acid) compared with a CA-free diet (40% fat and 1.25% cholesterol), even though hypercholesterolemia was induced by CA diet31). This is a result to the contrary in the present study that HcD+CA-fed µMP showed accelerated atherosclerosis, but hypercholesterolemia was not enhanced compared with CA-free HcD-fed µMP. Since the jejunum NPC1L1, a cholesterol-uptake transporter, and hepatic HMGCR and LDLR expression were markedly suppressed to the same degree in HcD- and HcD+CA-fed µMPs, CA would have no more effects to enhance hypercholesterolemia mediated through the regulation of these cholesterol-related genes. These indicate a presence of another potential mechanism(s) of dietary CA for the progression of atherosclerosis, not by a further induction of hypercholesterolemia. One possible explanation for the mechanism(s) is that CA stimulates vascular response to induce the progression of atherosclerosis via induction of oxidative stress and inflammation12, 13, 29). However, the serum lipid levels of HcDCA- fed µMPs showed a borderline significant trend in comparison with those of HcD-fed animals, it seems difficult to completely exclude the possibility that the effect of CA supplementation is totally independent of serum lipid profiles.
The hepatic histology of HcD+CA-fed µMPs showed inflammation, macrophage, and stellate cell activation, steatosis and apoptotic cell death of hepatocytes but did not meet the full requirements of diagnosis for NASH33, 34) because of the absence of pericellular sinusoidal fibrosis. The liver tissues, however, contained increased amounts of cholesterol, TG, and FFA, which is considered to be a first step for the development of NAFLD35–37). On the basis of alteration of hepatic lipid metabolism, a second hit is required to promote oxidative stress that overwhelms the endogenous cell survival mechanisms, leading to hepatocyte apoptosis, fibrosis, and cirrhosis38). CA and CA-related BAs (e.g., secondary BAs such as deoxy-CA and ursodeoxy-CA) function as signaling molecules for the induction of oxidative stress12, 13), and BA levels including deoxy-CA and CA are actually increased in the NASH liver tissues of human patients39). Thus, CA would play a certain role in the pathogenesis of NAFLD in the present swine model and recently reported rat model, in which a high-fat/high-cholesterol diet with 2% CA induces NASH-related cirrhosis40). Another swine model using Ossabaw miniature swine showed that 0.7% CA (equal to HcD-CA diet composition in the present study) contained atherogenic diet-induced microvesicular steatosis, Kupffer cell activation and hepatocyte ballooning but not inflammation or fibrosis25). In this Ossabaw miniature swine, modification of the atherogenic diet (different source of fat and higher protein but lower choline content) is necessary to develop hepatic inflammation and fibrosis. It is still unclear why the different sensitivity to CA is observed in the different animal models, but some studies suggested that the source of protein in the diet affects pancreatic hormone secretion and lipid metabolism-related hepatic gene expression, which may modify the hepatic lesion development41, 42).
The HcD+CA-fed µMPs showed a unique phenotype of systemic macrophage mobilization, which was characterized by a significant increase in the numbers of foamy macrophages. These macrophages can be more frequently identified in various organs from HcD+CA-fed µMPs, such as RES, including bone marrow, liver, spleen, and lymph nodes, as well as the lung and upper dermis. In the lung, macrophage accumulation in the capillary vessels of alveolar septum is known as PIMs, which are normally found in selected species including swine, but not often found in humans43). The PIM is classified into two different conditions: constitutive and induced PIM. The constitutive PIM has been observed in swine, sheep, goats, and horse, and induced PIM has been reported in rats, mice, guinea pigs, and hamsters. After operation of the common bile duct ligation, chronic bile duct obstruction induces PIM in rats44). Other studies have suggested that the depletion of induced PIM in bileligated rats reduced endotoxin-induced pulmonary inflammation45, 46). The bile duct ligation also increased endotoxin sensitivity, however, lipopolysaccharide alone cannot explain the induction of PIM39). Thus, increased serum and hepatic BAs, due to chronic bile duct obstruction and impaired BA excretion might stimulate systemic and hepatic oxidative response and pro-inflammatory cytokine production to recruit macrophages in the RES29). This situation would be very similar to the present studies that dietary CA induces oxidative and inflammatory responses to systemically activate the RES.
Conclusion
HcD+CA-fed µMPs exhibited unique features of visceral adiposity, progressed NAFLD and atherosclerosis and systemic macrophage mobilization. The present study provides new evidence of a possible mechanism(s) by which CA increases both local and systemic expression of oxidative stress and inflammatory cytokine, and activates macrophages in various organs, promoting visceral obesity, atherosclerosis and NAFLD.
Acknowledgments
We would like to thank Prof. Haruaki Ninomiya, Department of Biological Regulation, Tottori University Faculty of Medicine, and Drs. Hirotsugu Noguchi and Takaaki Ogoshi, Department of Pathology and Cell Biology, and Respiratory Medicine, University of Occupational and Environmental Health, for their excellent technical assistance and helpful comments. Furthermore, we would like to thank Orie Iwaya and Yoshie Jitoho, Department of Pathology, Kagoshima University Graduate School of Medical and Dental Sciences, for their expert technical assistance.
Notice of Grant Support
This work was supported in part by a grant from the Kodama Memorial Fund for Medical Research, Kagoshima, Japan (to S.Y.), Health Labour Sciences Research Grant (No. 33361105) from the Ministry of Health, Labour and Welfare of Japan (to A.T.), the Adaptable and Seamless Technology Transfer Program Grant (A-Step No. AS2316907E) from the Ministry of Education, Culture, Sports, Science and Technology, Tokyo, Japan (to A.T. and H.K.), the Suzuken Memorial Foundation (to N.M.) and the SENSHIN Medical Research Foundation (to H.K. and N.H.).
COI
The authors declare no conflicts of interest in association with the present study.
References
- 1). Angulo P: Nonalcoholic fatty liver disease. N Engl J Med, 2002; 346: 1221-1231 [DOI] [PubMed] [Google Scholar]
- 2). Kim CH, Younossi ZM: Nonalcoholic fatty liver disease: a manifestation of the metabolic syndrome. Cleve Clin J Med, 2008; 75: 721-728 [DOI] [PubMed] [Google Scholar]
- 3). Neuschwander-Tetri BA: Nonalcoholic steatohepatitis and the metabolic syndrome. Am J Med Sic, 2005; 330: 326-335 [DOI] [PubMed] [Google Scholar]
- 4). Getz G.S, Reardon CA: Animal models of atherosclerosis. Arterioscler Thromb Vasc Biol, 2012; 32: 1104-1115 [DOI] [PMC free article] [PubMed] [Google Scholar]
- 5). Lammert F, Wang DQ: New insights into the genetic regulation of intestinal cholesterol absorption. Gastroenterology, 2005; 129: 718-734 [DOI] [PubMed] [Google Scholar]
- 6). Nabeshima A, Yamada S, Guo X, Tanimoto A, Wang KY, Shimajiri S, Kimura S, Tasaki T, Noguchi H, Kitada S, Watanabe T, Fujii J, Kohno K, Sasaguri Y: Peroxiredoxin 4 protects against nonalcoholic steatohepatitis and type 2 diabetes in a nongenetic mouse model. Antioxid Redox Signal, 2013; 19: 1983-1998 [DOI] [PMC free article] [PubMed] [Google Scholar]
- 7). Nawata A, Noguchi H, Mazaki Y, Kurahashi T, Izumi H, Wang KY, Guo X, Uramoto H, Kohno K, Taniguchi H, Tanaka Y, Fujii J, Sasaguri Y, Tanimoto A, Nakayama T, Yamada S: Overexpression of peroxiredoxin 4 affects intestinal function in a dietary mouse model of nonalcoholic fatty liver disease. PLoS One, 2016; 11: e0152549. [DOI] [PMC free article] [PubMed] [Google Scholar]
- 8). Wang KY, Tanimoto A, Yamada S, Guo X, Ding Y, Watanabe T, Kohno K, Hirano K, Tsukada H, Sasaguri Y: Histamine regulation in glucose and lipid metabolism via histamine receptors: model for nonalcoholic steatohepatitis in mice. Am J Pathol, 2010; 177: 713-723 [DOI] [PMC free article] [PubMed] [Google Scholar]
- 9). Hernández Vallejo SJ, Alqub M, Luquet S, Cruciani-Guglielmacci C, Delerive P, Lobaccaro JM, Kalopissis AD, Chambaz J, Rousset M, Lacorte JM: Short-term adaptation of postprandial lipoprotein secretion and intestinal gene expression to a high-fat diet. Am J Physiol Gastrointest Liver Physiol, 2009; 296: G782-G792 [DOI] [PubMed] [Google Scholar]
- 10). Iqbal J, Hussain MM: Intestinal lipid absorption. Am J Physiol Endocrino Metab, 2009; 296: E1183-E1194 [DOI] [PMC free article] [PubMed] [Google Scholar]
- 11). Yamada S, Guo X, Wang KY, Tanimoto A, Sasaguri Y: Novel function of histamine signaling via histamine receptors in cholesterol and bile acid metabolism: Histamine H2 receptor protects against nonalcoholic fatty liver disease. Pathol Int, 2016; 66: 376-385 [DOI] [PubMed] [Google Scholar]
- 12). de Aguiar Vallim TQ, Tarling EJ, Edwards PA: Pleiotropic roles of bile acids in metabolism. Cell Metab, 2013; 17: 657-669 [DOI] [PMC free article] [PubMed] [Google Scholar]
- 13). Ferreira D, Afonso MB, Rodrigues PM, Simão AL, Pereira DM, Borralho PM, Rodrigues CM, Castro RE: c-Jun N-terminal kinase 1/c-Jun activation of the p53/microRNA 34a/sirtuin 1 pathway contributes to apoptosis induced by deoxycholic acid in rat liver. Mol Cell Biol, 2014; 34: 1100-1120 [DOI] [PMC free article] [PubMed] [Google Scholar]
- 14). Kawaguchi H., Miyoshi N., Miura N., Fujiki M., Horiuchi M., Izumi Y., Miyajima H., Nagata R., Misumi K., Takeuchi T., Tanimoto A., Yoshida H: Microminipig, a non-rodent experimental animal optimized for life science research: novel atherosclerosis model induced by high fat and cholesterol diet. J Pharmacol Sci, 2011; 115: 115-121 [DOI] [PubMed] [Google Scholar]
- 15). Kawaguchi H, Yamada T, Miura N, Ayaori M, Uto-Kondo H, Ikegawa M, Noguchi M, Wang KY, Izumi H, Tanimoto A: Rapid development of atherosclerosis in the world's smallest Microminipig fed a high-fat/high-cholesterol diet. J Atheroscler Thromb, 2014; 21: 186-203 [DOI] [PubMed] [Google Scholar]
- 16). Forster R, Ancian P, Fredholm M, Simianer H, Whitelaw B: The minipig as a platform for new technologies in toxicology. J Pharmacol Toxicol Methods, 2010; 62: 227-235 [DOI] [PubMed] [Google Scholar]
- 17). Noguchi H, Yamada S, Nabeshima A, Guo X, Tanimoto A, Wang KY, Kitada S, Tasaki T, Takama T, Shimajiri S, Horlad H, Komohara Y, Izumi H, Kohno K, Ichijo H, Sasaguri Y: Depletion of apoptosis signal-regulating kinase 1 prevents bile duct ligation-induced necroinflammation and subsequent peribiliary fibrosis. Am J Pathol, 2014; 184: 644-661 [DOI] [PubMed] [Google Scholar]
- 18). Tasaki T, Yamada S, Guo X, Tanimoto A, Wang KY, Nabeshima A, Kitada S, Noguchi H, Kimura S, Shimajiri S, Kohno K, Ichijo H, Sasaguri Y: Apoptosis signal-regulating kinase 1 deficiency attenuates vascular injury induced neointimal hyperplasia by suppressing apoptosis in smooth muscle cells. Am J Pathol, 2013; 182: 597-609 [DOI] [PubMed] [Google Scholar]
- 19). Yamada S, Wang KY, Tanimoto A, Fan J, Shimajiri S, Kitajima S, Morimoto M, Tsutsui M, Watanabe T, Yasumoto K, Sasaguri Y: Matrix metalloproteinase 12 accelerates the initiation of atherosclerosis and stimulates the progression of fatty streaks to fibrous plaques in transgenic rabbits. Am J Pathol, 2008; 172: 1419-1429 [DOI] [PMC free article] [PubMed] [Google Scholar]
- 20). Guo X, Yamada S, Tanimoto A, Ding Y, Wang KY, Shimajiri S, Murata Y, Kimura S, Tasaki T, Nabeshima A, Watanabe T, Kohno K, Sasaguri Y: Overexpression of peroxiredoxin 4 attenuates atherosclerosis in apolipoprotein E knockout mice. Antioxid Redox Signal, 2012; 17: 1362-1375 [DOI] [PMC free article] [PubMed] [Google Scholar]
- 21). Furuno Y, Morishita T, Toyohira Y, Yamada S, Ueno S, Morisada N, Sugita K, Noguchi K, Sakanashi M, Miyata H, Tanimoto A, Sasaguri Y, Shimokawa H, Otsuji Y, Yanagihara N, Tamura M, Tsutsui M: Crucial vasculoprotective role of the whole nitric oxide synthase system in vascular lesion formation in mice: Involvement of bone marrow-derived cells. Nitric Oxide, 2011; 25: 350-359 [DOI] [PubMed] [Google Scholar]
- 22). Litten-Brown JC, Corson AM, Clarke L: Porcine models for the metabolic syndrome, digestive and bone disorders: a general overview. Animal, 2010; 6: 899-920 [DOI] [PubMed] [Google Scholar]
- 23). Liang T, Alloosh M, Bell LN, Fullenkamp A, Saxena R, Van Alstine W, Bybee P, Werling K, Sturek M, Chalasani N, Masuoka HC: Liver injury and fibrosis induced by dietary challenge in the ossabaw miniature swine. PLoS One, 2015; 10: e0124173. [DOI] [PMC free article] [PubMed] [Google Scholar]
- 24). Li SJ, Ding ST, Mersmann HJ, Chu CH, Hsu CD, Chen CY: A nutritional nonalcoholic steatohepatitis minipig model. J Nurt Biochem, 2016; 28: 51-60 [DOI] [PubMed] [Google Scholar]
- 25). Lee L, Alloosh M, Saxena R, Van Alstine V, Watkins BA, Klaunig JE, Sturek M, Chalasani N: Nutiritional model of steatohepatitis and metabolic syndrome in the ossabaw miniature swine. Hepatology, 2009; 50: 56-67 [DOI] [PMC free article] [PubMed] [Google Scholar]
- 26). Alexopoulos N, Katritsis D, Raggi P: Visceral adipose tissue as a source of inflammation and promoter of atherosclerosis. Atherosclerosis, 2014; 233: 104-112 [DOI] [PubMed] [Google Scholar]
- 27). Abenavoli L, Peta V: Role of adipokines and cytokines in non-alcoholic fatty liver disease. Rev Recent Clin Trials, 2014; 9: 134-140 [DOI] [PubMed] [Google Scholar]
- 28). Lou G, Ma X, Fu X, Meng Z, Zhang W, Wang YD, Van Ness C, Yu D, Xu R, Huang W: GPBAR1/TGR5 mediates bile acid-induced cytokine expression in murine Kupffer cells. PLoS One, 2014; 9: e93567. [DOI] [PMC free article] [PubMed] [Google Scholar]
- 29). Lefebvre P, Cariou B, Lien F, Kuipers F, Staels B: Role of bile acids and bile acid receptors in metabolic regulation. Physiol Rev, 2009; 89: 147-191 [DOI] [PubMed] [Google Scholar]
- 30). Paigen B, Morrow A, Holmes PA, Mitchell D, Williams RA: Quantitative assessment of atherogenic lesions in mice. Atherosclerosis, 1987; 68: 231-240 [DOI] [PubMed] [Google Scholar]
- 31). Lichtman A.H, Clinton SK, Iiyama K, Connelly PW, Libby P, Cybulsky MI: Hyperlipidemia and atherosclerotic lesion development in LDL receptor-deficient mice fed defined semipurified diet with and without cholate. Arterioscler Thromb Vasc Biol, 1999; 19: 1939-1944 [DOI] [PubMed] [Google Scholar]
- 32). Akioka K, Kawaguchi H, Kitajima S, Miura N, Noguchi M, Horiuchi M, Miyoshi N, Tanimoto A: Investigation of Necessity of Sodium Cholate and Minimal Required Amount of Cholesterol for Dietary Induction of Atherosclerosis in Microminipigs. In Vivo, 2014; 28: 81-90 [PubMed] [Google Scholar]
- 33). Brunt EM, Kleiner DE, Wilson LA, Belt P, Neuschwander-Tetri BA: Nonalcoholic fatty liver disease (NAFLD) activity score and the histopathologic diagnosis in NAFLD: Distinct clinicopathologic meanings. Hepatology, 2011; 53: 810-820 [DOI] [PMC free article] [PubMed] [Google Scholar]
- 34). Sakamoto M, Tsujiwaka H, Effendi K, Ojima H, Harada K, Zen Y, Kondo F, Nakano M, Kage M, Sumida Y, Hashimoto E, Yamada G, Okanoue T, Koike K: Pathological findings of nonalcoholic steatohepatitis and nonalcoholic fatty liver disease. Pathol Int, 2017; 67: 1-7 [DOI] [PubMed] [Google Scholar]
- 35). Anstee QM, Goldin RD: Mouse models in non-alcoholic fatty liver disease and steatohepatitis research. Int J Exp Pathol, 2006; 87: 1-16 [DOI] [PMC free article] [PubMed] [Google Scholar]
- 36). Matsuzawa N, Takamura T, Kurita S, Misu H, Ota T, Ando H, Yokoyama M, Honda M, Zen Y, Nakanuma Y, Miyamoto K, Kaneko S: Lipid-induced oxidative stress causes steatohepatitis in mice fed an atherogenic diet. Hepatology, 2007; 20: 1392-1403 [DOI] [PubMed] [Google Scholar]
- 37). Neuschwander-Tetri BA: Hepatic lipotoxicity and the pathogenesis of nonalcoholic steatohepatitis: the central role of nontriglyceride fatty acid metabolites. Hepatology, 2010; 52: 774-788 [DOI] [PubMed] [Google Scholar]
- 38). Day CP, James OF: Steatohepatitis: a tale of two “hits”? Gastroenterology, 1998; 114: 842-845 [DOI] [PubMed] [Google Scholar]
- 39). Aranha MM, Cortez-Pinto H, Costa A, da Silva IB, Camilo ME, de Moura MC, Rodrigues CM: Bile acid levels are increased in the liver of patients with steatohepatitis. Eur J Gastroenterol Hepatol, 2008; 20: 519-525 [DOI] [PubMed] [Google Scholar]
- 40). Ichimura M, Masuzumi M, Kawase M, Sakaki M, Tamaru S, Nagata Y, Tanaka K, Suruga K, Tsuneyama K, Matsuda S, Omagari K: A diet-induced Sprague-Dawley rat model of nonalcoholic steatohepatitis-related cirrhosis. J Nut Biochem, 2016; 40: 62-69 [DOI] [PubMed] [Google Scholar]
- 41). Torre-Villalvazo I, Tovar AR, Ramos-Barragán VE, Cerbón-Cervantes MA, Torres N: Soy protein ameliorates metabolic abnormalities in liver and adipose tissue of rats fed a high fat diet, J Nutr 2008; 138: 462-468 [DOI] [PubMed] [Google Scholar]
- 42). Aziz A, Xiao CW, Cockell KA, Sarwar Gilani G, Cruz-Hernandez C, Nimal Ratnayake WM: Impact of dietary protein on lipid metabolism in hamsters is source-dependent and associated with changes in hepatic gene expression. Br J Nutr, 2008; 100: 503-511 [DOI] [PubMed] [Google Scholar]
- 43). Schneberger D, Aharonson-Raz K, Singh B: Pulmonary intravascular macrophages and lung health: what are we missing? Am J Physiol Lung Cell Mol Physiol, 2012; 302: L498-L503 [DOI] [PubMed] [Google Scholar]
- 44). Chang SW, Ohara N: Chronic biliary obstruction induces pulmonary intravascular phagocytosis and endotoxin sensitivity in rats. J Clin Invest, 1994; 94: 2009-2019 [DOI] [PMC free article] [PubMed] [Google Scholar]
- 45). Gill SS, Suri SS, Janardhan KS, Caldwell S, Duke T, Singh B: Role of pulmonary intravascular macrophages in endotoxin-induced lung inflammation and mortality in a rat model. Respir Res, 2008; 9: 69. [DOI] [PMC free article] [PubMed] [Google Scholar]
- 46). Thenappan T, Goel A, Marcboom G, Fang YH, Toth PT, Zhang HJ, Kajimoto H, Hong Z, Paul J, Wieholt C, Pogoriler J, Piao L, Rehman J, Archer SL: A central role for CD68+ macrophages in hepatopulmonary syndrome. Reversal by macrophage depletion. Am J Respir Crit Care Med, 2011; 183: 1080-1091 [DOI] [PMC free article] [PubMed] [Google Scholar]


