Abstract
Discovered four decades ago, the existence of introns was one of the most unexpected findings in molecular biology1. Introns are sequences interrupting genes that must be removed as part of mRNA production. Genome sequencing projects have documented that most eukaryotic genes contain at least one and frequently many introns2,3. Comparison of these genomes reveals a history of long evolutionary periods with little intron gain punctuated by episodes of rapid, extensive gain2,3. However, no detailed mechanism for such episodic intron generation has been empirically supported on a sufficient scale, despite several proposals4–8. Here we show how short non-autonomous DNA transposons independently generated hundreds to thousands of introns in the prasinophyte Micromonas pusilla and the pelagophyte Aureococcus anophagefferens. Each transposon carries one splice site. The other splice site is co-opted from gene sequence duplicated upon transposon insertion, allowing perfect splicing out of RNA. The distributions of sequences that can be co-opted are biased with respect to codons, and phasing of transposon-generated introns is similarly biased. These transposons insert between preexisting nucleosomes, so that multiple nearby insertions generate nucleosome-sized intervening segments. Thus, transposon insertion and sequence co-option may explain the intron phase biases2 and prevalence of nucleosome-sized exons9 observed in eukaryotes. Overall, the two independent examples of proliferating elements illustrate a general DNA transposon mechanism plausibly accounting for episodes of rapid, extensive intron gain during eukaryotic evolution2,3.
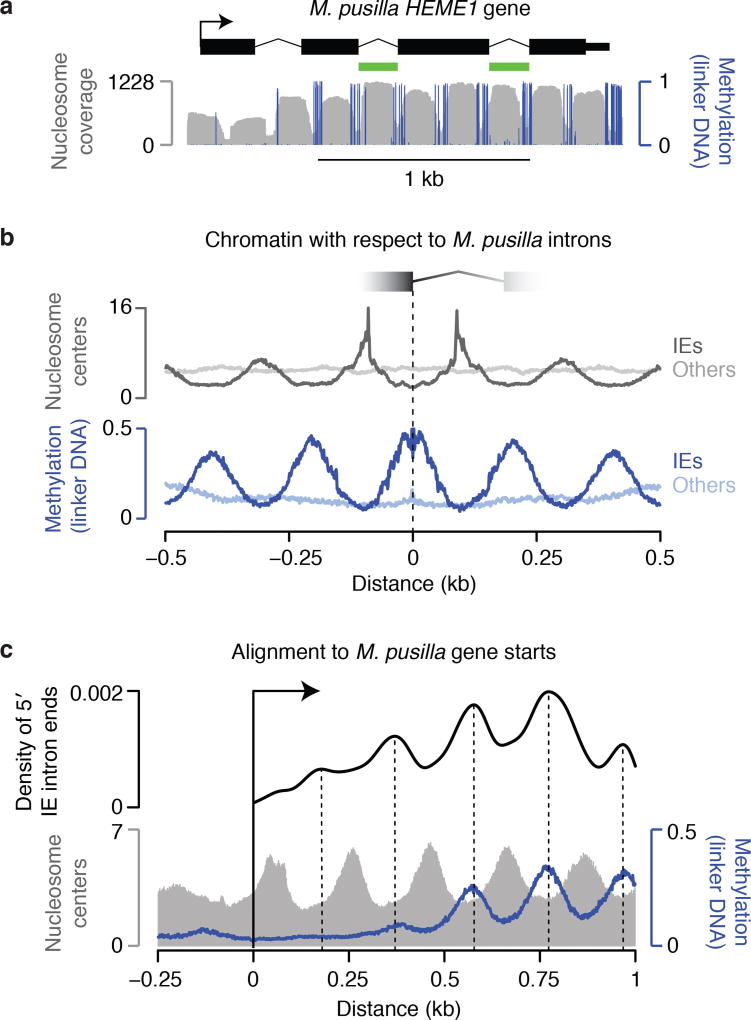
We began by examining the clearest case of recent, pervasive intron gain, which is in the prasinophyte alga Micromonas pusilla10. This genome gained thousands of spliceosomal introns with highly similar sequences (named “introner” elements10, IEs) by an unresolved mechanism. These IEs have distinctive lengths and sequences compared to other spliceosomal introns in the genome10,11. We first surveyed the 3,347 RNA sequencing-validated IEs that we identified (Supplementary Data 1) using nucleotide-resolution genomic chromatin maps we previously generated12. Unexpectedly, we found that most IEs align with nucleosomes and contain one nucleosome each (Fig. 1a,b), with 73% of IE ends located in nucleosome linker DNA, which is specifically marked by high cytosine methylation in this organism12. Alignment to nucleosomes for other introns is not appreciable (Fig. 1a,b), and the number of IE ends in linkers is significantly higher than for other intron ends (42%, P<2.2×10⁻¹⁶). One possible explanation is that IEs insert into the linker DNA between preexisting nucleosomes. To assess this possibility we used the fact that eukaryotic genes generally have phased nucleosome arrays emanating from their starts12, thus providing information about nucleosome positions prior to IE insertion. We found that IE locations align with linker DNA in phase with the starts of genes (Fig. 1c), revealing that IEs indeed insert into preexisting linkers between nucleosomes. Identification of IEs in the 5′ portions of genes that lack DNA methylation (Fig. 1c) suggests that IEs insert into nucleosome linkers per se, rather than specifically into regions of methylated DNA. Consistent with this, IEs in unmethylated regions still exhibit alignment with nucleosomes (Extended Data Fig. 1).
Figure 1. M. pusilla IEs insert between preexisting nucleosomes.
a, Each IE contains a nucleosome with ends in linker DNA, which is specifically marked by methylation in this organism. Validated introns and chromatin data12 are displayed. HEME1 contains 2 IEs (green). b, IE introns are generally in phase with nucleosome positions, whereas other introns are not. Chromatin maps12 are aligned to 5′ IE intron ends (dark lines) or other intron ends (light lines). c, IEs are in phase with the starts of genes, indicating insertion between preexisting nucleosomes. Chromatin maps12 and 5′ IE ends are aligned to gene starts. A kernel density estimate of IE ends is shown with peaks marked.
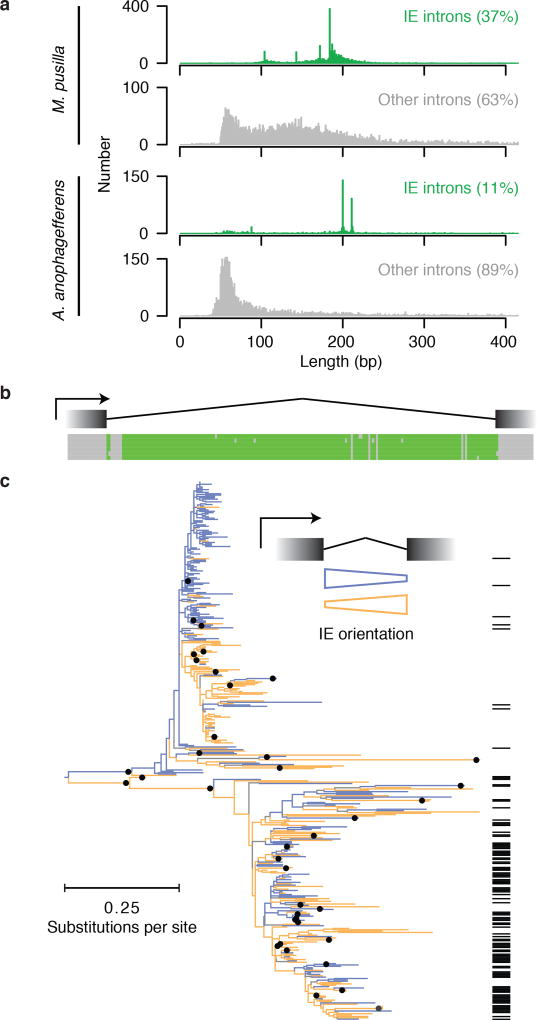
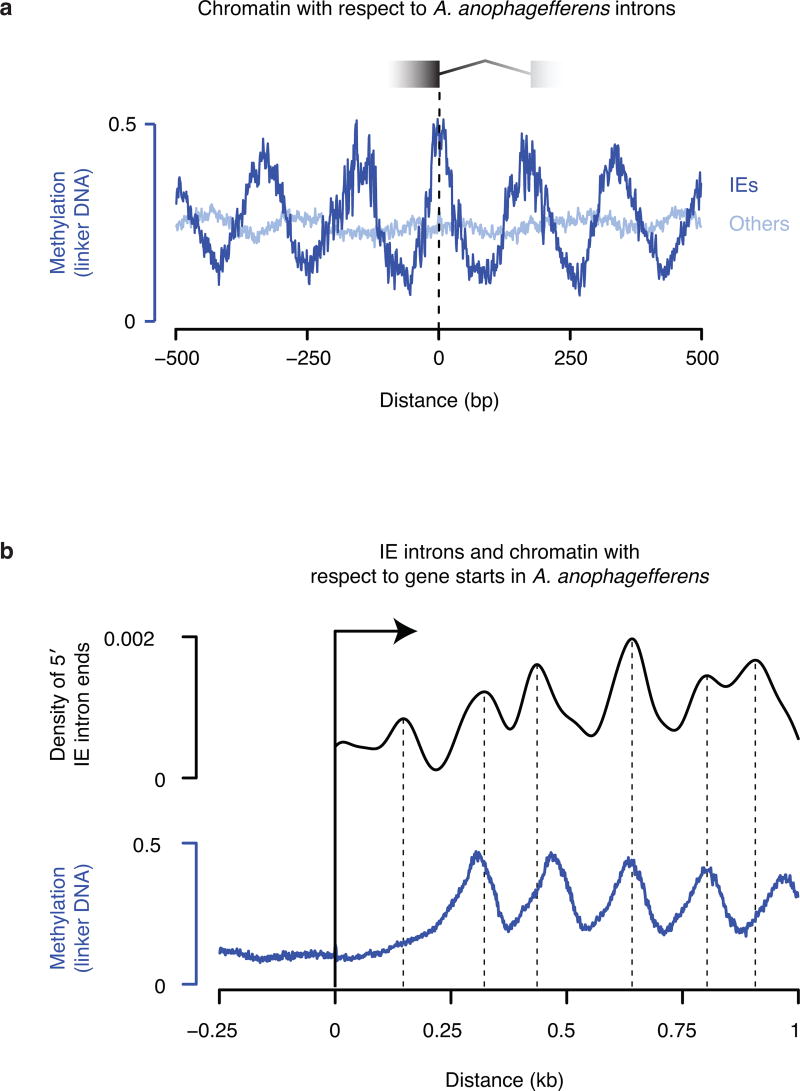
To identify potential examples of mechanistically similar intron gains, we searched for introns with the distinctive lengths11 (Fig. 2a) and correspondence to nucleosome positions (Fig. 1) of M. pusilla IEs in other species for which we previously generated validated intron junctions and chromatin maps12. We found hundreds of introns with these characteristics in the very distantly related pelagophyte alga Aureococcus anophagefferens13. An unbiased search in A. anophagefferens for the hallmarks of IEs—sequence similarity between introns that also do not have similarity in neighboring exons (Fig. 2b)—revealed 602 candidate IEs (11% of all RNA sequencing-validated introns, Supplementary Data 2). Like M. pusilla IEs, most A. anophagefferens IEs have distinctive lengths (Fig. 2a). Phylogenetic analysis of these IEs suggests two large related groups (Fig. 2c), which correspond to the two peak sizes (Fig. 2a). Also, A. anophagefferens IEs generally contain one positioned nucleosome in phase with the start of the gene (Extended Data Fig. 2), consistent with insertion into preexisting nucleosome linkers. There is no appreciable sequence similarity comparing IEs between the two organisms, suggesting that they evolved independently.
Figure 2. Identification of IEs in A. anophagefferens.
a, Validated lengths for IE (blue) and other (gray) introns. b, A. anophagefferens IEs share sequence similarity in intronic, not in neighboring exonic sequence. Six example IEs contain regions with maximal pairwise identities from 96 to 100%. Bases position identities in at least 5 of the 6 sequences are green. c, Most A. anophagefferens IEs can be aligned to form one or more related groups. Nodes present in >50% of 1,000 bootstraps are indicated with black dots on the ML tree. IEs are found in either orientation with respect to the intron (orange and blue). Many elements carry 3′ splice sites in both orientations (black lines at right).
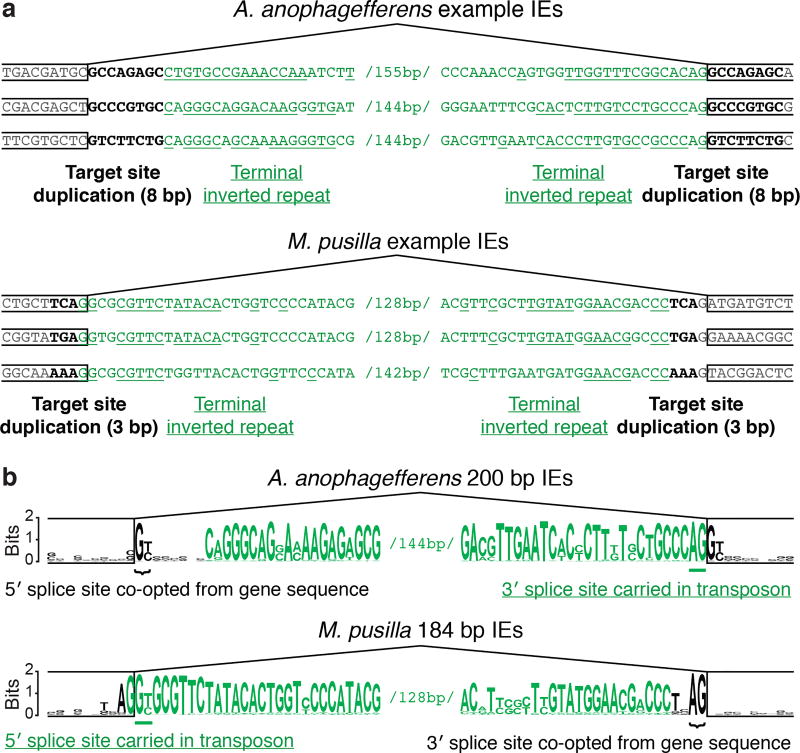
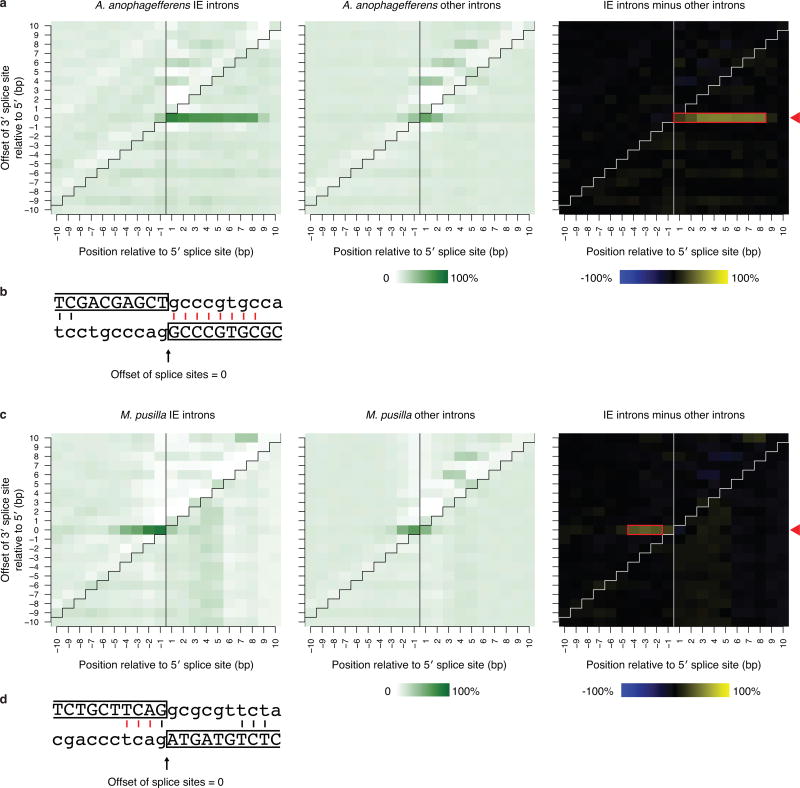
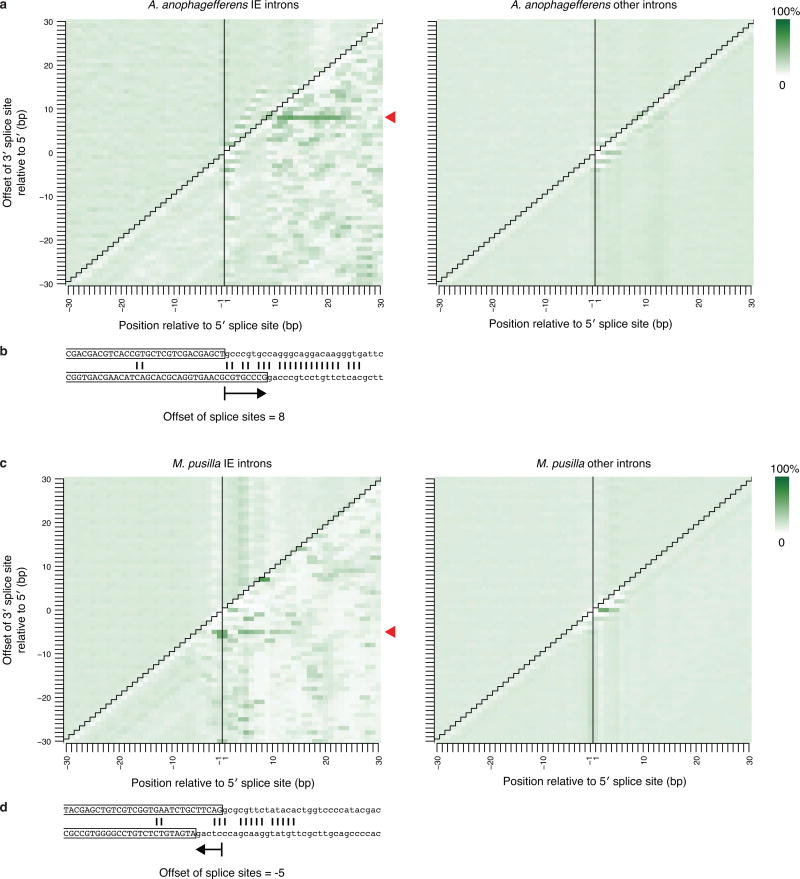
Within each genome, IEs are characterized by sequence similarity between introns, suggesting spread from one site to another. It has been proposed that IEs (and other introns) spread through an RNA intermediate involving reverse splicing8,11,14,15, resembling the mobility mechanisms of group II intron elements16. However, we found that IE insertion sites exhibit directly duplicated sequences in both genomes (target site duplications, TSDs), which are not expected from reverse splicing. These TSDs have characteristic lengths (8 bp in A. anophagefferens and 3 bp in M. pusilla; see Extended Data Fig. 3 and Supplementary Discussion), but the sequence of each tends to be particular to that IE insertion site (Fig. 3a). Such TSDs indicate insertions into double-stranded DNA, followed by repair of staggered single-stranded regions, causing direct duplication of a short sequence that differs for each element. Within the IEs and immediately flanked by the TSDs, inverted repeats are also observed (Fig. 3a and Extended Data Fig. 4). Elements that insert into double-stranded DNA to generate characteristic TSDs immediately adjacent to such terminal inverted repeats (TIRs) are known to be DNA transposons17,18. IEs are diminutive and contain no appreciable open reading frames, making them presumably reliant upon transposases encoded elsewhere in the genome. Thus, IEs are short non-autonomous DNA transposons (also known as miniature inverted-repeat transposable elements or MITEs19).
Figure 3. IEs are DNA transposons that carry a splice site and co-opt the other.
a, IEs (green) exhibit hallmarks of DNA transposons. Direct duplications (bold; target site duplications, TSDs) of 8 bp and 3 bp particular to A. anophagefferens and M. pusilla IEs, respectively, are adjacent to the ends. Inverted repeats (underlined) are at IE ends (terminal inverted repeats, TIRs). b, IEs carry one splice site and co-opt the other. Logos for the ends of the most abundant intron size classes are shown: 200 bp for A. anophagefferens and 184 bp for M. pusilla. In A. anophagefferens the 5′ splice site (bracketed) is constructed from a TSD (gene sequence before duplication), and the 3′ splice site (underlined) is carried in a transposon TIR. In M. pusilla the 5′ splice site (underlined) is carried in a transposon TIR and the 3′ splice site (bracketed) is constructed from a TSD.
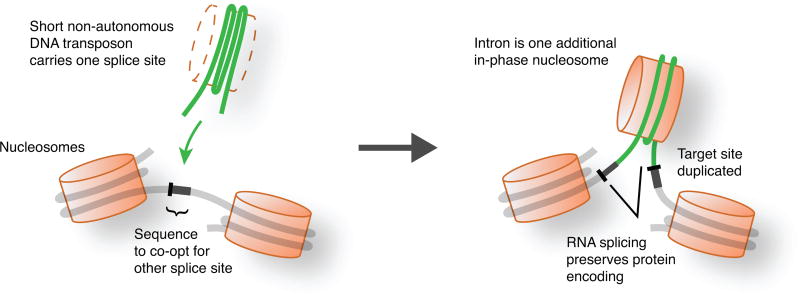
We found that IEs in both genomes carry one splice site at the end of one TIR (Fig. 3b): A. anophagefferens IEs carry a 3′ splice site (5′-AG-3′) and M. pusilla IEs carry a 5′ splice site (5′-GT-3′ or 5′-GC-3′). For both types of IE the other splice site is constructed from TSD sequence (Fig. 3b), which originates from duplication of exonic sequence during IE insertion. The sequence remains exonic on one side of the IE, so that protein encoding is unaltered following intron splicing out of the RNA (Extended Data Fig. 5).
DNA transposons can generally insert into a genome in either of two orientations relative to a gene. Given the presence of TIR sequences at the ends of each IE, there is potential to carry the splice site in both orientations. Indeed, many A. anophagefferens IEs carry 3′ splice sites in both orientations (see Supplementary Discussion and first IE in Fig. 3a) and apparently have generated introns in either orientation (Fig. 2c), further supporting the idea that IEs spread as DNA transposons. For other A. anophagefferens IEs, the TIRs differ in such a way that they carry a 3′ splice site in only one orientation, and are correspondingly found in that orientation in genes (Fig. 2c and second and third IEs in Fig. 3a). Likewise in M. pusilla IEs, branchpoint sequences for splicing are apparent in the dominant orientation found in genes10,11,15, and the vast majority carry a 5′ splice site in only that orientation (see Supplementary Discussion). Notably, M. pusilla IE sequences are found occasionally in the opposite orientation, in which case they are not spliced as introns20. They are also found in intergenic regions20, consistent with proliferation as transposons that need not generate introns in every case.
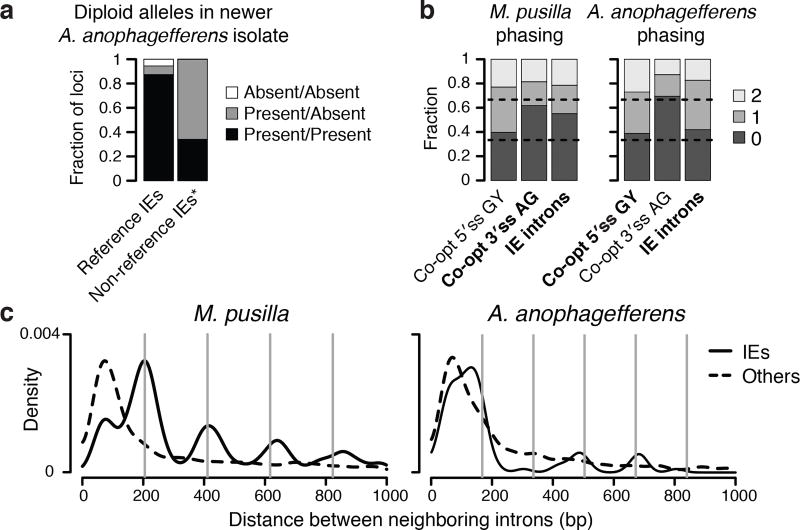
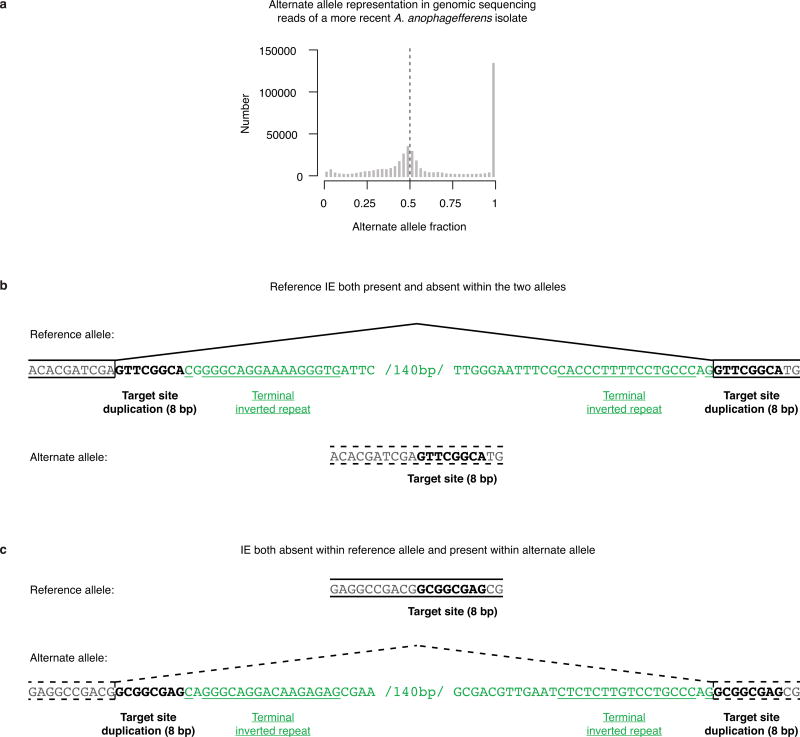
To explore IE dynamics we sequenced the genome of another A. anophagefferens isolate sampled from the environment 11 years after the reference genome isolate. Sequence variation in the newer isolate demonstrates that its genome is diploid (Extended Data Fig. 6). Of the IEs in the reference genome, 87% appear to be present within both alleles in the newer isolate (Fig. 4a), revealing the relative success of many IEs in stably colonizing the genome. On the other hand, 42 of the reference IE loci are present within only one allele of the newer isolate, and 33 reference loci have the IE absent from both alleles (Fig. 4a). We also identified 47 IE insertions in the newer isolate not present in the reference genome, 31 of which exhibit a presence-absence difference between the two alleles (Fig. 4a). Presence-absence variation demonstrates that many A. anophagefferens IEs are not fixed in populations, consistent with recent transposition. Furthermore, the alleles lacking the IEs have the sequences expected if the IEs are indeed DNA transposons with a splice site co-opted from 8 bp TSDs (Extended Data Fig. 6).
Figure 4. IE dynamics and genomic implications.
a, Presence-absence variation in a newer isolate of A. anophagefferens. *Non-reference IEs identified cannot be absent/absent. b, Sequences that can be co-opted to construct splice sites are biased with respect to codon phasing. For M. pusilla, IE introns should be biased by availability of AG sequences that can be co-opted as 3′ splice sites (3′ss). For A. anophagefferens, IE introns should be biased by availability of GY (Y is C or T) sequences that can be co-opted for 5′ splice sites (5′ss). IE introns indeed have phase biases more similar to the respectively co-opted sequence (bold). c, Nearby IE insertions generate nucleosome-sized segments. Distances between neighboring IE introns (solid) and between other neighboring introns (broken) are displayed as kernel density estimates. Nucleosome repeat lengths12 of 206 bp for M. pusilla and 168 bp for A. anophagefferens show the expected sizes of integer numbers of nucleosomes (vertical lines).
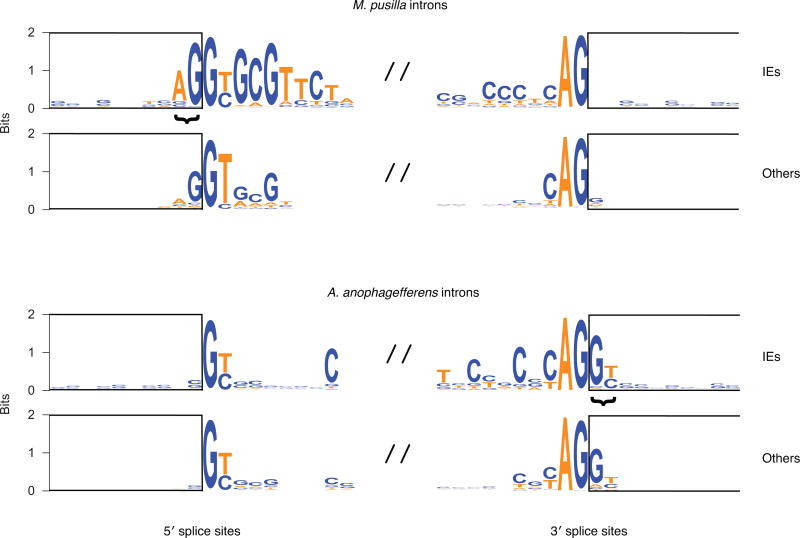
The necessity to co-opt preexisting sequence has at least two implications. First, IEs insert next to duplicated sequences that must contain a co-opted splice site to generate functional introns. This results in distinctive intron-exon junction sequences because M. pusilla and A. anophagefferens IEs must co-opt 3′ and 5′ splice sites, respectively (Fig. 3b and Extended Data Fig. 7). These distinctive sequences resemble junctions of non-IE introns in each respective organism (Extended Data Fig. 7), suggesting that co-opting one or the other splice site may be important for facilitating generation of optimal intron-exon junctions for splicing. Second, the sequences that can be co-opted to construct either 5′ or 3′ splice sites are biased in their phase distributions with respect to codons in genes (Fig. 4b). Therefore, selection for functional introns following IE insertions in each organism should similarly bias the respectively co-opted splice site sequences, which is indeed observed (Fig. 4b). Such a mechanism may explain the intron phase biases commonly observed in eukaryotes2.
Insertion of DNA transposons makes sense of the apparent IE preference for nucleosome linkers (Fig. 1 and Extended Data Figs. 1 and 2), as other DNA transposons show a strong preference for inserting between nucleosomes21,22. Biased insertion of IEs into nucleosome linkers provides a mutational mechanism for chromatin features to instruct the generation of new genetic material, namely introns (Extended Data Fig. 5). This possibility was proposed some time ago4 with implications for the structure of eukaryotic genomes. For example, rapid insertion of multiple IEs in close proximity could generate intervening segments (i.e., exons if in the same gene) with sizes corresponding to integer numbers of nucleosomes, which are indeed observed (Figs. 1a and 4c). Instruction of intron generation by chromatin features provides a straightforward mutational explanation for the tendency of animal exons to be approximately one nucleosome in length9.
The lack of sequence similarity between A. anophagefferens and M. pusilla IEs and divergence of the organisms more than a billion years ago23 suggest independent evolution of IEs. This is further supported by different TSD lengths (Extended Data Fig. 3), which implicate different transposase superfamilies24, and the fact that IEs carry a 5′ splice site in one organism and a 3′ splice site in the other (Fig. 3b). This independent evolution suggests that a DNA transposon mechanism for intron gain may be quite general.
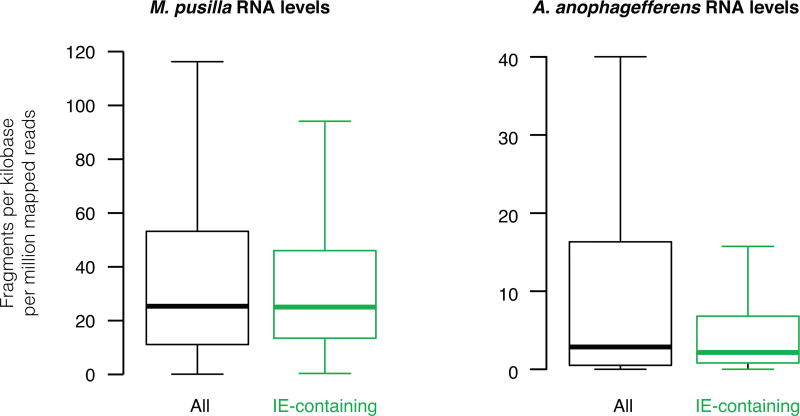
Non-autonomous DNA transposons likely excel at generating introns for several reasons. First, DNA elements do not need to be transcribed for transposition, especially if non-autonomous, permitting spread between genes that are not highly expressed (Extended Data Fig. 8). Second, whereas the extensive intron-exon base pairing required for group II intron splicing and mobility16 greatly constrains their genomic insertion sites and strongly reduces host gene expression25, DNA transposons carrying one splice site can generate introns that are perfectly spliced out with only minimal requirements of sequence co-option for the second splice site (Extended Data Fig. 5). Third, non-autonomous transposons can be short and noncoding, enabling relatively efficient splicing and freedom from constraint to encode transposases.
The IE mechanism described here substantiates long-standing proposals4,5 that DNA transposons are a major source of genomic introns. Episodes of rapid intron gain would naturally occur following the chance evolution of IEs, which are simply short DNA transposons carrying a splice site at an end. The antiquity and near ubiquity of DNA transposons24 opens up the possibility of an IE mechanism for most intron gains in eukaryotes, both recent and ancient.
Methods
RNA sequencing analysis
Splice junction calls (Supplementary Data 1 and 2) from the strand-specific RNA sequencing reads of our previous study12 (GEO accession GSE46692) were made using TopHat v2.0.626 with minimum and maximum intron lengths of 20 and 2000 bases, respectively. We mapped to the JGI Micromonas pusilla CCMP1545 assembly v3.0 “MicpuC3”10 and JGI Aureococcus anophagefferens assembly v1.0 “Auran1”13, in each case using both the genome sequence and the existing JGI transcriptome annotations. Intron phasing data were also calculated from these transcriptome annotations. RNA levels of genes (Extended Data Fig. 8) were estimated using Cufflinks v2.0.2 with bias correction27 after duplicates had been removed using Picard v1.79 (http://broadinstitute.github.io/picard/).
General computational analyses
Analyses were performed with custom R and Perl scripts. Alignment of chromatin data (DNA methylation and nucleosomes) from our previous study12 (GEO accession GSE46692) to intron positions and annotated gene starts (as well as alignment of IE intron positions to gene starts) was performed using dzlab-tools v1.5.52 (http://dzlab.pmb.berkeley.edu/tools/). Intron positions are from the splice junctions we called (Supplementary Data 1 and 2). Gene start positions are from the existing transcriptome annotations (JGI M. pusilla CCMP1545 assembly v3.0 “MicpuC3”10 and JGI A. anophagefferens assembly v1.0 “Auran1”13). Mean values at each base pair for genes or sets of introns are presented for nucleosome center data in Fig. 1b,c, and for DNA methylation data in Fig. 1b,c and Extended Data Fig. 2. Kernel density estimates in Figs. 1c and 4 and Extended Data Fig. 2b were made with the density() function in R at each base pair with a Gaussian smoothing bandwidth of 25 bp. Each peak in Fig. 1c and Extended Data Fig. 2b was defined as the base pair position with the local maximum kernel density estimate. Logos (Fig. 3b and Extended Data Fig. 7) were made with WebLogo28 v3.4 (http://weblogo.threeplusone.com/). Predicted intron phase distributions from co-opted sequences (Fig. 4b) are displayed if either all existing GY sequences were co-opted for 5′ splice sites or all existing AG sequences were co-opted as 3′ splice sites (Fig. 4b). These phases comes from the predicted codons in JGI Micromonas pusilla CCMP1545 assembly v3.0 “MicpuC3”10 and JGI Aureococcus anophagefferens assembly v1.0 “Auran1”13.
Genome-wide search for IEs using sequence similarity between introns
BLASTN29 searches were performed between the intronic sequences supported by splice junctions (Supplementary Data 1 and 2). Beginning with a seed sequence (a previously identified IE10 for M. pusilla CCMP1545 and an intron with a high degree of similarity to many other introns for A. anophagefferens), a recursive greedy BLAST search was performed against all other intronic sequences. Specifically, the seed sequence was BLASTed against all intronic sequences (E-value cutoff of 10−10). Sequences giving significant BLAST hits were collected and then used as seed sequences for the next round of BLAST. This recursive process terminated after several rounds for both organisms. Manual examination confirmed that putative IEs exhibited similarity between intronic sequences, but not between neighboring exonic sequences (examples in Fig. 2b). Whether an intron was identified as an IE or not is reported in Supplementary Data 1 and 2. See Extended Data Figs. 3 and 4 for unbiased assessment of TSDs and TIRs, respectively, with further details in the Supplementary Discussion.
Example IEs
The browser snapshot covering the HEME1 gene (MicpuC2.EuGene.0000010132) in Fig. 1a is from M. pusilla CCMP1545 scaffold_1 position 279,201 to 281,256 with the orientation reversed.
In Fig. 2b the A. anophagefferens IE introns compared are at: 1) scaffold_1 position 2,961,958 to 2,962,157 on the (+) strand; 2) scaffold_3 position 606,854 to 607,053 on the (+) strand; 3) scaffold_3 position 929,296 to 929,495 on the (−) strand; 4) scaffold_9 position 461,260 to 461,459 on the (+) strand; 5) scaffold_14 position 206,381 to 206,580 on the (−) strand; and 6) scaffold_29 position 136,996 to 137,195 on the (+) strand.
In Fig. 3a the A. anophagefferens IE introns are located at: 1) scaffold_15 position 454,111 to 454,321 on the (+) strand; 2) scaffold_4 position 315,481 to 315,680 on the (−) strand; and 3) scaffold_8 position 1,455,186 to 1,455,385 on the (+) strand. The M. pusilla CCMP1545 IE introns are located at: 1) scaffold_1 position 89,233 to 89,416 on the (+) strand; 2) scaffold_13 position 802,626 to 802,809 on the (−) strand; and 3) scaffold_8 position 72,296 to 72,493 on the (−) strand.
In Extended Data Fig. 6b, the A. anophagefferens reference allele shown is at scaffold_12 position 471,041 to 471,260 on the (+) strand. In Extended Data Fig. 6c, the reference allele shown is at scaffold_2 position 698,217 to 698,236 on the (−) strand.
A. anophagefferens IE alignment and tree
The A. anophagefferens IE introns were oriented and aligned using MAFFT30 v7 (http://mafft.cbrc.jp/alignment/software/). A maximum likelihood (ML) phylogenetic tree using the general time reversible (GTR) model31 was inferred using MEGA32 v6.06. In this method initial trees for a heuristic search are made by neighbor joining pairwise distances estimated by the maximum composite likelihood. A discrete gamma distribution for evolutionary rate differences among sites (+Γ; 5 categories with a parameter estimated to be 1.8285) was used. To compare only IE sequences, we removed the TSD sequence (see Supplementary Discussion for description of TSD identification) present in each intron. Only positions with 75% or more coverage (i.e. alignment gaps in less than 25% of the sequences) were used. We iteratively refined the alignment by realigning after manually removing terminal positions with many gaps and sequences with long wandering branches. This resulted in 168 positions of 398 sequences in the final analysis (Fig. 2c). We also performed 1,000 bootstraps. The final tree was rooted by midpoint, and terminal branches were colored according to IE orientation in FigTree v1.4.2 (http://tree.bio.ed.ac.uk/software/figtree/). Each internal branch was colored according to majority rule of its constituent terminal branch orientations. Internal branches with equal numbers of constituent terminal branches in both orientations were colored gray.
A. anophagefferens genome sequencing
The reference genome isolate of A. anophagefferens (CCMP1984) was collected originally on June 6, 1986 in the Great South Bay of Long Island, New York USA (40.6667°N 73.25°W). We chose to sequence one of the most divergent isolates available (CCMP1794), collected originally on July 21, 1997 in Barnegat Bay near Ship Bottom, New Jersey USA (39.6475°N 74.179°W). We obtained genomic DNA from this newer isolate directly from the Provasoli-Guillard National Center for Marine Algae and Microbiota.
Ten micrograms of DNA were sonicated 2×2 min. on power setting 2.5 of a Misonix 3000 water bath sonicator at room temperature. The sheared DNA was cleaned up and size selected by first binding it to 0.7 volumes of Agencourt AMPure XP beads (Beckman Coulter) and collecting the supernatant. That supernatant was then diluted and mixed with 0.75 volumes of Agencourt AMPure XP beads, this time washing and eluting the bound DNA. Two hundred nanograms of the purified and size-selected DNA were made into a library without PCR by using the Encore Rapid Library System (NuGEN; this kit has since been renamed the Ovation Rapid DR System). Paired-end 100-base sequencing was performed with the Illumina HiSeq 2000 platform.
Sequencing reads were first quality- and adapter-trimmed using Skewer v0.2.0 (https://sourceforge.net/projects/skewer/) with options “-Q 30 -q 20”. Trimmed reads were mapped to the A. anophagefferens assembly v1.0 “Auran1”13 using BWA-MEM33 v0.7.13 with default settings.
General genome variation was called using FreeBayes34 v1.0.2-29-g41c1313 using the options “-K -F 0.01”, which makes calls without making assumptions about the ploidy as long as the minimum alternate allele fraction is 0.01. The variants were filtered by requiring at least a sequencing depth of 50 and a variant quality score of 100. The resulting allele fractions for alternate alleles are presented in Extended Data Fig. 6a.
Reference IE loci (less the first 8 bp of their introns to remove TSD sequence) were genotyped from the genomic sequencing reads using T-lex235 v2.2.2 with the options “-noFilterTE -f 250 -v 25 -lima 25 -id 90 -limp 20”. Resulting calls of “polymorphic” and “absent” loci were manually curated by inspecting soft-clipped mapped reads, and the results are presented in Fig. 4a.
IE sequences not present in the reference genome were identified using RetroSeq36 v1.41 using the reference IE intron sequences to discover new candidates. Calls were then made using options “-reads 10 -depth 1000”. Candidate calls were further qualified and precisely assembled using the Kidd group’s pipeline37, originally devised for Alu elements. We modified the pipeline to use a custom repeat library composed of the A. anophagefferens IE reference sequences from the alignment used to make the tree in Fig. 2c. Insertions were filtered for having lengths of between 185 and 205 bp (typical size range of A. anophagefferens IEs) and putative TSDs of 7 to 11 bp. We expect an 8 bp TSD, but 7 bp TSDs can also be reported because of frequently erroneous 3-way alignments, which are used to estimate TSD length. Longer TSDs can also be reported because there can be longer 3-way alignments simply by chance. The 48 putative elements were manually curated by inspecting soft-clipped mapped reads, resulting in identification of 47 IEs not present in the reference genome assembly with 31 present within only one of the two alleles (Fig. 4a).
Statistical testing
For the test presented in the text, intron ends were categorized as being in either nucleosome cores or linkers. Nucleosome cores were defined by finding the 1/206th genomic positions with highest nucleosome center values12 and extending 73 bp in both directions, which is the size of a nucleosome core. Nucleosome linkers are the regions in between the core regions. The P value of M. pusilla IE intron ends in nucleosome linkers (73%) versus other intron ends in linkers (42%) was calculated using Fisher’s exact test. This includes both 5′ and 3′ intron ends together, but P values<2.2×10⁻¹⁶ were also obtained using only 5′ intron ends or only 3′ intron ends.
For testing if discrete distributions of values differ for IE introns versus other introns, the observed Kolmogorov-Smirnov statistic was compared to the statistics obtained in 105 permutations of the data labels. For both genomes, IE intron length distribution (Fig. 2a) significantly differs from that of other introns (P<10−5). For both genomes, the distribution of distances (Fig. 4c) between IE introns differs significantly from that between other introns (P<10−5 for M. pusilla; P<0.0075 for A. anophagefferens).
For testing if sequence and intron phases differ from unbiased probability (Fig. 4a) we used the multinomial test by enumeration, where possible (xmulti function from the R XNomial v1.0.4 package; https://cran.r-project.org/web/packages/XNomial/index.html), or otherwise a Monte Carlo multinomial test with 106 trials (xmonte function from the R XNomial v1.0.4). For intron phases, we tested against unbiased probability of 1/3 each. For 5′ and 3′ sequences to co-opt, we tested against the observed probabilities of any sequences in each phase, which differed only slightly from 1/3 each. Unbiased probabilities of 1/3 in each phase are shown for reference as broken lines in Fig. 4b. For each distribution, observed numbers differ significantly from being unbiased (P<2.2×10⁻¹⁶, except P<1.3×10⁻⁷ for A. anophagefferens IE introns).
For testing if expression of IE-containing genes differs from that of all genes, Mann-Whitney-Wilcoxon tests were used (Extended Data Fig. 8).
Modified dot plots for TSD and TIR characterization
We modified the dot plot method38 for pairwise comparison of the ends of each intron sequence. The matrix was altered, so that the vertical axis clearly indicates each of the relative offsets (also known as lags or phases) of one end to the other. These offsets are given relative to alignment of the 5′ and 3′ splice sites. The horizontal axis shows the positions in the pairwise comparison for each offset. The data in the matrix are given as the percentage of the set of introns, each of which has its 5′ and 3′ ends compared pairwise. Color intensity displays the percentage, either with pairwise end-sequence identity (TSD characterization, Extended Data Fig. 3) or with pairwise end-sequence complementarity (orientation of the 3′ splice site end is also reversed for TIR characterization, Extended Data Fig. 4). Identity and complementarity were called only if they are part of at least a 2-mer of identity (examples in Extended Data Fig. 3b,d) or complementarity (examples in Extended Data Fig. 4b,d), respectively. Further details of TSD and TIR identification are in the Supplementary Discussion.
Extended Data
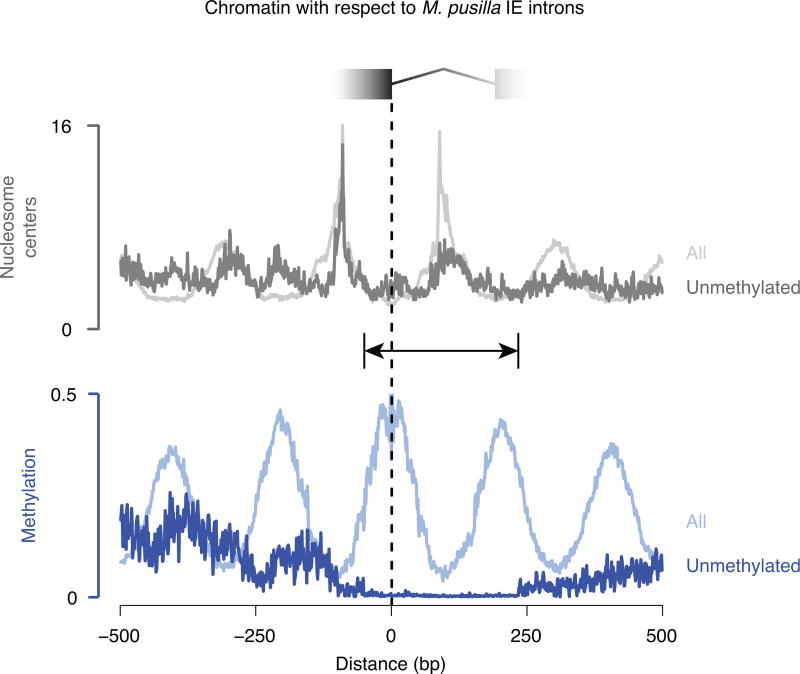
Extended Data Figure 1. M. pusilla IEs are in phase with nucleosome linker DNA, even without methylation.
Unmethylated regions (indicated by the line with arrowheads) are defined as containing no base positions with fractional methylation 0.5 or greater in a window starting from 50 bp upstream of the 5′ end of the IE intron and continuing 234 bp downstream, which is 50 bp beyond the predominant M. pusilla IE intron size of 184 bp (Fig. 2a). Mean values at each base positions are shown for chromatin maps12 aligned to the subset (7%) of IE introns residing in unmethylated regions (dark gray and dark blue for nucleosomes centers and DNA methylation, respectively), compared with alignment to all IE introns (light gray and light blue; same data as in Fig. 1b for IE introns). On the other hand, to assess if IEs could be in phase with methylated regions that are not also nucleosome linkers, we looked for IEs that had both ends in methylated DNA regions12 but not in nucleosome linkers, which gave 35 potential candidates (1% of IEs). Manual inspection revealed that 34 of the 35 apparently nonetheless have ends in nucleosome linkers, simply being missed by the filtering criteria we used for calling linkers. This leaves 1 candidate, indicating little evidence that DNA methylated regions are found at IE ends, which are not also nucleosome linkers. Taken together, unmethylated nucleosome linkers could be the primary determinant of IE insertion in at least some cases, whereas we find virtually no evidence that methylated regions could be the primary determinant of IE insertion without also being nucleosome linkers.
Extended Data Figure 2. A. anophagefferens IEs insert into preexisting nucleosome linkers.
a, IE introns are generally in phase with nucleosome positions, whereas other introns are not. DNA methylation12 was aligned to the 5′ ends of IE introns (dark blue) or other introns (light blue). We did not generate nucleosome data previously for A. anophagefferens but DNA methylation is a reliable indicator of linker locations12. b, IEs are in phase with the starts of genes, indicating insertion between preexisting nucleosomes. The 5′ ends of IE introns and DNA methylation12 were aligned to gene starts. A kernel density estimate of IE ends is displayed with peaks marked by vertical broken lines.
Extended Data Figure 3. Target site duplications (TSDs) at IE introns.
a and c, Intron sequences contain directly repeated sequences at their ends. Each A. anophagefferens (a) and M. pusilla (c) intron 5′ and 3′ end is directly aligned in each possible offset from -10 to 10 bp apart. Positions relative to the 5′ splice site from 10 bp upstream to 10 bp downstream are shown. IE introns are shown at left and other regular non-IE introns are in center, and the differences of subtracting the identity percentages of other introns from those of IE introns are at right. Each panel is separated by a vertical black line and a diagonally stepped black line to delineate different regions: the upper left region represents alignment of upstream exon versus 3′ intron end sequence; the upper right represents 5′ intron end versus 3′ intron end; the lower right represents 5′ intron end versus downstream exon; and the lower left represents upstream exon versus downstream exon. The red arrowheads at right indicate the offset with maximum average identity (0 in both cases). The red boxes in the right panels highlight the identified TSD length and position (see Supplementary Discussion). b and d, An example of an aligned 5′ (above) and 3′ (below) intron end of an IE for the offset with maximum identity is shown in (b) for A. anophagefferens and (d) for M. pusilla. Exonic sequence is uppercase and boxed; intronic is lowercase. Vertical lines show identities that are part of at least an identical 2-mer with the red lines corresponding to the boxed regions in panels a and c.
Extended Data Figure 4. Terminal inverted repeats (TIRs) in IE introns.
a and c, Intron end sequences contain inverted repeats. Each A. anophagefferens (a) and M. pusilla (c) intron 5′ and reverse of the 3′ end is aligned in each possible offset from -30 to 30 bp apart. Positions relative to the 5′ splice site from 30 bp upstream to 30 bp downstream are shown. IE introns are shown at left and other regular non-IE introns are at right. In each panel the upper left region represents upstream exon versus downstream exon sequence, the upper right represents 5′ intron end versus downstream exon, the lower right represents 5′ intron end versus 3′ intron end, and the lower left represents upstream exon versus 3′ intron end. The red arrowheads at right indicate the offset with maximum average complementarity. b and d, An example of an aligned 5′ (top) and 3′ (bottom, reversed so that it is 3′ to 5′) end of an IE intron for the offset with maximum complementarity is shown in (b) for A. anophagefferens (offset of +8) and (d) for M. pusilla (offset of -5). Exonic sequence is uppercase and boxed; intronic is lowercase. Vertical lines show complementarities that are part of at least an identical 2-mer.
Extended Data Figure 5. Intron gain templated by nucleosomes and co-opted sequences.
Model for intron generation by IEs acting as short non-autonomous DNA transposons that carry a splice site and insert between nucleosomes with co-option of the other splice site sequence.
Extended Data Figure 6. Diploid genomic sequence variation in a more recent isolate of A. anophagefferens.
a, Calling of sequence variation from genomic sequencing reads without an assumption of ploidy reveals a peak at alternate allele fraction of approximately 0.5. The most likely scenario is that this A. anophagefferens isolate has a diploid genome. It is not physically plausible for it to have higher ploidy because that amount of chromatin could not fit into its extremely compact nucleus12. b, An example reference IE is present within one allele and absent within the alternate allele. The locus is displayed as in Fig. 3a. The reference IE is located in an annotated protein-coding gene with a 200 bp RNA sequencing-validated intron in the reference isolate. The alternate allele is likely exonic without an intron (broken lines), so that it encodes the same amino acid sequence. The TSD within the reference allele is 8 bp, immediately flanking the IE TIRs. c, An example IE not found within the reference allele is present within the alternate allele. The locus is displayed as in Fig. 3a. The alternate IE is within an annotated protein-coding gene with a predicted 200 bp intron (broken lines). If the predicted intron is indeed spliced out of the RNA, then the alternate allele encodes the same amino acid sequence. The TSD within the alternate allele is 8 bp, immediately flanking the IE TIRs.
Extended Data Figure 7. Splice site sequences.
Logos for the 10 bp upstream and downstream of 5′ and 3′ splice sites for IE and other introns are shown for each organism. The rectangles show exonic positions. The core splice sites are GY (Y is C or T) and AG, respectively. IEs combined with co-opted exonic sequence that is duplicated (Fig. 3) to generate particular sequences that extend beyond the core sites (bracketed). Specifically, this results in a predominance of AG|GY sequences (“|” denotes the position of splicing that ultimately occurs) at 5′ splice sites in M. pusilla IE introns and 3′ splice sites in A. anophagefferens IE introns. Similar respective sequences are observed in other introns in each organism: G|GT for M. pusilla 5′ splice sites and AG|G for A. anophagefferens 3′ splice sites. In non-IE introns, these sequences have been under selection for long periods of time to promote RNA splicing, revealing the sequences extending beyond core sites that probably contribute to optimal splicing in each organism. The similarity of IE intron splice sites to other inton splice sites thus suggests that IEs in each organism generate new introns that are spliced reasonably well.
Extended Data Figure 8. Most IEs are located in genes expressing low to average RNA levels.
Distributions of detectable RNA levels of all transcripts (black) and only those containing at least 1 IE (green) are shown as measured by RNA sequencing. Box plots indicate the median, 1st and 3rd quartiles with whiskers extending up to data 1.5 times the interquartile range away from the box. For M. pusilla, IE-containing gene expression does not significantly differ from that of all genes, P=0.59. For A. anophagefferens, IE-containing gene expression is slightly lower than that of all genes, P=0.041.
Supplementary Material
Acknowledgments
We thank C. Guthrie’s group for discussion of splicing, J. Stabile for discussion of A. anophagefferens isolates, K. Bi for discussion of sequence variation and the Vincent J. Coates Genomics Sequencing Laboratory for sequencing. This work was supported by NIH T32HG000047 (J.T.H.) and a Beckman Young Investigator Award (D.Z.).
Footnotes
Author Contributions
J.T.H. and S.W.R. performed initial analyses. J.T.H. performed experiments and additional analyses. J.T.H., D.Z. and S.W.R. designed the project, interpreted data and wrote the manuscript.
Author Information
The A. anophagefferens IE tree is available at TreeBASE (Study 18167). Newly sequenced A. anophagefferens data are available at GEO (GSEXXXXXX). The authors declare no competing financial interests.
References
- 1.Gilbert W. Why genes in pieces? Nature. 1978;271:501. doi: 10.1038/271501a0. [DOI] [PubMed] [Google Scholar]
- 2.Rogozin IB, Carmel L, Csuros M, Koonin EV. Origin and evolution of spliceosomal introns. Biol. Direct. 2012;7:11. doi: 10.1186/1745-6150-7-11. [DOI] [PMC free article] [PubMed] [Google Scholar]
- 3.Irimia M, Roy SW. Origin of spliceosomal introns and alternative splicing. Cold Spring Harb. Perspect. Biol. 2014;6:a016071. doi: 10.1101/cshperspect.a016071. [DOI] [PMC free article] [PubMed] [Google Scholar]
- 4.Cavalier-Smith T. Selfish DNA and the origin of introns. Nature. 1985;315:283–284. doi: 10.1038/315283b0. [DOI] [PubMed] [Google Scholar]
- 5.Purugganan M, Wessler S. The splicing of transposable elements and its role in intron evolution. Genetica. 1992;86:295–303. doi: 10.1007/BF00133728. [DOI] [PubMed] [Google Scholar]
- 6.Wang W, Yu H, Long M. Duplication-degeneration as a mechanism of gene fission and the origin of new genes in Drosophila species. Nat. Genet. 2004;36:523–527. doi: 10.1038/ng1338. [DOI] [PubMed] [Google Scholar]
- 7.Li W, Tucker AE, Sung W, Thomas WK, Lynch M. Extensive, recent intron gains in Daphnia populations. Science. 2009;326:1260–1262. doi: 10.1126/science.1179302. [DOI] [PMC free article] [PubMed] [Google Scholar]
- 8.Yenerall P, Zhou L. Identifying the mechanisms of intron gain: progress and trends. Biol. Direct. 2012;7:29. doi: 10.1186/1745-6150-7-29. [DOI] [PMC free article] [PubMed] [Google Scholar]
- 9.Schwartz S, Meshorer E, Ast G. Chromatin organization marks exon-intron structure. Nat. Struct. Mol. Biol. 2009;16:990–995. doi: 10.1038/nsmb.1659. [DOI] [PubMed] [Google Scholar]
- 10.Worden AZ, et al. Green evolution and dynamic adaptations revealed by genomes of the marine picoeukaryotes Micromonas. Science. 2009;324:268–272. doi: 10.1126/science.1167222. [DOI] [PubMed] [Google Scholar]
- 11.Verhelst B, Van de Peer Y, Rouzé P. The complex intron landscape and massive intron invasion in a picoeukaryote provides insights into intron evolution. Genome Biol. Evol. 2013;5:2393–2401. doi: 10.1093/gbe/evt189. [DOI] [PMC free article] [PubMed] [Google Scholar]
- 12.Huff JT, Zilberman D. Dnmt1-independent CG methylation contributes to nucleosome positioning in diverse eukaryotes. Cell. 2014;156:1286–1297. doi: 10.1016/j.cell.2014.01.029. [DOI] [PMC free article] [PubMed] [Google Scholar]
- 13.Gobler CJ, et al. Niche of harmful alga Aureococcus anophagefferens revealed through ecogenomics. Proc. Natl. Acad. Sci. U. S. A. 2011;108:4352–4357. doi: 10.1073/pnas.1016106108. [DOI] [PMC free article] [PubMed] [Google Scholar]
- 14.van der Burgt A, Severing E, de Wit PJGM, Collemare J. Birth of new spliceosomal introns in fungi by multiplication of introner-like elements. Curr. Biol. CB. 2012;22:1260–1265. doi: 10.1016/j.cub.2012.05.011. [DOI] [PubMed] [Google Scholar]
- 15.Simmons MP, et al. Intron invasions trace algal speciation and reveal nearly identical Arctic and Antarctic Micromonas populations. Mol. Biol. Evol. 2015;32:2219–2235. doi: 10.1093/molbev/msv122. [DOI] [PMC free article] [PubMed] [Google Scholar]
- 16.Lambowitz AM, Zimmerly S. Group II introns: mobile ribozymes that invade DNA. Cold Spring Harb. Perspect. Biol. 2011;3:a003616. doi: 10.1101/cshperspect.a003616. [DOI] [PMC free article] [PubMed] [Google Scholar]
- 17.Calos MP, Johnsrud L, Miller JH. DNA sequence at the integration sites of the insertion element IS1. Cell. 1978;13:411–418. doi: 10.1016/0092-8674(78)90315-x. [DOI] [PubMed] [Google Scholar]
- 18.Grindley NDF. IS1 insertion generates duplication of a nine base pair sequence at its target site. Cell. 1978;13:419–426. doi: 10.1016/0092-8674(78)90316-1. [DOI] [PubMed] [Google Scholar]
- 19.Wessler SR, Bureau TE, White SE. LTR-retrotransposons and MITEs: important players in the evolution of plant genomes. Curr. Opin. Genet. Dev. 1995;5:814–821. doi: 10.1016/0959-437x(95)80016-x. [DOI] [PubMed] [Google Scholar]
- 20.van Baren MJ, et al. Evidence-based green algal genomics reveals marine diversity and ancestral characteristics of land plants. BMC Genomics. 2016;17:267. doi: 10.1186/s12864-016-2585-6. [DOI] [PMC free article] [PubMed] [Google Scholar]
- 21.Gangadharan S, Mularoni L, Fain-Thornton J, Wheelan SJ, Craig NL. DNA transposon Hermes inserts into DNA in nucleosome-free regions in vivo. Proc. Natl. Acad. Sci. U. S. A. 2010;107:21966–21972. doi: 10.1073/pnas.1016382107. [DOI] [PMC free article] [PubMed] [Google Scholar]
- 22.Buenrostro JD, Giresi PG, Zaba LC, Chang HY, Greenleaf WJ. Transposition of native chromatin for fast and sensitive epigenomic profiling of open chromatin, DNA-binding proteins and nucleosome position. Nat. Methods. 2013;10:1213–1218. doi: 10.1038/nmeth.2688. [DOI] [PMC free article] [PubMed] [Google Scholar]
- 23.Parfrey LW, Lahr DJG, Knoll AH, Katz LA. Estimating the timing of early eukaryotic diversification with multigene molecular clocks. Proc. Natl. Acad. Sci. U. S. A. 2011;108:13624–13629. doi: 10.1073/pnas.1110633108. [DOI] [PMC free article] [PubMed] [Google Scholar]
- 24.Feschotte C, Pritham EJ. DNA transposons and the evolution of eukaryotic genomes. Annu. Rev. Genet. 2007;41:331–368. doi: 10.1146/annurev.genet.40.110405.090448. [DOI] [PMC free article] [PubMed] [Google Scholar]
- 25.Qu G, et al. RNA–RNA interactions and pre-mRNA mislocalization as drivers of group II intron loss from nuclear genomes. Proc. Natl. Acad. Sci. U. S. A. 2014;111:6612–6617. doi: 10.1073/pnas.1404276111. [DOI] [PMC free article] [PubMed] [Google Scholar]
- 26.Kim D, et al. TopHat2: accurate alignment of transcriptomes in the presence of insertions, deletions and gene fusions. Genome Biol. 2013;14:R36. doi: 10.1186/gb-2013-14-4-r36. [DOI] [PMC free article] [PubMed] [Google Scholar]
- 27.Roberts A, Trapnell C, Donaghey J, Rinn JL, Pachter L. Improving RNA-Seq expression estimates by correcting for fragment bias. Genome Biol. 2011;12:R22. doi: 10.1186/gb-2011-12-3-r22. [DOI] [PMC free article] [PubMed] [Google Scholar]
- 28.Crooks GE, Hon G, Chandonia J-M, Brenner SE. WebLogo: a sequence logo generator. Genome Res. 2004;14:1188–1190. doi: 10.1101/gr.849004. [DOI] [PMC free article] [PubMed] [Google Scholar]
- 29.Altschul SF, Gish W, Miller W, Myers EW, Lipman DJ. Basic local alignment search tool. J. Mol. Biol. 1990;215:403–410. doi: 10.1016/S0022-2836(05)80360-2. [DOI] [PubMed] [Google Scholar]
- 30.Katoh K, Standley DM. MAFFT multiple sequence alignment software version 7: improvements in performance and usability. Mol. Biol. Evol. 2013;30:772–780. doi: 10.1093/molbev/mst010. [DOI] [PMC free article] [PubMed] [Google Scholar]
- 31.Nei M, Kumar S. Molecular Evolution and Phylogenetics. Oxford University Press; 2000. [Google Scholar]
- 32.Tamura K, Stecher G, Peterson D, Filipski A, Kumar S. MEGA6: Molecular Evolutionary Genetics Analysis version 6.0. Mol. Biol. Evol. 2013;30:2725–2729. doi: 10.1093/molbev/mst197. [DOI] [PMC free article] [PubMed] [Google Scholar]
- 33.Li H. Aligning sequence reads, clone sequences and assembly contigs with BWA-MEM. ArXiv13033997 Q-Bio. 2013 [Google Scholar]
- 34.Garrison E, Marth G. Haplotype-based variant detection from short-read sequencing. ArXiv12073907 Q-Bio. 2012 [Google Scholar]
- 35.Fiston-Lavier A-S, Barrón MG, Petrov DA, González J. T-lex2: genotyping, frequency estimation and re-annotation of transposable elements using single or pooled next-generation sequencing data. Nucleic Acids Res. 2015;43:e22–e22. doi: 10.1093/nar/gku1250. [DOI] [PMC free article] [PubMed] [Google Scholar]
- 36.Keane TM, Wong K, Adams DJ. RetroSeq: transposable element discovery from next-generation sequencing data. Bioinformatics. 2013;29:389–390. doi: 10.1093/bioinformatics/bts697. [DOI] [PMC free article] [PubMed] [Google Scholar]
- 37.Wildschutte JH, Baron A, Diroff NM, Kidd JM. Discovery and characterization of Alu repeat sequences via precise local read assembly. Nucleic Acids Res. 2015;43:10292–10307. doi: 10.1093/nar/gkv1089. [DOI] [PMC free article] [PubMed] [Google Scholar]
- 38.Gibbs AJ, Mcintyre GA. The diagram, a method for comparing sequences. Eur. J. Biochem. 1970;16:1–11. doi: 10.1111/j.1432-1033.1970.tb01046.x. [DOI] [PubMed] [Google Scholar]
Associated Data
This section collects any data citations, data availability statements, or supplementary materials included in this article.


