

Abstract
Nociceptin/orphanin FQ (N/OFQ) regulates several biological functions via selective activation of the N/OFQ receptor (NOP), a member of the opioid receptor family. We recently identified a new high affinity and highly selective NOP agonist AT‐403. In this study, we characterized the functional profile of AT‐403 and compared it to other known nonpeptide NOP agonists Ro 65‐6570, Ro 2q, SCH‐221510, MCOPPB, AT‐202 and SCH‐486757, using the following assays: GTP γ[35S] stimulated binding, calcium mobilization assay in cells‐expressing human NOP or classical opioid receptors and chimeric G proteins, bioluminescence resonance energy transfer (BRET) based assay for studying NOP receptor interaction with G protein and arrestin, and the electrically stimulated mouse vas deferens bioassay. All compounds behaved as NOP full agonists consistently showing the following rank order of potency MCOPPB > AT‐403 > Ro 65‐6570 = Ro 2q > SCH‐221510 > AT‐202 > SCH‐486757. AT‐403 and MCOPPB displayed the highest NOP selectivity both at human and murine receptors. Interestingly, while all the other nonpeptide NOP agonists displayed bias toward G protein‐mediated signaling in the BRET assay, AT‐403, similar to the natural ligand N/OFQ, behaved as an unbiased agonist, activating G‐protein‐mediated function as well as arrestin recruitment. AT‐403 may be a useful nonpeptide tool compound to study the pharmacology of NOP activation in disease states.
Keywords: BRET arrestin assay, functional selectivity, GPCR signaling bias, ligand bias, nonpeptide NOP agonists, NOP receptor
Abbreviations
- BRET
bioluminescence resonance energy transfer
- N/OFQ
nociceptin/orphanin FQ
- NOP
N/OFQ peptide receptor
- FIU
fluorescence intensity unit
- GPCR
G‐protein coupled receptor
Introduction
Nociceptin/orphanin FQ (N/OFQ) is the endogenous ligand of the N/OFQ peptide receptor (NOP) the fourth member of the opioid receptor family. Despite close similarities in structure and signaling mechanisms, the pharmacological profile of the NOP receptor is distinct from that of classical opioid receptors (Lambert 2008; Toll et al. 2016). The N/OFQ–NOP receptor system controls several biological functions including pain transmission, emotional states, motor behavior, memory and learning, drug abuse, cough and micturition reflexes and activities of the cardiovascular, respiratory, gastrointestinal and immune systems (Lambert 2008; Toll et al. 2016). Several NOP receptor ligands have been identified and characterized by academic and industrial laboratories (Mustazza and Bastanzio 2011; Zaveri 2016). Selective NOP antagonists have been investigated as antidepressants (Gavioli and Calo 2013; Post et al. 2016) and for Parkinson's disease treatment (Marti et al. 2004, 2010) whereas selective nonpeptide NOP agonists have shown significant efficacy for the treatment of anxiety (Gavioli and Calo 2006) and pain (Schroder et al. 2014; Toll et al. 2016).
The NOP receptor, like the other members of the opioid receptor family, is also a G‐protein‐coupled receptor (GPCR) that, via coupling to the Gi protein, inhibits adenyl cyclase and cAMP production. It is now widely accepted that GPCRs mediate their physiological effects not just through coupling with G proteins, but also through non‐G protein‐mediated mechanisms, e.g. through arrestins. Moreover, some synthetic ligands display the ability to stimulate one signaling pathway to a greater extent than another thus leading to ‘functional selectivity’ or ‘biased agonism”. Indeed, re‐evaluation of pharmacological actions of several classes of GPCR‐targeted drugs based on this still‐evolving functional classification has led to new understanding of clinical profiles of drugs like the beta‐blockers (Thanawala et al. 2014) and antihistaminergic drugs (Nijmeijer et al. 2012). Elucidating the ‘signaling profiles’ of GPCR ligands previously only classified as agonists, antagonists, inverse agonists and partial agonists provides an opportunity to relate ligand bias profiles to observed biological responses and develop a new understanding of GPCR function.
Several small‐molecule, nonpeptide NOP agonists have been reported and investigated for efficacy in vivo as anxiolytics, anti‐tussives, and as analgesics (Zaveri 2016). Several of these, e.g. SCH‐221510, Ro 65‐6570, Ro 64‐6198 have been extensively characterized in vitro and are used as tool compounds to investigate NOP agonist pharmacology. Some of these available NOP agonists have recently been characterized for ‘functional selectivity’ in vitro in G protein‐mediated function versus non‐G‐protein‐mediated (i.e. arrestin) recruitment by us (Malfacini et al. 2015) and others (Chang et al. 2015). NOP agonists SCH‐221510, Ro 65‐6570, and Ro 64‐6198 were found to demonstrate ‘bias’ towards G protein function over arrestin recruitment, in comparison with the endogenous NOP agonist N/OFQ (Malfacini et al. 2015). Whether this differential profile of functional selectivity of the reported nonpeptide NOP agonists versus the natural agonist N/OFQ is of pharmacological significance is not known at this time since no unbiased NOP agonists have been reported thus far.
We recently discovered the compound AT‐403 belonging to a chemically distinct class of NOP ligands (Fig. 1). In primary screening assays AT‐403 demonstrated high‐affinity, efficacy, potency, and NOP selectivity. The aim of this study was to perform a detailed characterization of the signaling and pharmacological profile of AT‐403 and compare it to that of available NOP nonpeptide agonists such as Ro 65‐6570, Ro 2q, SCH‐221510, MCOPPB, AT‐202 and SCH‐486757 (see chemical structures in Fig. 1). The available NOP agonists used for comparison have been previously described in the literature as NOP selective agonists and evaluated in vivo for their anxiolytic‐like effects (Ro 65‐6570 (Wichmann et al. 1999), SCH‐221510 (Varty et al. 2008), MCOPPB (Hirao et al. 2008)), antitussive (SCH‐486757 (Woodcock et al. 2010)) or antinociceptive (AT‐202 [previously named SR16835] (Toll et al. 2009)) actions. To the best of our knowledge Ro 2q has not been tested in vivo. These NOP ligands were investigated and compared in vitro in a panel of biochemical assays of downstream signal transduction as well as in the ex vivo mouse vas deferens assay. The following assays were used: GTPγ[35S]‐binding assay performed in membranes of cells expressing the human NOP receptor, calcium mobilization assay performed in cells coexpressing the human NOP or classical opioid receptors and chimeric G proteins, bioluminescence resonance energy transfer (BRET) based assay for studying NOP receptor interaction with G protein and arrestin and the electrically stimulated vas deferens bioassay performed with tissues taken from wild type (NOP+/+) and NOP knockout (NOP−/−) mice. N/OFQ and the NOP selective antagonist SB‐612111 (Zaratin et al. 2004) were used as standard NOP ligands. This detailed characterization revealed a potentially useful nonpeptide NOP agonist AT‐403, which displays a profile of unbiased signaling function similar to the natural agonist N/OFQ, unlike the other nonpeptide NOP agonist tool compounds used thus far in the literature. The functional characterization of AT‐403 is detailed in this study.
Figure 1.

Chemical structures of the AT‐403 and other non‐peptide NOP agonists characterized in the present study.
Materials and Methods
Drugs and reagents
MCOPPB and U‐69593 were purchased from Sigma‐Aldrich (Schnelldorf, Germany). SCH‐221510, SNC‐80 and SB‐612111 were purchased from Tocris (Bristol, UK). Fentanyl was from SALARS (Como, Italy). N/OFQ, Ro 65‐6570 and Ro 2q, were synthesized in the Department of Chemical and Pharmaceutical Sciences of the University of Ferrara, Italy. AT‐403 and AT‐202 (Journigan et al. 2014) were synthesized at Astraea Therapeutics (Mountain view, CA). SCH‐486757 was synthesized at Chiesi (Parma, Italy). Stock solution of N/OFQ, and fentanyl were made in bidistilled water (1 mmol/L), those of MCOPPB, Ro 65‐6570, Ro 2q, SCH‐221510, SNC‐80, U‐69593, SCH‐486757 and SB‐612111 in DMSO (10 mmol/L), those of AT‐403 and AT‐202 in 30% HP‐cyclodextrin in water (10 mmol/L) and stored at −20°C.
All cell culture media and supplements were from Invitrogen (Paisley, UK) or EuroClone (Milano, Italy). All other reagents were from Sigma Chemical Co. (Poole, UK) and were of the highest purity available. Native coelenterazine (CLZN, 5 mmol/L, EtOH) was from Synchem UG & Co. KG (Altenburg, Germany).
GTPγ[35S]‐binding assay
Chinese Hamster Ovary (CHO) cells stably expressing the human NOP receptor were grown DMEM/Hams F12 1:1. The media contained streptomycin (100 μg/mL), fungizone (2.5 μg/mL), penicillin (100 IU/mL) and 10% fetal bovine serum. Stock media containing G418 (200 μg/mL) and hygromycin B (200 μg/mL) was used to maintain CHONOP expression. Cells were kept at 37°C in 5% CO2/humidified air and used for experiments once confluent. Homogenization/wash buffer consisting 50 mmol/L Tris and 0.2 mmol/L EGTA pH 7.4 with NaOH for CHONOP was used. Membranes were centrifuged at 20,374g for 10 min at 4°C. This process was repeated at least three times. The resulting pellet was resuspended in an appropriate amount of the buffer and the protein concentration was determined by Lowry et al. (1951). Membrane protein (40 μg) was incubated in 0.5 mL volume of 50 mmol/L Tris, 0.2 mmol/L EGTA, 1 mmol/L MgCl2, 100 mmol/L NaCl, 0.1% BSA, 0.15 mmol/L bacitracin; pH 7.4, GDP (33 μmol/L), and ~150 pM GTPγ[35S]. Varying concentrations of reference ligand (N/OFQ) or nonpeptide NOP ligands (1 pM–10 μmol/L) were added prior to incubation. Non‐specific binding was determined in the presence of unlabeled GTPγS (10 μmol/L). Samples were incubated at 30°C for 1 h with gentle agitation. Reactions were terminated by vacuum filtration through dry Whatman GF/B filters, using a Brandel harvester. Radioactivity was determined following an 8 h extraction of filters in ScintiSafe Gel using liquid scintillation spectroscopy (Bird et al. 2016).
Calcium mobilization assay
CHO cells stably coexpressing the human NOP, or kappa, or mu opioid receptors and the C‐terminally modified Gα qi5 and CHO cells coexpressing the delta opioid receptor and the Gα qG66Di5 protein were generated as previously described (Camarda et al. 2009; Camarda and Calo 2013). Cells were maintained in culture medium consisting of Dulbecco's MEM/HAM'S F‐12 (50/50) supplemented with 10% fetal bovine serum, penicillin (100 IU/mL), streptomycin (100 μg/mL), l‐glutammine (2 mmol/L), fungizone (1 μg/mL), geneticin (G418; 200 μg/mL) and hygromycin B (100 μg/mL). Cell cultures were kept at 37°C in 5% CO2 humidified air. When confluence was reached (3–4 days), cells were sub‐cultured as required using trypsin/EDTA and used for testing. Cells were seeded at a density of 50,000 cells/well into 96‐well black, clear‐bottom plates. After 24 h incubation the cells were loaded with medium supplemented with 2.5 mmol/L probenecid, 3 μmol/L of the calcium‐sensitive fluorescent dye Fluo‐4 AM and 0.01% pluronic acid, for 30 min at 37°C. Afterwards the loading solution was aspirated and a washing step with 100 μL/well of Hank's Balanced Salt Solution (HBSS), HEPES (20 mmol/L, pH 7.4), 2.5 mmol/L probenecid and 500 μmol/L Brilliant Black (Aldrich) was carried out. Subsequently 100 μL/well of the same buffer was added. Serial dilutions of stock solutions of ligands for experimental use were made in HBSS/HEPES (20 mmol/L) buffer (containing 0.03% of bovine serum albumin, BSA, Sigma Chemical Co., Poole). After placing both plates (cell culture and compound plate) into the FlexStation II (Molecular Device, Union City, CA), fluorescence changes were measured after 10 min of stabilization. On‐line additions were carried out in a volume of 50 μL/well. In antagonism‐type experiments the antagonists were injected in the well 24 min before adding the agonist and, to facilitate drug diffusion into the wells, the experiments were performed at 37°C and three cycles of mixing (25 μL from each well moved up and down 3 times) were performed immediately after antagonist injection.
BRET assay
Human Embryonic Kidney (HEK293) cells were grown in Dulbecco's modified Eagle's medium supplemented with 10% fetal bovine serum, penicillin G (100 units/mL), streptomycin (100 μg/mL), l‐glutamine (2 mmol/L), fungizone (1 μg/mL), geneticin (G418; 200 μg/mL) and hygromycin B (100 μg/mL) in a humidified atmosphere of 5% CO2 at 37°C. Cell lines permanently co‐expressing the different pairs of fusion proteins (NOP‐RLuc/Gβ1‐RGFP and NOP‐RLuc/β‐arrestin 2‐RGFP) were prepared, using the pantropic retroviral expression system by Clontech as described previously (Malfacini et al. 2015). For G‐protein experiments enriched plasma membrane aliquots from transfected cells were prepared by differential centrifugation; cells were detached with PBS/EDTA solution (1 mmol/L, pH 7.4 NaOH) then, after 5 min 500 g centrifugation, Dounce‐homogenized (30 strokes) in cold (4°C) homogenization buffer (TRIS 5 mmol/L, EGTA 1 mmol/L, DTT 1 mmol/L, pH 7.4 HCl) in the presence of sucrose (0.32 mol/L). Three following centrifugations were performed at 10 min 1000g (4°C) and the supernatants kept. Two 20 min 24,000g (4°C) subsequent centrifugations (the second in the absence of sucrose) were performed for separating enriched membranes that after discarding the supernatant were kept in ultrapure water at −80°C (Vachon et al. 1987). The protein concentration in membrane preparations was determined using the QPRO‐BCA kit (Cyanagen Srl, Bologna, IT) and the spectrophotometer Beckman DU 520 (Brea, CA).
Luminescence in membranes was recorded in 96‐well untreated white opaque microplates, while in whole cells was recorded in 96‐well sterile poly‐D‐lysine‐coated white opaque microplates (PerkinElmer, Waltham, MA) using the luminometer Victor 2030 (PerkinElmer, Waltham, MA). For the determination of NOP/G‐protein interaction, membranes (3 μg of protein) prepared from cells co‐expressing NOP/RLuc and Gβ1/RGFP were added to wells in DPBS. For the determination of NOP/β‐arrestin 2 interaction, cells co‐expressing NOP/RLuc and β‐arrestin 2/RGFP were plated 24 h before the experiment in poly‐d‐lysine‐treated plates (100,000 cells/well). The cells were prepared for the experiment substituting the medium with PBS with MgCl2 (0.5 mmol/L) and CaCl2 (0.9 mmol/L). Coelenterazine at a final concentration of 5 μmol/L was injected 15 min prior reading the cell plate. Different concentrations of ligands in 20 μL of PBS ‐ BSA 0.01% were added and incubated 5 min before reading luminescence. All the experiments were performed at room temperature.
Electrically stimulated mouse vas deferens
All animal care and experimental procedures conformed to the standards of the European Communities Council directives (2010/63/EU) and national regulations (D.L. 26/2014). Studies involving animals are reported in accordance with the ARRIVE guidelines (Kilkenny et al. 2010). This study was approved by the Ethical Committee for the Use of Laboratory Animals (CEASA) of the University of Ferrara and by the Italian Ministry of Health (authorization number 9927, 19/04/2013). The experiments were performed on the mouse vas deferens. The tissues were taken from male CD‐1 mice (16–18 g, Harlan, Ud, Italy) and from NOP(+/+) and NOP(−/−) mice (16–18 g). Details about the generation of mutant mice have been published previously (Nishi et al. 1997; Bertorelli et al. 2002). NOP(+/+) and NOP(−/−) mice have been backcrossed on CD‐1 strain in our laboratories. Mice were housed in 425 × 266 × 155 mm cages (Techniplast, Mi, Italy), 8 per cage, all under standard conditions (22°C, 55% humidity, 12 h light/dark cycle, light on at 7:00 am), with food for mice (4RF, Mucedola, Mi, Italy) and water ad libitum. A mouse red house (Techniplast, Va, Italy) and nesting materials were present in each cage for mice.
The day of the experiment the animals were sacrificed with CO2 overdose. Bioassay experiments were performed as previously described (Calo et al. 1996). The tissues were suspended in 5 mL organ bath containing Krebs solution (composition in mmol/L: NaCl 118.5, KCl 4.7, KH2PO4 1.2, NaHCO3 25, CaCl2 2.5, glucose 10). The Krebs solution was oxygenated with 95% O2 and 5% CO2. The temperature was set at 33°C and a resting tension 0.3 g was applied to the tissues. Tissues were stimulated through two platinum electrodes with supramaximal rectangular pulse of 1 msec duration, 0.05 Hz frequency, 80 V of amplitude. The electrically evoked contractions were measured isotonically by means of Basile strain gauge transducers (Basile 7006; srl Ugo Basile, Varese, Italy) and recorder with a computer – based acquisition system (Power Lab 8, ADInstruments, Colorado Springs). After an equilibration period of about 60 min, the contractions induced by electrical field stimulation were stable. At this time, cumulative concentration response curve to agonists were performed (0.5 log unit steps). The buffer for dilutions of the compounds is Krebs or saline solution. A total number of 62 mice were used for the present in vitro studies.
Data analysis and terminology
The pharmacological terminology adopted in this paper is consistent with IUPHAR recommendations (Neubig et al. 2003). All data are expressed as the mean ± standard error of the mean (SEM.) of at least 4 experiments. For potency and bias factor values 95% confidence limits (CL95%) were indicated. Ligand efficacy was expressed as E max, the agonist maximal effect. GTPγ[35S] data are expressed as stimulation factor that is the ratio between specific agonist stimulated GTPγ[35S] binding and basal‐specific binding. In calcium mobilization experiments, maximum change in fluorescence, expressed as % over the baseline fluorescence (fluorescence intensity unit, FIU), was used to determine agonist response. BRET data are expressed as ratio between CPS measured for the RGFP and RLuc light emitted using 510(10) and 460(25)filters (PerkinElmer, Waltham, MA), respectively. Maximal agonist effects were expressed as fraction of the N/OFQ maximal effects which was determined in every assay plate. Bioassay data are expressed as % of the control twitch induced by electrical field stimulation. In Table 1 ligand efficacy was expressed as intrinsic activity (α) calculated as the ratio between the E max of the ligand and that of the standard agonist N/OFQ. Agonist potencies are given as pEC50 that is, the negative logarithm to base 10 of the molar concentration of an agonist that produces 50% of the maximal effect of that agonist. Concentration‐response curves to agonists were fitted to the classical four‐parameter logistic nonlinear regression model:
Table 1.
Summary of the pharmacological profile of nonpeptide NOP agonists in comparison with N/OFQ
| GTPγ[35S] | Calcium mobilization | Bioluminescence resonance energy transfer | Mouse Vas Deferens | ||||||||||
|---|---|---|---|---|---|---|---|---|---|---|---|---|---|
| G protein | β‐arrestin 2 | ||||||||||||
| CR | α | CR | α | Selectivity (NOP vs OP) | CR | α | CR | α | Bias factor | CR | α | Selectivity(+/+ vs. −/−) | |
| N/OFQ | 1 | 1.00 | 1 | 1.00 | >10000 | 1 | 1.00 | 1 | 1.00 | 0.00 | 1 | 1.00 | >100 |
| Ro 65‐6570 | 12 | 1.11 | 14 | 0.98 | 270 | 16 | 0.96 | 65 | 0.74 | 1.64 | 4 | >1 | 7 |
| Ro 2q | 14 | 0.88 | 10 | 0.99 | 100 | 28 | 0.93 | 63 | 0.43 | 0.93 | 1.70 | >1 | 3 |
| SCH‐221510 | 13 | 1.04 | 36 | 0.94 | 60 | 36 | 1.10 | 55 | 0.84 | 1.10 | 11 | >1 | 2 |
| MCOPPB | 0.30 | 1.19 | 0.52 | 1.03 | 1500 | 0.53 | 1.04 | 1 | 0.99 | 0.97 | 0.71 | >1 | 14 |
| AT‐403 | 1.20 | 0.91 | 1 | 0.96 | 1500 | 4 | 0.94 | 5 | 0.79 | 0.16 | 0.40 | >1 | 30 |
| AT‐202 | 48 | 0.95 | 120 | 1.01 | 250 | 90 | 0.96 | 105 | 0.89 | 0.46 | 6 | >1 | 9 |
| SCH‐486757 | 155 | 1.12 | 380 | 0.99 | 80 | 135 | 0.82 | 178 | 0.36 | 0.81 | ‐ | ||
Agonist efficacy is expressed as intrinsic activity (α) calculated as the ratio between the E max of the ligand and that of the standard agonist N/OFQ.
Agonist potency is expressed as concentration ratio (CR) calculated as the ratio between the EC50 of the ligand and that of the standard agonist N/OFQ.
EC50 is the concentration of agonist producing a 50% maximal response. Curves fitting were performed using PRISM 6.0 (GraphPad Software In., San Diego). In Table 1 ligand potency is expressed as concentration ratio (CR) calculated as the ratio between the EC50 of the ligand and that of the standard agonist N/OFQ.
Antagonist potencies were derived from Gaddum Schild equation:
assuming a slope value equal to unity, where CR indicates the ratio between agonist potency in the presence and absence of antagonist (Kenakin 2004).
Bias factors were calculated by choosing N/OFQ as standard unbiased ligand.
The concentration response curves of each compound were fitted to the Black–‐Leff operational model described by (Nagi and Pineyro 2016):
where [A] is the agonist concentration, the maximal response of the system is given by E m, n is a fitting parameter for the slope, the affinity of the agonist is represented by the equilibrium dissociation constant of the agonist‐receptor complex (K A), and the efficacy of the agonist is defined by τ. τ and K A are descriptive parameters of intrinsic efficacy and binding affinity and may be directly obtained by fitting experimental data to the operational equation and can be expressed as “transduction coefficients” log(τ/K A). The relative efficiency of agonists producing activation of any pathways can thus be quantified with a “normalized” transduction coefficient, namely Δlog(τ/K A). Finally, the bias factors were calculated as difference between Δlog(τ/K A) values for a given agonist between the pathways (G protein and β‐arrestin 2):
Bioassay data have been statistically analyzed with Student's t test for paired samples; P < 0.05 were considered statistically significant. Bias factors calculated using N/OFQ as reference agonist were considered statistically significant when their confidence limits 95% did not include 0.
Results
GTPγ[35S]‐binding assay
In CHONOP membranes, the natural ligand N/OFQ stimulated the binding GTPγ[35S] in a concentration‐dependent manner with high potency (pEC50 9.54 [9.36–9.72]; Fig. 2). The nonpeptide NOP agonists mimicked the stimulatory action of N/OFQ, showing similar maximal effects (α in the range: 0.88–1.19). The two Roche compounds and SCH‐221510 were approximately 10 fold less potent than N/OFQ (Fig. 2A). AT‐202 and SCH‐486757 were approximately 50 and 150 fold less potent than N/OFQ (Fig. 2B), whereas MCOPPB was threefold more potent than N/OFQ (Fig. 2A). AT‐403 displayed similar potency as N/OFQ (Fig. 2B). Details of potency and efficacy of ligands in these experiments are given in Table S1.
Figure 2.

GTPγ[35S]‐binding experiments. Concentration response curves to N/OFQ, Ro 65‐6570, Ro 2q, SCH‐221510 and MCOPPB (panel A), and to N/OFQ, AT‐403, AT‐202 and SCH‐486757 (panel B) in membranes of CHONOP cells. Data are the mean ± SEM of 6 separate experiments.
Calcium mobilization assay
In CHONOP cells‐expressing chimeric G proteins, the natural NOP ligand N/OFQ increased the intracellular calcium levels with high potency (pEC50 9.92 [9.51–10.32]) in a concentration‐dependent manner. AT‐403 showed similar potency as N/OFQ while AT‐202 and SCH‐486757 were more than 100‐fold less potent (Fig. 3B). Ro 65‐6570, Ro 2q, and SCH‐221510 were 10–30 fold less potent than N/OFQ whereas MCOPPB was slightly more potent than N/OFQ in this assay (Fig. 3A). Details of potency and efficacy of ligands in these experiments are given in Table S2.
Figure 3.
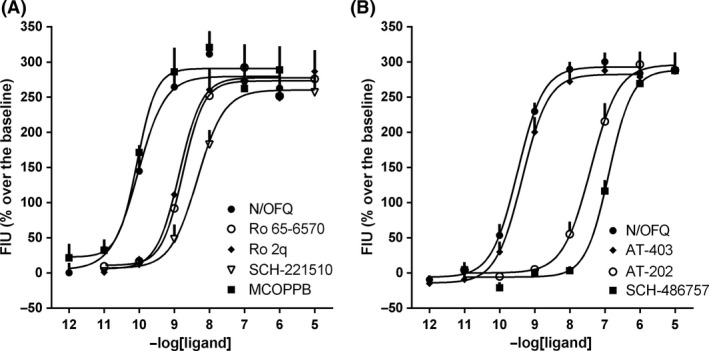
Calcium mobilization assay performed in Chinese Hamster Ovary cells expressing the NOP receptor and the chimeric Gα qi5 protein. Concentration response curves to N/OFQ, Ro 65‐6570, Ro 2q, SCH‐221510 and MCOPPB (panel A) and to N/OFQ, AT‐403, AT‐202 and SCH‐486757 (panel B). Data are expressed as mean ± SEM. of at least 4 separate experiments made in duplicate.
The effects of N/OFQ and of the seven NOP agonists were challenged with the selective NOP antagonist SB‐612111 in order to investigate the involvement of the NOP receptor in their action. As shown in Figure 4A, 100 nmol/L SB‐612111 was able to shift rightward the concentration response curve to N/OFQ without modifying the agonist maximal effects. A pA2 of 8.91 (8.58–9.25) for SB‐612111 was obtained from these experiments. Similar results were obtained when the antagonist was tested against the Roche agonists, SCH‐221510 and MCOPPB (pA2 in the range: 8.99–9.29; Fig. 4).
Figure 4.

Calcium mobilization assay performed in Chinese Hamster Ovary cells expressing the NOP receptor and the chimeric Gα qi5 protein. Concentration response curves to N/OFQ (panel A), Ro 65‐6570 (panel B), Ro 2q (panel C), SCH‐221510 (panel D) and MCOPPB (panel E) in absence (control) and in presence of SB‐612111 100 nmol/L. Data are expressed as mean ± SEM. of at least 4 separate experiments made in duplicate.
In a separate series of experiments 100 nmol/L SB‐612111 was used to challenge the effects of N/OFQ, SCH‐486757 and the AT compounds. Similar values of pA2 were obtained for SB‐612111 against the natural peptide (pA2 8.45), AT‐403 (pA2 8.73) and AT‐202 (pA2 8.54; Fig. 5). However, SCH‐486757 was able to elicit a weakly stimulatory response in the presence of SB‐612111 only at the highest concentration tested (Fig. 5D). Therefore, it was not possible to estimate the pA2 value of SB‐612111 against this agonist.
Figure 5.

Calcium mobilization assay performed in Chinese Hamster Ovary cells expressing the NOP receptor and the chimeric Gα qi5 protein. Concentration response curves to N/OFQ (panel A), AT‐403 (panel B), AT‐202 (panel C) and SCH‐486757 (panel D) in absence (control) and in presence of SB‐612111 100 nmol/L. Data are expressed as mean ± SEM. of at least 4 separate experiments made in duplicate.
The NOP selectivity of the compounds over classical opioid receptors was assessed using CHO cells coexpressing classical opioid receptors and chimeric G proteins and fentanyl, SNC‐80, and U‐69593 as standard mu, delta, and kappa opioid receptor agonists, respectively (Fig. 6). In CHOmu cells, fentanyl stimulated in a concentration‐dependent manner the release of intracellular calcium with high potency (pEC50 8.84 [8.76‐8.93]); Ro 65‐6570, Ro 2q, SCH‐221510, AT‐403 and MCOPPB were 100–300 fold less potent at eliciting a calcium mobilization response in the CHOmu cells (Fig. 6), whereas AT‐202 and SCH‐486757 were able to elicit a weakly stimulatory response only at micromolar concentrations (Fig. 6B). N/OFQ, SNC‐80 and U‐69593 were completely inactive (data not shown).
Figure 6.

Calcium mobilization assay performed in Chinese Hamster Ovary cells expressing opioid receptors and chimeric G proteins. Concentration response curves to opioid receptor standard agonists and to NOP receptor agonists in cells expressing the mu (panels A and B), the kappa (panels C and D), and delta (panels E and F) opioid receptors. Data are expressed as mean ± SEM of at least 4 separate experiments made in duplicate.
In CHOkappa cells, the standard agonist U‐69593 increased the intracellular calcium concentrations in a concentration‐dependent manner with high potency (8.51 [8.24–8.78]). SCH‐221510 and MCOPPB stimulated calcium mobilization but with low potency and efficacy while the two Roche compounds elicited a weakly stimulatory response only at micromolar concentrations (Fig. 6C). As shown in Figure 6D, the AT compounds and SCH‐486757 were completely inactive at the kappa receptor, and similar results were obtained with N/OFQ, fentanyl and SNC‐80 (data not shown).
At the delta receptor, the standard agonist SNC‐80 stimulated release of intracellular calcium in a concentration‐dependent manner with moderate potency (7.44 [6.75–8.13]). At this receptor Ro 65‐6570, Ro 2q, SCH‐221510 and MCOPPB were able to elicit a weakly stimulatory response only at the highest concentration tested (Fig. 6E). Similar results were obtained with the AT compounds and SCH‐486757 (Fig. 6F). N/OFQ, fentanyl and U‐69593 were found inactive at the delta receptor (data not shown). Details of potency and efficacy of ligands in these experiments are given in Table S3.
BRET assay
Membrane extracts taken from HEK293 cells stably coexpressing the NOP/RLuc and the Gβ1/RGFP fusion proteins were used to evaluate NOP/G‐protein interaction. In the first series of the experiments, N/OFQ promoted NOP/G‐protein interaction in a concentration‐dependent manner with high potency (pEC50 9.27 [9.12–9.41]) and maximal effect of 0.29 ± 0.01 stimulated BRET ratio. All compounds showed similar maximal effects as N/OFQ. Ro 65‐6570, Ro 2q, and SCH‐221510 mimicked N/OFQ action but with 16‐, 28‐, and 36‐fold lower potency, respectively. On the other hand, MCOPPB stimulated NOP/G protein interaction in a concentration‐dependent manner with a potency 2‐fold higher than N/OFQ (Fig. 7A). In the second series of the experiments, N/OFQ promoted NOP/G‐protein interaction in a concentration‐dependent manner with high potency (pEC50 8.71 [8.52–8.90]) and maximal effect of 0.27 ± 0.03 stimulated BRET ratio. AT‐403, AT‐202 and SCH‐486757 mimicked N/OFQ action showing similar maximal effects but 4‐, 90‐ and 135‐fold lower potency, respectively (Fig. 7B).
Figure 7.

Bioluminescence resonance energy transfer assay.Concentration response curve to N/OFQ and NOP agonists in promoting NOP/G protein interaction (panels A and B) and NOP/β‐arrestin 2 interaction (panels C and D). Data are the mean ± SEM of 5 separate experiments made in duplicate.
Whole HEK293 cells stably expressing the NOP/RLuc and the β‐arrestin 2/RGFP fusoproteins were used to evaluate NOP/β‐arrestin 2 interaction. N/OFQ stimulated the interaction of the NOP receptor with β‐arrestin 2 in a concentration‐dependent manner with high potency (pEC50 8.24 [7.88–8.59]) and maximal effects corresponding to 0.10 ± 0.01 stimulated BRET ratio. MCOPPB promoted NOP/β‐arrestin 2 interaction with similar potency and efficacy as N/OFQ. Roche compounds and SCH‐221510 displayed reduced potency and efficacy (Fig. 7C). In a separate set of the experiments N/OFQ produced a stimulatory response showing high potency (pEC50 8.10 [7.94–8.25]) and maximal effects corresponding to 0.09 ± 0.01 stimulated BRET ratio. AT‐403 and AT‐202 mimicked N/OFQ action showing similar maximal effects but lower potency by 5‐ and 100‐fold, respectively. SCH‐486757 slightly stimulated NOP/β‐arrestin 2 interaction only at micromolar concentrations (Fig. 7D). Details of potency and efficacy of ligands in these experiments are given in Table S4. Moreover, the comparison of the effects of each compound on the NOP/G protein and NOP/arrestin interaction are displayed in Figures S1 and S2. Compared to the natural NOP agonist N/OFQ, all compounds displayed higher potency and/or efficacy at G protein than at arrestin with the only exception of AT‐403. These results were used for calculating the bias factor of the ligands: compared to N/OFQ, all compounds displayed statistically significant bias toward G protein, with Ro 65‐6570 showing the larger bias (1.64; Table 1). The only compound showing a bias factor (0.16) not statistically different from zero was AT‐403. For details about numerical values used for calculating bias factors see Table S4.
Electrically stimulated mouse vas deferens
N/OFQ inhibited the electrically induced contractions of the tissues in a concentration‐dependent manner with a potency value of 7.07 (6.98–7.15) and maximal effect of 76 ± 2%. MCOPPB, Roche compounds and SCH‐221510 mimicked the inhibitory effect of N/OFQ showing however higher maximal effects. As far as potency is concerned MCOPPB displayed similar potency as N/OFQ while Ro 2q, Ro 65‐6570, and SCH‐221510 were 2‐, 4‐, and 11‐fold less potent, respectively (Fig. 8A). In a separate series of the experiments where N/OFQ inhibited the twitch response with a potency value of 7.23 (7.14–7.32) and maximal effect of 78 ± 2%, AT‐403 and AT‐202 mimicked the N/OFQ action, but with higher maximal effects; AT‐403 was slightly more potent than N/OFQ whereas AT‐202 was 6‐fold less potent (Fig. 8B). Interestingly, the NOP agonist SCH‐486757 was inactive up to 1 μmol/L in this preparation, displaying inhibitory effects only at higher concentrations. Similar inhibitory effects were elicited by the injection of vehicle (5% DMSO for 10 μmol/L SCH‐486757). Thus, its low solubility associated with low potency precluded the investigation of the action of SCH‐486757 in this preparation. Details of potency and efficacy of ligands in these experiments are given in Table S5.
Figure 8.

Mouse vas deferens bioassay. Concentration response curves to N/OFQ and to NOP agonists. Data are the mean ± SEM. of at least 5 experiments. *P < 0.05 versus N/OFQ (Student t test for paired samples).
Of note, however, it appeared that the kinetics of action of nonpeptide NOP agonists in the mouse vas deferens was very different than that of N/OFQ (Fig. 9). The peptide elicited rapid inhibition of the electrically induced twitch and this effect was rapidly and fully reversible upon washing. On the contrary, the inhibitory effects of nonpeptide NOP agonists were slow to develop and somewhat resistant to washing. As examples, representative tracings of the concentration response curves to N/OFQ and Ro 65‐6570 are shown in Figure 9.
Figure 9.

Representative tracings of the concentration response curve to N/OFQ and Ro 65‐6570 in the electrically mouse vas deferens.
To investigate the receptor(s) involved in the action of nonpeptide NOP agonists in the electrically stimulated mouse vas deferens, studies were performed using tissues from knockout animals. The concentration response curves to the delta‐selective agonist DPDPE were superimposable in tissues taken from NOP(+/+) and NOP(−/−) mice (Fig. 10A). As expected, N/OFQ inhibited the electrically induced contractions of tissues taken from NOP(+/+) but not NOP(−/−) mice (Fig. 10B). On the other hand, all nonpeptide agonists appeared to elicit their inhibitory effects in both types of tissues, but were more potent in NOP(+/+) tissues. The difference in potency between NOP(+/+) and NOP(−/−) tissues ranged from 2‐fold for SCH‐221510 (Fig. 10E) to 30‐fold for AT‐403 (Fig. 10H). Details of potency and efficacy of ligands in these experiments are given in Table S6.
Figure 10.

Mouse vas deferens bioassay. Concentration response curve to DPDPE (panel A), N/OFQ (panel B), Ro 65‐6570 (panel C), Ro 2q (panel D), SCH‐221510 (panel E), MCOPPB (panel F), AT‐202 (panel G) and AT‐403 (panel H) in tissues taken from NOP(+/+) and NOP(−/−) mice. Data are the mean ± SEM. of at least 5 experiments.
All the results obtained in this study are schematically summarized in Table 1 where nonpeptide NOP agonists are compared to N/OFQ in terms of potency, efficacy, selectivity of action and biased agonism behavior.
Discussion
In this study, a detailed in vitro pharmacological characterization of the novel NOP full agonist AT‐403 and comparison with a panel of known nonpeptide NOP agonists is presented. The functional efficacy of these compounds was first assayed at human recombinant NOP receptors using the GTPγ[35S]‐binding assay and a calcium mobilization assay performed in cells expressing chimeric G proteins activating a calcium signaling pathway. Functional selectivity of AT‐403 and other ligands for activating G protein and arrestin‐mediated signaling was assessed using a BRET‐based assay to study NOP receptor interaction with G protein and β‐arrestin 2. Furthermore, the pharmacological effects of these nonpeptide NOP agonists were assessed at native NOP receptors in an ex vivo assay using the electrically stimulated mouse vas deferens. Results obtained in this study demonstrate that all compounds behaved as NOP full agonists displaying the same rank order of potency in the different assays. AT‐403 and MCOPPB were the most potent and NOP‐selective compounds among all the nonpeptide agonists tested. Interestingly all compounds showed biased agonism toward G protein over arrestin, with the exception of AT‐403, which, like the natural agonist N/OFQ, activated both the G protein and arrestin recruitment with equal potency and efficacy. These studies suggest that AT‐403 may be a valuable pharmacological tool that can be used as a nonpeptide surrogate of the natural peptide agonist N/OFQ in in vitro and particularly in vivo studies to investigate the therapeutic potential of NOP agonists.
AT‐403 has single‐digit nanomolar‐binding affinity at the human recombinant NOP receptor, and greater than 100‐fold selectivity over the mu, delta, and kappa opioid receptors (NOP K i = 1.13 nM). The first series of experiments measured the intrinsic efficacy of the compounds in GTPγ[35S]‐binding assay performed in membranes of CHO cells expressing the human NOP receptor. All compounds produced maximal effects similar to the natural agonist N/OFQ, thus behaving as full agonists, confirming data obtained in the original literature for these compounds Ro 65‐6570 (Wichmann et al. 1999), Ro 2q (Rover et al. 2000), SCH‐221510 (Varty et al. 2008), SCH‐486757 (McLeod et al. 2010), AT‐202 (Toll et al. 2009), MCOPPB (Hirao et al. 2008)). The following rank order of agonist potency was obtained:
MCOPPB > AT‐403 > Ro 65‐6570 = Ro 2q = SCH‐221510 > AT‐202 > SCH‐486757.
This is also generally in line with affinity and/or potency values reported in the original papers cited above although direct comparison of data generated in different laboratories should be made with caution. It is, however, worthy of mention that both in the present results and in the original reports, the only compounds showing affinity and potency similar to the natural peptide N/OFQ were MCOPPB and AT‐403.
The same pharmacological behavior (i.e. full agonism) and a similar rank order of potency was obtained in calcium mobilization studies performed in cells co‐expressing the NOP receptor and chimeric G proteins. This further confirms that the pharmacological profile of the NOP receptor is not affected by the aberrant signaling generated by chimeric G protein as consistently demonstrated in previous studies using a large panel of standard NOP ligands (Camarda et al. 2009). Moreover, stimulatory effects elicited by N/OFQ and nonpeptide agonists were similarly sensitive to the NOP competitive antagonist SB‐612111 (Zaratin et al. 2004; Spagnolo et al. 2007; Marti et al. 2013). In fact SB‐612111 showed a competitive antagonist profile against N/OFQ and all nonpeptide agonists (Figs 4 and 5) where the maximal agonist effects were maintained in the presence of the antagonist and similar pA2 values were calculated for the antagonist. These results suggest that these nonpeptide agonists and the antagonist SB‐612111 bind the NOP receptor in the same binding pocket recognized by the natural agonist N/OFQ. Of note, this binding pocket has recently been described at the atomic level in the crystal structure of the NOP receptor in complex with SB‐612111 (Miller et al. 2015).
Together with potency and efficacy, selectivity of action is another crucial pharmacological feature that affects the overall in vivo profile of any given ligand. Selectivity was investigated in calcium mobilization assays performed on cells expressing chimeric G proteins and classical opioid receptors. This assay has been previously validated (Camarda and Calo 2013) using a panel of opioid receptor ligands. Based on the calcium mobilization studies with the mu, delta, and kappa opioid receptors, NOP agonists can be classified into three groups displaying (1) moderate (<100‐fold, Schering‐Plough compounds and Ro 2q) (2) good (approx. 300‐fold, Ro 65‐6570 and AT‐202), and excellent (>1000 fold, MCOPPB and AT‐403) selectivity over classical opioid receptors. MCOPPB and AT‐403 appear to be both the most potent and the most selective nonpeptide NOP agonists among the compounds evaluated. Of note, the NOP selectivity of the best nonpeptide agonist is still far from that displayed by the natural peptide N/OFQ (>10,000 fold).
It is now widely appreciated that the pharmacology of GPCR ligands is affected by the functional selectivity of the ligands to activate G protein‐dependent as well as G protein‐independent intracellular signaling cascades (Maudsley et al. 2005; Luttrell 2006). Ligands that bind to GPCRs can activate one or both cascades, or initiate variable responses in one vs. the other pathway, resulting in ligand‐dependent ‘signal bias’, ‘functional selectivity’ or ‘biased agonism’. The NOP GPCR, like the other opioid receptors and other GPCRs, also displays G protein‐dependent and G protein‐independent signaling cascades. To investigate functional selectivity of ligands that bind to the NOP receptor, we recently developed a BRET‐based assay that measures NOP interaction with G protein and β‐arrestin 2. This assay was first validated with a large series of standard NOP ligands (Malfacini et al. 2015) and used for characterizing the functional selectivity of novel NOP compounds (Asth et al. 2016; Bird et al. 2016; Rizzi et al. 2016). We used the BRET‐based assay to characterize the functional selectivity of the nonpeptide NOP full agonists for the G‐protein or arrestin pathway. As shown in Figures 7A and B and in Table 1, all compounds promoted NOP/G protein interaction with maximal effects similar to N/OFQ thus behaving as full agonists, with a rank order of potency superimposable to that obtained in GTPγ[35S]‐binding and calcium mobilization assays. These results further corroborate the robustness of this pharmacological assay, consistent with our previous study where a high correlation coefficient was obtained when comparing the BRET G protein and GTPγ[35S]‐binding results of a large panel of standard NOP ligands (Malfacini et al. 2015).
When evaluated in the NOP/β‐arrestin 2 BRET assay, all compounds displayed reduced potency and efficacy in arrestin recruitment compared to that for G protein recruitment. With the exception of AT‐403, all other NOP agonists tested showed significant bias toward G protein. The amount of bias was different among the different ligands, with Ro 65‐6570 showing higher (1.64) and AT‐202 the lower (0.46) value.
This result is not unexpected as G protein‐biased behavior has been reported for some nonpeptide NOP agonists in previous studies (Chang et al. 2015; Malfacini et al. 2015; Rizzi et al. 2016). Similar findings have also been reported for mu and delta opioid receptor nonpeptide agonists (Molinari et al. 2010). The reason(s) of this phenomenon are unknown. It has been suggested that the receptors of the opioid family might be characterized by more restrictive chemical requirements for arrestin than G protein efficacy (Molinari et al. 2010). Alternately, we proposed that the bias toward G protein of synthetic agonists might derive from the G protein signaling‐based primary screening assays (e.g. cAMP, GTPγ[35S], calcium mobilization) that have been used to identify and optimize these compounds (Malfacini et al. 2015). Clearly further investigations and particularly effector‐specific structure activity studies may allow this open question to be answered. Interestingly, however, AT‐403 seems to represent the exception to this rule. In fact AT‐403 generated similar concentration response curves in promoting NOP/G protein and NOP/β‐arrestin 2 interactions in a similar manner as the unbiased endogenous agonist N/OFQ. This is quantified by the AT‐403 bias factor (0.16), which is not statistically different from 0. Thus, to the best of our knowledge, AT‐403 is the only example of an unbiased nonpeptide NOP full agonist. This compound could serve as a lead for future structure‐activity studies aimed at generating NOP receptor agonists biased toward β‐arrestin 2. Such compounds would be of exceptional value for investigating functional selectivity in vivo and assessing the therapeutic potential of biased agonists in the NOP receptor field.
Studies with recombinant receptors expressed in heterologous systems allow a very precise estimate of pharmacological parameters and the evaluation of the drug effect on different biochemical pathways. However, important insights into drug action can be obtained from analysis of drug effects in a native environment with the use of isolated tissues. With this aim we investigated the action of nonpeptide NOP agonists in the electrically stimulated mouse vas deferens, an N/OFQ‐sensitive pharmacological preparation (Berzetei‐Gurske et al. 1996; Calo et al. 1996). In this preparation N/OFQ concentration‐dependently inhibits the neurogenic contraction elicited by electrical field stimulation with potency values and maximal effects in line with previous studies (Calo et al. 1996; Spagnolo et al. 2007). The nonpeptide agonists mimicked the inhibitory effects of the peptide, showing, however, very different kinetics of action, characterized by slow onset and development of their effects and resistance to wash. A similar profile of effects in tissue preparations has been previously reported for other nonpeptide NOP agonists including Ro 64‐6198 (Rizzi et al. 2001) and a different series of AT compounds (Ferrari et al. 2016). The rank order of agonist potency obtained in the mouse vas deferens assay was superimposable to that obtained at the human recombinant receptor further corroborating our proposal that the human and murine NOP receptor display very similar if not identical pharmacological profiles (Calo and Guerrini 2013; Toll et al. 2016). Importantly, the maximal effects elicited by nonpeptide agonists were significantly higher than those of N/OFQ, suggesting off‐target effects. This was confirmed in knockout studies. Indeed, while the action of N/OFQ was completely abrogated in tissues from NOP(−/−) mice, the nonpeptide agonists displayed inhibitory effects in tissues from both NOP(+/+) and NOP(−/−) animals, albeit with lower potency in NOP(−/−) tissues. This difference in potency was about 14‐ and 30‐fold for MCOPPB and AT‐403, respectively but less than 10‐fold for the other compounds. The implications of these results are twofold. On one hand, these results suggest that the selectivity for NOP over classical opioid receptors evaluated in recombinant systems is possibly overestimated compared to the results obtained in the knockout tissues which should be considered the real test for ligand selectivity. On the other hand, these results confirm and extend those obtained at recombinant receptors demonstrating that MCOPPB and particularly AT‐403 are considerably more NOP‐selective than the other nonpeptide agonists even if, in absolute terms, their selectivity of action is still lower than that of N/OFQ. Although we consider these findings on NOP selectivity important, these should not be overemphasized. In fact, a large body of evidence (recently reviewed in (Toll et al. 2016) and (Zaveri 2016)) demonstrates that the in vivo actions of standard NOP agonists are sensitive to selective NOP antagonists and/or no longer evident in NOP(−/−) mice. As an example we recently demonstrated that Ro 65‐6570, that displays only 4 fold selectivity in the mouse vas deferens, produces robust anxiolytic like effects in vivo in the elevated plus maze test, that are sensitive to SB‐612111 and no longer evident in NOP(−/−) mice (Asth et al. 2016).
Collectively this study demonstrates that the ligands evaluated behaved as NOP full agonists with the following rank order of potency: MCOPPB > AT‐403 > Ro 65‐6570 = Ro 2q > SCH‐221510 > AT‐202 > SCH‐486757, both at recombinant and native NOP receptors. MCOPPB and AT‐403 were not only the most potent agonists but also the most NOP‐selective as suggested by both recombinant opioid receptors and knockout tissue studies. Moreover, the pharmacological profile of MCOPPB and AT‐403 is not superimposable since BRET studies demonstrate that the former compound behaves, similar to the other nonpeptide agonists, as a biased agonist toward G protein while the latter, similar to N/OFQ, as an unbiased agonist. The present detailed analysis and comparison of nonpeptide NOP agonists is of value in selecting the best pharmacological tools for investigating in vivo biological functions controlled by the N/OFQ – NOP receptor system, and ultimately in evaluating therapeutic potential of NOP ligands.
Disclosures
NT Zaveri and BV Journigan are employees of Astraea Therapeutics. All authors declare no conflicts of interest.
Supporting information
Table S1. GTPγ[35S]‐binding assay.
Table S2. Calcium mobilization assay.
Table S3. Calcium mobilization assay.
Table S4. BRET assay.
Table S5. Electrically stimulated mouse vas deferens
Table S6. Electrically stimulated mouse vas deferens.
Figure S1. BRET assay.
Figure S2. BRET assay.
Acknowledgements
This work was supported by funds from the University of Ferrara (FAR 2015 grant to GC), the Italian Ministry of Research (PRIN 2015WX8Y5B grant to GC and RG), and the National Institutes of Health (R01DA014026 and R01DA027811 grants to NZ).
Ferrari F., Malfacini D., Journigan B. V., Bird M. F., Trapella C., Guerrini R., Lambert D. G., Calo' G., Zaveri N. T.. In vitro pharmacological characterization of a novel unbiased NOP receptor‐selective nonpeptide agonist AT‐403. Pharma Res Per, 5(4), 2017, e00333, https://doi.org/10.1002/prp2.333
References
- Asth L, Ruzza C, Malfacini D, Medeiros I, Guerrini R, Zaveri NT, et al. (2016). Beta‐arrestin 2 rather than G protein efficacy determines the anxiolytic‐versus antidepressant‐like effects of nociceptin/orphanin FQ receptor ligands. Neuropharmacology 105: 434–442. [DOI] [PMC free article] [PubMed] [Google Scholar]
- Bertorelli R, Bastia E, Citterio F, Corradini L, Forlani A, Ongini E (2002). Lack of the nociceptin receptor does not affect acute or chronic nociception in mice. Peptides 23: 1589–1596. [DOI] [PubMed] [Google Scholar]
- Berzetei‐Gurske IP, Schwartz RW, Toll L (1996). Determination of activity for nociceptin in the mouse vas deferens. Eur J Pharmacol 302: R1–2. [DOI] [PubMed] [Google Scholar]
- Bird MF, Cerlesi MC, Brown M, Malfacini D, Vezzi V, Molinari P, et al. (2016). Characterisation of the Novel Mixed Mu‐NOP Peptide Ligand Dermorphin‐N/OFQ (DeNo). PLoS ONE 11: e0156897. [DOI] [PMC free article] [PubMed] [Google Scholar]
- Calo G, Rizzi A, Bogoni G, Neugebauer V, Salvadori S, Guerrini R, et al. (1996). The mouse vas deferens: a pharmacological preparation sensitive to nociceptin. Eur J Pharmacol 311: R3–5. [DOI] [PubMed] [Google Scholar]
- Calo G., Guerrini R. (2013) Medicinal Chemistry, Pharmacology, and Biological Actions of Peptide Ligands Selective for the Nociceptin/Orphanin FQ Receptor In: Research and Development of Opioid‐Related Ligands. vol. 1131 American Chemical Society, Washington, DC. [Google Scholar]
- Camarda V, Calo G (2013). Chimeric G proteins in fluorimetric calcium assays: experience with opioid receptors. Methods Mol Biol 937: 293–306. [DOI] [PubMed] [Google Scholar]
- Camarda V, Fischetti C, Anzellotti N, Molinari P, Ambrosio C, Kostenis E, et al. (2009). Pharmacological profile of NOP receptors coupled with calcium signaling via the chimeric protein G alpha qi5. Naunyn‐Schmiedeberg's Arch Pharmacol 379: 599–607. [DOI] [PubMed] [Google Scholar]
- Chang SD, Mascarella SW, Spangler SM, Gurevich VV, Navarro HA, Carroll FI, et al. (2015). Quantitative signaling and structure‐activity analyses demonstrate functional selectivity at the nociceptin/orphanin FQ opioid receptor. Mol Pharmacol 88: 502–511. [DOI] [PMC free article] [PubMed] [Google Scholar]
- Ferrari F, Cerlesi MC, Malfacini D, Asth L, Gavioli EC, Journigan BV, et al. (2016). In vitro functional characterization of novel nociceptin/orphanin FQ receptor agonists in recombinant and native preparations. Eur J Pharmacol 793: 1–13. [DOI] [PMC free article] [PubMed] [Google Scholar]
- Gavioli EC, Calo G (2006). Antidepressant‐ and anxiolytic‐like effects of nociceptin/orphanin FQ receptor ligands. Naunyn‐Schmiedeberg's Arch Pharmacol 372: 319–330. [DOI] [PubMed] [Google Scholar]
- Gavioli EC, Calo G (2013). Nociceptin/orphanin FQ receptor antagonists as innovative antidepressant drugs. Pharmacol Ther 140: 10–25. [DOI] [PubMed] [Google Scholar]
- Hirao A, Imai A, Sugie Y, Yamada Y, Hayashi S, Toide K (2008). Pharmacological characterization of the newly synthesized nociceptin/orphanin FQ‐receptor agonist 1‐[1‐(1‐methylcyclooctyl)‐4‐piperidinyl]‐2‐[(3R)‐3‐piperidinyl]‐1H‐benzimidazole as an anxiolytic agent. J Pharmacol Sci 106: 361–368. [DOI] [PubMed] [Google Scholar]
- Journigan VB, Polgar WE, Khroyan TV, Zaveri NT (2014). Designing bifunctional NOP receptor‐mu opioid receptor ligands from NOP‐receptor selective scaffolds.Part II. Bioorg Med Chem 22: 2508–2516. [DOI] [PMC free article] [PubMed] [Google Scholar]
- Kenakin T (2004). A Pharmacology Primer. Elsevier Academic Press, San Diego. [Google Scholar]
- Kilkenny C, Browne W, Cuthill IC, Emerson M, Altman DG; Group NCRRGW (2010). Animal research: reporting in vivo experiments: the ARRIVE guidelines. Br J Pharmacol 160: 1577–1579. [DOI] [PMC free article] [PubMed] [Google Scholar]
- Lambert DG (2008). The nociceptin/orphanin FQ receptor: a target with broad therapeutic potential. Nat Rev Drug Discovery 7: 694–710. [DOI] [PubMed] [Google Scholar]
- Lowry OH, Rosebrough NJ, Farr AL, Randall RJ (1951). Protein measurement with the Folin phenol reagent. J Biol Chem 193: 265–275. [PubMed] [Google Scholar]
- Luttrell LM (2006). Transmembrane signaling by G protein‐coupled receptors. Methods Mol Biol 332: 3–49. [DOI] [PubMed] [Google Scholar]
- Malfacini D, Ambrosio C, Gro MC, Sbraccia M, Trapella C, Guerrini R, et al. (2015). Pharmacological Profile of Nociceptin/Orphanin FQ Receptors Interacting with G‐Proteins and beta‐Arrestins 2. PLoS ONE 10: e0132865. [DOI] [PMC free article] [PubMed] [Google Scholar]
- Marti M, Mela F, Veronesi C, Guerrini R, Salvadori S, Federici M, et al. (2004). Blockade of nociceptin/orphanin FQ receptor signaling in rat substantia nigra pars reticulata stimulates nigrostriatal dopaminergic transmission and motor behavior. J Neurosci 24: 6659–6666. [DOI] [PMC free article] [PubMed] [Google Scholar]
- Marti M, Sarubbo S, Latini F, Cavallo M, Eleopra R, Biguzzi S, et al. (2010). Brain interstitial nociceptin/orphanin FQ levels are elevated in Parkinson's disease. Mov Disord 25: 1723–1732. [DOI] [PubMed] [Google Scholar]
- Marti M, Mela F, Budri M, Volta M, Malfacini D, Molinari S, et al. (2013). Acute and chronic antiparkinsonian effects of the novel nociceptin/orphanin FQ receptor antagonist NiK‐21273 in comparison with SB‐612111. Br J Pharmacol 168: 863–879. [DOI] [PMC free article] [PubMed] [Google Scholar]
- Maudsley S, Martin B, Luttrell LM (2005). The origins of diversity and specificity in g protein‐coupled receptor signaling. J Pharmacol Exp Ther 314: 485–494. [DOI] [PMC free article] [PubMed] [Google Scholar]
- McLeod RL, Tulshian DB, Bolser DC, Varty GB, Baptista M, Fernandez X, et al. (2010). Pharmacological profile of the NOP agonist and cough suppressing agent SCH 486757 (8‐[Bis(2‐Chlorophenyl)Methyl]‐3‐(2‐Pyrimidinyl)‐8‐Azabicyclo[3.2.1]Octan‐3‐Ol) in preclinical models. Eur J Pharmacol 630: 112–120. [DOI] [PMC free article] [PubMed] [Google Scholar]
- Miller RL, Thompson AA, Trapella C, Guerrini R, Malfacini D, Patel N, et al. (2015). The Importance of Ligand‐Receptor Conformational Pairs in Stabilization: spotlight on the N/OFQ G Protein‐Coupled Receptor. Structure 23: 2291–2299. [DOI] [PMC free article] [PubMed] [Google Scholar]
- Molinari P, Vezzi V, Sbraccia M, Gro C, Riitano D, Ambrosio C, et al. (2010). Morphine‐like opiates selectively antagonize receptor‐arrestin interactions. J Biol Chem 285: 12522–12535. [DOI] [PMC free article] [PubMed] [Google Scholar]
- Mustazza C, Bastanzio G (2011). Development of nociceptin receptor (NOP) agonists and antagonists. Med Res Rev 31: 605–648. [DOI] [PubMed] [Google Scholar]
- Nagi K, Pineyro G (2016). Practical guide for calculating and representing biased signaling by GPCR ligands: a stepwise approach. Methods 92: 78–86. [DOI] [PubMed] [Google Scholar]
- Neubig RR, Spedding M, Kenakin T, Christopoulos A (2003). International Union of Pharmacology Committee on Receptor Nomenclature and Drug Classification. XXXVIII. Update on terms and symbols in quantitative pharmacology. Pharmacol Rev 55: 597–606. [DOI] [PubMed] [Google Scholar]
- Nijmeijer S, Vischer HF, Rosethorne EM, Charlton SJ, Leurs R (2012). Analysis of multiple histamine H(4) receptor compound classes uncovers Galphai protein‐ and beta‐arrestin2‐biased ligands. Mol Pharmacol 82: 1174–1182. [DOI] [PubMed] [Google Scholar]
- Nishi M, Houtani T, Noda Y, Mamiya T, Sato K (1997). Doi T, et al. Unrestrained nociceptive response and disregulation of hearing ability in mice lacking the nociceptin/orphaninFQ receptor. The EMBO journal 16: 1858–1864. [DOI] [PMC free article] [PubMed] [Google Scholar]
- Post A, Smart TS, Krikke‐Workel J, Dawson GR, Harmer CJ, Browning M, et al. (2016). A selective nociceptin receptor antagonist to treat depression: evidence from preclinical and clinical studies. Neuropsychopharmacology 41: 1803–1812. [DOI] [PMC free article] [PubMed] [Google Scholar]
- Rizzi D, Bigoni R, Rizzi A, Jenck F, Wichmann J, Guerrini R, et al. (2001). Effects of Ro 64‐6198 in nociceptin/orphanin FQ‐sensitive isolated tissues. Naunyn‐Schmiedeberg's Arch Pharmacol 363: 551–555. [DOI] [PubMed] [Google Scholar]
- Rizzi A, Cerlesi MC, Ruzza C, Malfacini D, Ferrari F, Bianco S, et al. (2016). Pharmacological characterization of cebranopadol a novel analgesic acting as mixed nociceptin/orphanin FQ and opioid receptor agonist. Pharmacol Res Perspect 4: e00247. [DOI] [PMC free article] [PubMed] [Google Scholar]
- Rover S, Wichmann J, Jenck F, Adam G, Cesura AM (2000). ORL1 receptor ligands: structure‐activity relationships of 8‐cycloalkyl‐1‐phenyl‐1,3,8‐triaza‐spiro[4.5]decan‐4‐ones. Bioorg Med Chem Lett 10: 831–834. [DOI] [PubMed] [Google Scholar]
- Schroder W, Lambert DG, Ko MC, Koch T (2014). Functional plasticity of the N/OFQ‐NOP receptor system determines analgesic properties of NOP receptor agonists. Br J Pharmacol 171: 3777–3800. [DOI] [PMC free article] [PubMed] [Google Scholar]
- Spagnolo B, Carra G, Fantin M, Fischetti C, Hebbes C, McDonald J, et al. (2007). Pharmacological characterization of the nociceptin/orphanin FQ receptor antagonist SB‐612111 [(‐)‐cis‐1‐methyl‐7‐[[4‐(2,6‐dichlorophenyl)piperidin‐1‐yl]methyl]‐6,7,8,9‐tetrah ydro‐5H‐benzocyclohepten‐5‐ol]: in vitro studies. J Pharmacol Exp Ther 321: 961–967. [DOI] [PubMed] [Google Scholar]
- Thanawala VJ, Forkuo GS, Stallaert W, Leff P, Bouvier M, Bond R (2014). Ligand bias prevents class equality among beta‐blockers. Curr Opin Pharmacol 16: 50–57. [DOI] [PMC free article] [PubMed] [Google Scholar]
- Toll L, Khroyan TV, Polgar WE, Jiang F, Olsen C, Zaveri NT (2009). Comparison of the antinociceptive and antirewarding profiles of novel bifunctional nociceptin receptor/mu‐opioid receptor ligands: implications for therapeutic applications. J Pharmacol Exp Ther 331: 954–964. [DOI] [PMC free article] [PubMed] [Google Scholar]
- Toll L, Bruchas MR, Calo G, Cox BM, Zaveri NT (2016). Nociceptin/orphanin FQ receptor structure, signaling, ligands, functions, and interactions with opioid systems. Pharmacol Rev 68: 419–457. [DOI] [PMC free article] [PubMed] [Google Scholar]
- Vachon L, Costa T, Herz A (1987). Opioid receptor desensitization in NG 108‐15 cells. Differential effects of a full and a partial agonist on the opioid‐dependent GTPase. Biochem Pharmacol 36: 2889–2897. [DOI] [PubMed] [Google Scholar]
- Varty GB, Lu SX, Morgan CA, Cohen‐Williams ME, Hodgson RA, Smith‐Torhan A, et al. (2008). The anxiolytic‐like effects of the novel, orally active nociceptin opioid receptor agonist 8‐[bis(2‐methylphenyl)methyl]‐3‐phenyl‐8‐azabicyclo[3.2.1]octan‐3‐ol (SCH 221510). J Pharmacol Exp Ther 326: 672–682. [DOI] [PubMed] [Google Scholar]
- Wichmann J, Adam G, Rover S, Cesura AM, Dautzenberg FM, Jenck F (1999). 8‐acenaphthen‐1‐yl‐1‐phenyl‐1,3,8‐triaza‐spiro[4.5]decan‐4‐one derivatives as orphanin FQ receptor agonists. Bioorg Med Chem Lett 9: 2343–2348. [DOI] [PubMed] [Google Scholar]
- Woodcock A, McLeod RL, Sadeh J, Smith JA (2010). The efficacy of a NOP1 agonist (SCH486757) in subacute cough. Lung 188(Suppl 1): S47–52. [DOI] [PubMed] [Google Scholar]
- Zaratin PF, Petrone G, Sbacchi M, Garnier M, Fossati C, Petrillo P, et al. (2004). Modification of nociception and morphine tolerance by the selective opiate receptor‐like orphan receptor antagonist (‐)‐cis‐1‐methyl‐7‐[[4‐(2,6‐dichlorophenyl)piperidin‐1‐yl]methyl]‐6,7,8,9‐tetrahy dro‐5H‐benzocyclohepten‐5‐ol (SB‐612111). J Pharmacol Exp Ther 308: 454–461. [DOI] [PubMed] [Google Scholar]
- Zaveri NT (2016). Nociceptin opioid receptor (NOP) as a therapeutic target: progress in translation from preclinical research to clinical utility. J Med Chem 59: 7011–7028. [DOI] [PMC free article] [PubMed] [Google Scholar]
Associated Data
This section collects any data citations, data availability statements, or supplementary materials included in this article.
Supplementary Materials
Table S1. GTPγ[35S]‐binding assay.
Table S2. Calcium mobilization assay.
Table S3. Calcium mobilization assay.
Table S4. BRET assay.
Table S5. Electrically stimulated mouse vas deferens
Table S6. Electrically stimulated mouse vas deferens.
Figure S1. BRET assay.
Figure S2. BRET assay.