Abstract
Objective:
On fluorine-18 fludeoxyglucose (18F-FDG) positron emission tomography (PET) CT of pulmonary or hepatic lesions, standard uptake value (SUV) is often underestimated due to patient breathing. The aim of this study is to validate, on phantom and patient data, a motion correction algorithm [reconstruct, register and averaged (RRA)] implemented on a PET-CT system.
Methods:
Three phantoms containing five spheres filled with 18F-FDG and suspended in a water or Styrofoam® 18F-FDG-filled tank to create different contrasts and attenuation environment were acquired on a Discovery GE710. The spheres were animated with a 2-cm longitudinal respiratory-based movement. Respiratory-gated (RRA) and ungated PET images were compared with static reference images (without movement). The optimal acquisition time, number of phases and the best phase within the respiratory cycle were investigated. The impact of irregular motion was also investigated. Quantification impact was computed on each sphere. Quantification improvement on 28 lung lesions was also investigated.
Results:
Phantoms: 4 min was required to obtain a stable quantification with the RRA method. The reference phase and the number of phases used for RRA did not affect the quantification which was similar on static acquisitions but different on ungated images. The results showed that the maximum standard uptake value (SUVmax) restoration is majored for the smallest spheres (≤2.1 ml). Patients: SUVmax on RRA and ungated acquisitions were statistically different to the SUVmax on whole-body images (p = 0.05) but not different from each other (mean SUVmax: 7.0 ± 7.8 vs 6.9 ± 7.8, p = 0.23 on RRA and ungated images, respectively). We observed a statistically significant correlation between SUV restoration and lesion displacement, with a real SUV quantitation improvement for lesion with movement >1.2 mm.
Conclusion:
According to the results obtained using phantoms, RRA method is promising, showing a real impact on the lesion quantification on phantom data. With regard to the patient study, our results showed a trend towards an increase in the SUVs and a decrease in the volume between the ungated and RRA data. We also noticed a statistically significant correlation between the quantitative restoration obtained with RRA compared with ungated data and lesion displacement, indicating that the RRA approach should be reserved to patients with small lesions or nodes moving with a displacement larger than 1.2 cm.
Advances in knowledge:
This article investigates the performances of motion correction software recently introduced in PET. The conclusion revealed that such respiratory motion correction approach shows a real impact on the lesion quantification but must be reserved to the patient for whom lesion displacement was confirmed and high enough to clearly impact lesion evaluation.
INTRODUCTION
Positron emission tomography (PET) with fluorine-18 fludeoxyglucose (18F-FDG) coupled with a CT scan (PET-CT) has become a standard for tumour evaluation1,2 and cancer staging. Many studies have assessed the ability of the standard uptake value (SUV) to predict prognosis and survival in different tumours.3,4 18F-FDG PET-CT is also a powerful tool to establish the plan for treatment in radiotherapy.5
Because of the acquisition time length, the data are obtained during free respiration. Thus, organs are subject to motion artefacts as a result of breathing movements.6 These motion artefacts induce significant anomalies in quantification, which increase tumour volume and reduce the SUV.
Knowledge of respiratory movements as a signal during imaging acquisitions must be accessible to consider the correction of artefacts. Different synchronization tools are offered by manufacturers; the main tools include the Real Time Position Management™ system from Varian Medical Systems (Palo Alto, CA), the pressure sensor AZ-733V from Anzai Medical (Tokyo, Japan)7 or a deformable belt proposed by Medspira IBC System (Minneapolis, MN).
Different classes of correction methods have been described.8 The first class of methods does not require respiratory synchronization, i.e. PET-CT in deep inspiration.9,10 Another class of more advanced methods reconstructs PET images synchronized to respiration but associated with unsynchronized CT images, i.e. free breathing CT images11 or blocked expiration CT images.12,13 A third class of methods relies on the synchronization obtained in both PET and CT modalities.14,15 These methods are the most informative in terms of lesion movement (amplitude and directions) and thus quantification.16–18 Finally, more elaborate methods propose to corrected for the motion by repositioning the lines of responses at the raw data level according to a pre-computed deformation field or to incorporate the motion respiration into the system matrix during the reconstruction process. These last approaches are subject to noise amplification or computational issues.8,19,20
In 2009, Werner et al21 examined 18 patients with lung cancer and identified a significant decrease in tumour volume on images gated to respiratory movement compared with non-gated images (−44.5%, p = 0.025). The gated tumour volume was not different compared with the volume obtained on the CT images. Moreover, the maximum standard uptake value (SUVmax) significantly increased in respiratory gated images (+22.4%, p < 0.001).
The PET gating method subdivides the PET raw data into phases according to the respiratory cycle frequency or to the respiratory amplitude.8 The PET acquisition time is typically multiplied by the number of phases to maintain a statistically reliable number of counts in each phase. Dawood et al22 demonstrated that six-phase decomposition was optimal in a single case study. Using a phantom, Bettinardi et al23 determined that the fewer the number of phases, the lower the SUVmax quantification.
General Electric Healthcare (GEHC) recently introduced a new reconstruction algorithm (Q.Freeze) based on the reconstruct, register and average (RRA) method originally proposed by Dawood et al,24,25 for the quantification of moving lesions, addressing both movement artefacts and the problem of acquisition time. The principle of this algorithm is to first gate different time phases of the PET series and subsequently merge them using elastic transformation based on the approach of optical flow.
The aim of this work was to use phantom experiments to validate the performance of this software for quantification and to determine the optimal settings for its clinical application. Thereafter, the clinical impact obtained from patients was evaluated.
METHODS AND MATERIALS
Phantoms
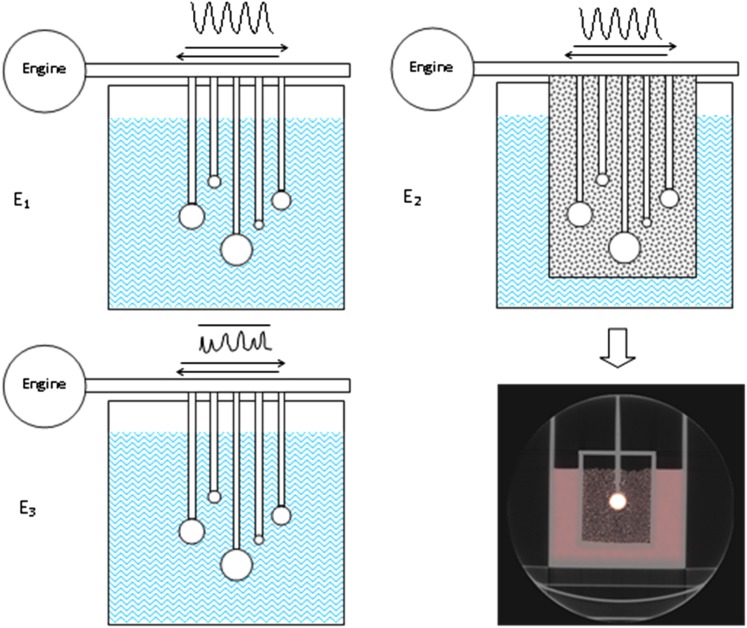
Three phantom experiments (E1, E2 and E3; Figure 1) were performed using a tank phantom filled with water and 18F-FDG in which five spheres (0.5, 2.1, 5.6, 11.5 and 19.3 ml) were suspended and filled with the same fluorine-18 (18F) concentration, considering clinical activity concentrations (2.4 kBq ml−1, i.e. 3.5 MBq kg−1 1 h before image acquisition). A mechanical device was used to transmit an asymmetrical periodic movement on spheres mimicking human breathing (amplitude 2 cm in the head–feet direction, frequency 10 or 15 cycles min−1). For E1, activity of 18F was successively added in the phantom to produce signal-to-background ratios of 8, 5 and 3. For E2, the spheres were placed in an insert filled with Styrofoam® beads immersed in a small concentration of 18F, mimicking lung tissue. Then, we performed the third experiment E3 with an irregular manual motion.
Figure 1.
Phantom experiments using a parallelepiped phantom containing five spheres in a uniform background and animated by a periodic (E1 and E2) or non-periodic (E3) movement by a transmission axis connected to a motor. In E1 and E3, spheres were immersed in water. In E2, spheres were surrounded by a mix of Styrofoam® beads and water to mimic lung environment. An axial CT image of the lung phantom is presented.
Respiratory-gated acquisitions
Acquisitions were performed on a Discovery PET-CT 710 (GEHC) equipped with a respiratory gating hardware Real Time Position Management. This system records changes in abdominal elevation during a breathing movement (vertical movement). It consists of a charge-coupled device camera sensitive to infrared light and a plastic box with two small bright reflectors. The camera has a fixed position away from the patient's feet. The box was placed on the patient's chest typically halfway between the xiphoid process and the umbilicus to enable the camera to track the vertical signal. For the phantom experiments, the reflector was connected to the motor shaft to convert the movement along the z axis in a movement along the y axis.
RRA is a method which allows the reconstruction of a PET-CT series obtained in a short time (i.e. 2–3 min, according to the GEHC recommendations).
First, a gated CT acquisition with multiple phases over a respiratory cycle is obtained by the selection of the slices of the wanted volume at multiple respiratory positions. Then, list-mode data for PET, which are gated to the breathing signal, are recorded. The number of phases is chosen and CT is reconstructed along this number of phases followed by the PET phases corrected for attenuation with the corresponding CT position. Finally, the PET images of each phase are co-registered to one of the phases (the reference phase) using a regularized elastic registration algorithm based on an optical flow motion. Each PET series is then summed to obtain a single motion-corrected low-noise image. A detailed description of the RRA method was published by Dawood et al.24
Table 1 presents the acquisition setup for the three experiments. For each sphere-to-background contrast and each respiratory frequency of experiment E1, a 4-min static and a 20-min synchronized acquisition were recorded. The respiratory signal was decomposed in 3, 5 or 8 phases. Phase 0% represents the end of inspiration; the end of expiration occurred at approximately 50%, and the 100% phase marks the end of one cycle and the beginning of the next cycle.
Table 1.
Experiment E1, E2 and E3 acquisition parameters
| Experiment | Contrasts (Sph./bkg or Sph./lung) | Frequency (resp. min−1) | No. of resp. phases | Reconstruction |
|---|---|---|---|---|
| E1 | Sph./bkg = 3, 5 and 8 | 10, 15 | 3, 5 and 8 | Static: 4 min |
| Ungated: 4 min | ||||
| RRA: 1, 2, 4, 6, 10 and 20 min | ||||
| E2 | Sph./bkg = 10.3 Sph./lung = 19.4 |
10 | 5 | Static: 4 min |
| Ungated: 9 × 4 min | ||||
| RRA: 9 × 4 min | ||||
| E3 | Sph./bkg = 5.5 | Irregular | 5 | Static: 4 min |
| Ungated: 5 × 4 min | ||||
| RRA: 5 × 4 min |
bkg, background; No., number; resp., respiration; RRA, reconstruct, register and averaged; Sph., sphere.
For experiments E2 and E3, only one contrast, one signal sampling and one frequency were considered, but we performed nine repeated acquisitions for E2 and five repeated acquisitions for E3 in order to reinforce the statistical analysis.
The different quantification parameters were compared with assess to the robustness of this new software. Indeed, with different reconstructions, contrasts and sizes of spheres, we tested the software to evaluate the effects of gating on static and moving targets. Moreover, we assessed the minimum time required to record the gated acquisition and the different parameters that affect the respiratory phases (i.e. the reference phase and number of phases).
Finally, a static acquisition with simulated gating for RRA was performed. It consists of an acquisition with a moving detector but applied to a static acquisition (i.e. spheres were not connected to the motor) to apply the RRA software on the static data to mimic the application of RRA on the static lesion (i.e. lung apical lesions).
Patients
Between January 2014 and June 2015, after giving oral consent, 70 patients underwent an additional gated acquisition as part of a 18F-FDG-PET-CT standard lung nodule evaluation visible on the CT. Finally, 20 patients had nodule measurable on the ungated or RRA-delayed acquisition (nodule > background uptake). The Centre Henri Becquerel clinical research review board approved this study, and the requirement to obtain written informed consent was waived.
A whole-body acquisition was first performed with patients fasted for 6 h. The injected activity was 3.5 MBq kg−1. CT mAs were automatically adapted to patient morphology. PET and CT acquisitions were dependent on the patient's habitus. For patients with a body mass index <30, the CT voltage was 100 kV and the PET acquisition time was 2 min per bed position; otherwise, the CT voltage was 120 kV and the PET acquisition time was 2.5 min per bed position. An additional respiratory-gated bed position was then performed. The list-mode acquisition enables an a posteriori reconstruction of the patient data as a standard ungated complementary scan.
Statistics
The data compared RRA or ungated acquisitions in term of SUVs [SUVmax and peak standard uptake value (SUVpeak)] and metabolic volumes (40% SUVmax threshold).
Wilcoxon and Friedman paired tests were used to compare the means for two or more groups, respectively. Analyses were conducted using SAS® software (SAS Institute Inc., Cary, NC). Statistical significance was defined by p < 0.05.
A correlation of the quantification values was evaluated by an intraclass correlation test and represented by the Bland and Altman graphic method.
RESULTS
Phantom study
Validation of the reconstruct register and averaged post-processing (E1)
To ensure that the RRA method did not introduce bias in PET quantification, we applied this post-processing on a static phantom, for which we simulated a breathing movement. We considered the data for one contrast (=3), 1 movement frequency (10 cycles min−1) and 4 RRA reconstructions (1 in 4 min and 3 in 3 min), which provided 16 different values (4 reconstructions and 4 visible spheres).
Table 2 shows the SUVmax and SUVpeak values for the RRA and ungated images. The RRA method significantly reduced the SUVmax values (3.87 ± 0.42 and 3.66 ± 0.37 for ungated and the RRA images, respectively; p = 0.016).
Table 2.
Comparison of mean for the maximum standard uptake value (SUVmax) and peak standard uptake value (SUVpeak), between reconstruct, register and averaged (RRA) and ungated images of the static phantom (phantom with no movement) in experiment (E1) (Wilcoxon test)
| Measurement statistics | SUVmax (ungated) | SUVmax (RRA) | SUVpeak (ungated) | SUVpeak (RRA) |
|---|---|---|---|---|
| Mean | 3.87 | 3.66 | 2.75 | 2.67 |
| SD | 0.42 | 0.37 | 0.41 | 0.31 |
| p-value (Wilcoxon) | 0.016 | 0.15 | ||
SD, standard deviation.
Effects of respiratory frequency on gated acquisition (E1)
The data obtained in respiratory gating with contrasts 3 and 8 were compared with the Wilcoxon test. For frequency = 15 cycles min−1, the mean of SUVmax = 5.65 ± 2.0 and SUVmax = 5.50 ± 2.6 when frequency = 10 cycles min−1. There was no significant difference between these values (p = 0.91).
Effects of acquisition time (E1)
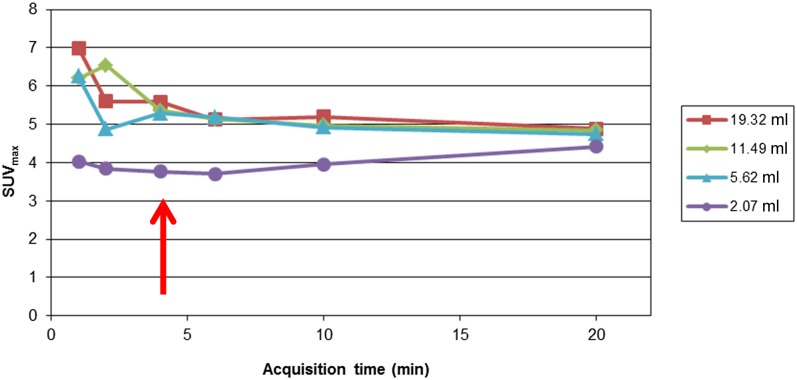
List-mode acquisition, which was gated to the phantom movement, enables the reconstruction of several volumes for acquisition times of 1, 2, 4, 6, 10 and 20 min. The data were analysed that considered one contrast (=5) and one movement frequency (10 cycles min−1). The SUVmax (Figure 2) values for the four largest spheres are shown as a function of the acquisition time.
Figure 2.
The maximum standard uptake value (SUVmax) as a function of the acquisition time of experiment E1. The arrow shows the minimal required acquisition time to achieve stable quantitative values.
We can see a stabilization of the quantitative values from a reconstruction of 4 min, which was considered for the continuation of the phantom study.
Effects of the reference phase (E1)
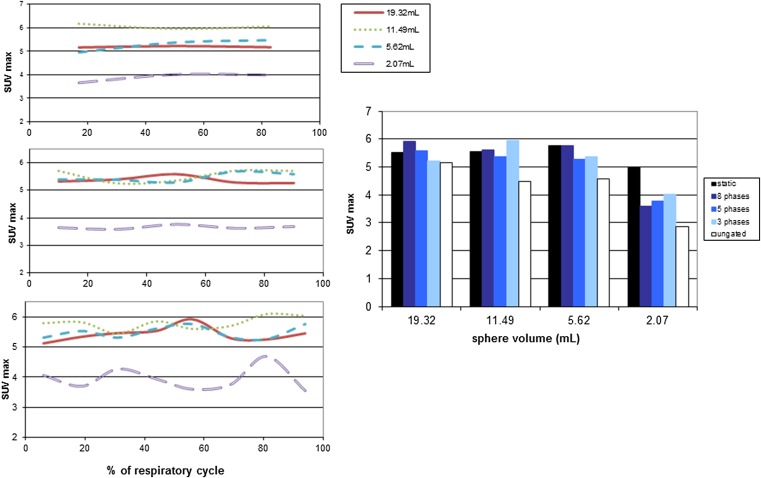
The breathing movement is a pseudosinusoidal movement where the maximum amplitude is the end of inspiration. The reference phase used for registration may influence the final RRA method and must be evaluated to optimize the software results. For three phase samplings (3, 5 and 8 phases, Figures 3 and 4), we investigated the impact of the reference phase by reconstructing the images successively with each phase as a reference phase with one contrast (=5) and one respiratory frequency (10 cycles min−1).
Figure 3.
On the left side, the maximum standard uptake value (SUVmax) variation as a function of the reference phase for the three, five and eight phases sampling of experiment E1; On the right side, SUVmax variation as a function of the different samplings and sphere volumes of experiment E1.
Figure 4.
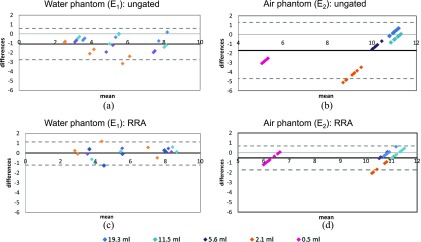
Bland–Altman graphs represent the difference of the two maximum standard uptake values (SUVsmax) on the y axis as a function of their mean value for each sphere, contrast and respiratory frequency. (a, c) water phantom (E1); (b, d) lung phantom (E2). (a, b) static vs ungated; (c, d) static vs reconstruct, register and averaged (RRA). The black solid line represents the mean differences and the two grey dashed lines represent two standard deviations from the mean.
There are several important findings in these figures:
– Regardless of the number of phases of reconstruction, the quantification parameters (SUVmax) slightly varied from phase-to-phase without stabilization;
– The higher the number of phases, the higher the SUV variation from phase to phase;
– There was no optimal reference phase to obtain the SUV maximum value;
– The size of the spheres did not affect the reference phase to use.
Impact of the number of phases (E1)
We investigated the effects of respiratory cycle sampling on the quantification because, theoretically, the lower the phase sampling, the higher the residual lesion movement (i.e. lesion movement during each phase) and the higher the image count statistic. We considered three phase samplings: three, five and eight phases. The central phase was used as a reference.
Figure 3 shows the influence of the phase sampling on the SUVmax measurements compared with the values obtained on ungated images and from a static acquisition. The SUVmax measurements were not significantly different (p = 0.47; Friedman test) even if the SUV indices were largely improved compared with the ungated data (white bars) and close to the reference value (black bars) regardless of the number of reconstruction phases.
Quantitative impact of reconstruct register and averaged (E1 and E2)
We compared the SUV values obtained with and without RRA reconstruction with the reference static acquisition (without movement) considering the data of spheres in the water tank (E1) or in air (E2).
The values obtained for a five-phase sampling of experiment E1 were tested with an intraclass correlation test. Table 3 shows that the correlation of the quantitative parameters between RRA images and static images was excellent on SUVmax and SUVpeak (intraclass correlation coefficient >0.9), whereas these parameters were less correlated on ungated acquisitions.
Table 3.
The intraclass correlation index for the correlations of the maximum standard uptake value (SUVmax) and peak standard uptake value (SUVpeak), between the reference data set [phantom without movement (mvt)] and the data of the moving phantom with [reconstruct, register and averaged (RRA)] or without gating (ungated)
| Standard uptake values | Static (no mvt)/RRA | Static (no mvt)/ungated |
|---|---|---|
| SUVmax | 0.96 (0.91–0.98) | 0.77 (0.55–0.89) |
| SUVpeak | 0.96 (0.91–0.98) | 0.88 (0.75–0.94) |
The analysis of Bland–Altman graphs (Figure 4) indicated that respiratory gating can restore the underestimation of quantification parameters caused by respiratory motion. The same trends was observed both for the spheres in water (E1) and for the more realistic “lung” configuration (E2). In this first experiment, the bias in the SUVmax estimation varied from −1.2 without RRA to 0 with RRA. In the lung configuration (E2), the bias in the SUVmax estimation dropped from −1.7 without RRA to −0.5 with RRA. It clearly appears on this figure that the SUVmax restoration is essential for the smallest spheres (≤2.1 ml). This corresponds to the spheres with an internal diameter shorter than the sphere displacement.
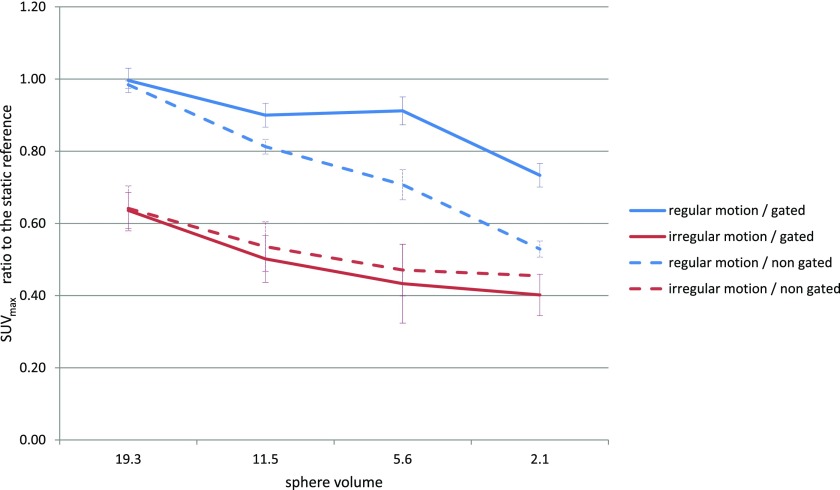
Effect of the irregularity of the spheres movement on quantification (E3)
Here, the spheres were moved irregularly (frequency and amplitude) and compared with the previous acquisitions. Figure 5 shows the major role of the regularity on the quantification with or without gating.
Figure 5.
The maximum standard uptake value (SUVmax) ratio to the static reference for each sphere of experiment E3.
Patient study
20 patients underwent an 18F-FDG-PET-CT to study a lung tumour or to evaluate a pulmonary nodule. A standard acquisition of the thorax, abdomen and pelvis was performed (whole-body acquisition) 60 min after the 18F-FDG injection. Then, an additional gating acquisition was performed. The same list-mode data were reconstructed both in a standard 2.5-min static mode and in the 4-min RRA mode to evaluate the impact of the post-processing software. 28 lesions were evaluable. The descriptive information is summarized in Table 4.
Table 4.
Demographic and clinical characteristics of the patients and lesions
| Age (n = 20), years | Median (range) | 63 (28–79) |
| Sex | Male | 16 (80%) |
| Female | 4 (20%) | |
| Lesion localization (n = 28) | Upper right | 7 (25%) |
| Upper left | 6 (21%) | |
| Median | 5 (18%) | |
| Lower right | 6 (21%) | |
| Lower left | 4 (15%) | |
| Lesion displacement (mm) | Mean (SD) | 10.4 (6.2) |
| Lesion largest dimension (mm) | Mean (SD) | 13.2 (8.7) |
SD, standard deviation.
The SUVmax and SUVpeak measurements of the 28 lesions are presented in Table 5. The standard deviation of the SUVs is as high as the mean SUV values underlying the large variability between lesion uptake.
Table 5.
Means and standard deviations (SDs) of the patient lesion measurements
| Measurement statistics | Whole-body SUVmax (approximately 70 min PI) | RRA SUVmax (approximately 110 min PI) | Ungated SUVmax (approximately 110 min PI) | Whole-body SUVpeak (approximately 70 min PI) | RRA SUVpeak (approximately 110 min PI) | Ungated SUVpeak (approximately 110 min PI) |
|---|---|---|---|---|---|---|
| Mean | 6.3 | 7.0 | 6.9 | 4.5 | 5.1 | 4.8 |
| SD | 9.3 | 7.8 | 7.8 | 7.9 | 6.7 | 6.7 |
PI, post injection time; RRA, reconstruct, register and averaged; SUVmax, maximum standard uptake value; SUVpeak, peak standard uptake value.
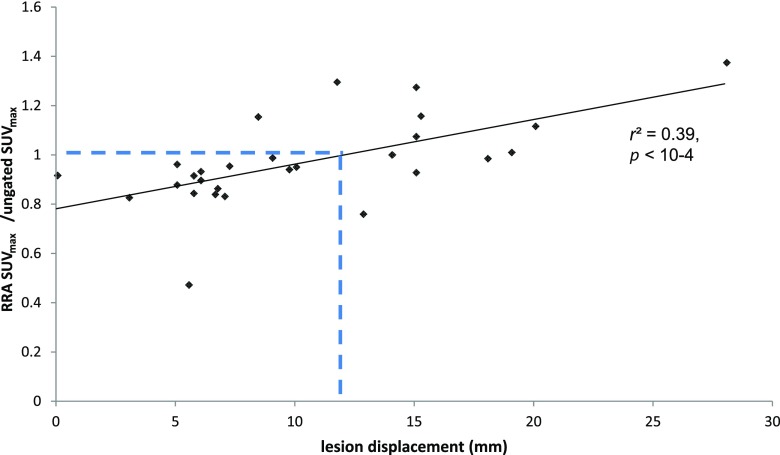
Figure 6 presents the quantitative restoration obtained with RRA in comparison to ungated images as a function of the lesion displacement. The SUVmax varies from −52% to +37% on the RRA images compared with the ungated images. We observed a statistically significant correlation between the SUV restoration and the lesion displacement (p < 10−4, Spearman correlation test), with a real quantitative improvement for lesion with movement >1.2 mm.
Figure 6.
Significant quantitative restoration obtained with reconstruct, register and averaged (RRA) in comparison to ungated images as a function of the displacement of the lesion centre of gravity in the z direction (Spearman correlation test).
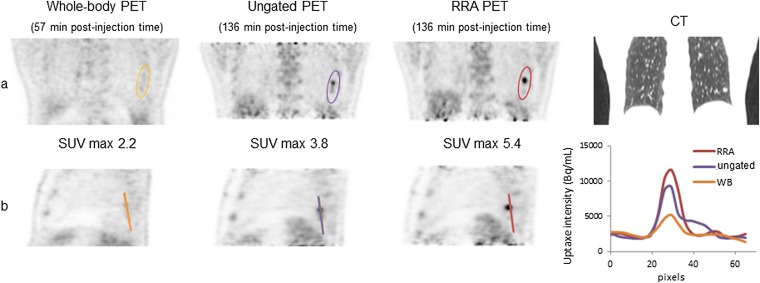
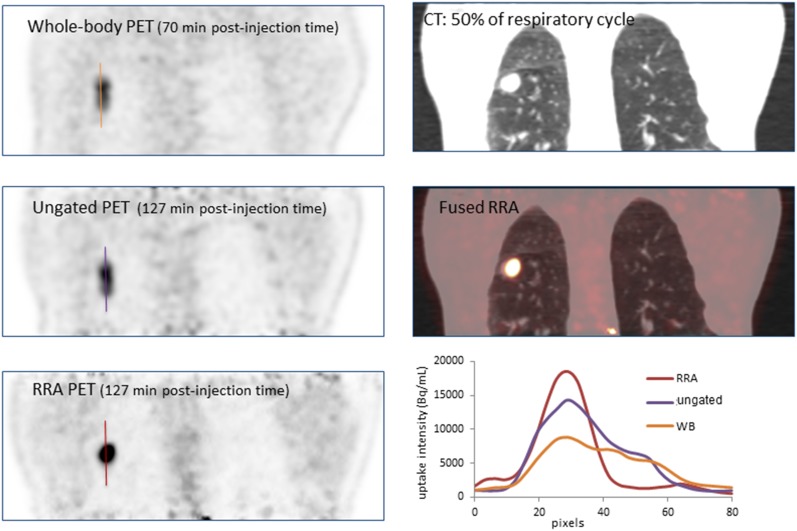
Figures 7 and 8 illustrate patients with lesions in the lower lobes on the CT, whole-body, static and RRA images. In Figure 7, we clearly see the impact of the delayed images compared with the whole-body acquisition and on the line profiles, the reduction of the signal spreading on the RRA image compared with the ungated acquisition. In Figure 8, the lesion region appears sharper with the RRA post-processing than for a standard static image.
Figure 7.
Patient presenting a lower left lung nodule: (a) whole-body (WB), ungated and reconstruct, register and averaged (RRA) fluorine-18 fludeoxyglucose positron emission tomography (PET) reconstructions along with the CT images; (b) several sagittal slices and line profiles through the lesion.
Figure 8.
Patient who presented a lesion in the lower right pulmonary lobe. On the bottom right, the line profiles through the lesion. PET, positron emission tomography; RRA, reconstruct, register and averaged; SUVmax, maximum standard uptake value; WB, whole body.
DISCUSSION
The aim of this study was to assess the accuracy and robustness of the RRA method, recently proposed by GE Healthcare, to free-moving lesions from quantitative biases. Two articles on RRA were published recently.26,27 The first one,27 based on simulated data of unbreathing patient, concluded to the superiority of motion-compensated image reconstruction over RRA in terms of image bias and variance. The other article compared RRA (3–5–10 min) with ungated and four-dimensional (4D)-PET-CT on 29 patients in terms of SUVs, metabolic volume, signal-to-noise or lesion-to-background ratio. To our knowledge, the evaluation of RRA based on multiple phantom experiments along with the patient's data has never been reported.
According to the results obtained using phantom data, this new software is promising. In accordance with the commercial recommendations, a minimal acquisition time of 4 min is sufficient to be free from noise influence, and the quantitative parameters are restored up to those that would be obtained with no movement. In our clinical conditions, we propose a protocol acquisition of 4 min per bed position, sampled in five phases with no particular reference gate. The acquisition time obviously depends on the PET system sensitivity, the injected activity and, potentially, the reconstruction protocol. For other clinical conditions, the acquisition time will be adjusted. Our recommended acquisition time is in agreement with results from Minamimoto et al26 who suggest a 5-min acquisition time.
The major part of this work relied on phantom experiments. We considered acquisition conditions as close as possible to the clinical conditions. The injected background activity was calculated to mimic the clinical protocols. The respiratory movement simulated a pseudosinusoidal movement, with a slow shift during the expiration phase. And we performed additional acquisitions, considering a more complex phantom, including a low-density media to simulate the lung environment. Indeed, the image quantification can be largely affected by misregistration issues between the CT and the PET data sets. Whatever the phantom, the positive impact of RRA appeared clearly when applied to regular-frequency displacements.
Unfortunately, a phantom, however sophisticated it is, is quite different compared with a real patient, especially in terms of movement description. Breathing movements represent a combination of different types of displacement (i.e. rotation plus translations in three dimensions), whereas the spindle of our phantom describes a simple translation.28,29
Moreover, in a patient's body, the heart beat also impacts the lung motions. Seppenwoolde et al30 showed that a pulmonary lesion can move up to 4 mm depending on the proximity from the heart. These movements are not considered in our phantom.
Regardless of the contrast or the frequency of motion, the smallest sphere in our phantom, 0.53 ml in volume, could not be visualized. This is mainly due to partial volume effect in regard of the sphere size and movement amplitude. The other factor affecting lesion detectability is that this sphere was located at the edge of the PET axial field of view, where the noise is especially high.
Phantom study
First, we assessed the RRA post-processing and demonstrated that the method restores quantitative information only when the target is moving. The first part of the study showed that the quantification of a static lesion was significantly reduced when RRA was applied (Table 2). This result could be explained by image smoothing during the elastic registration required at the end of the RRA process. By contrast, when the sphere did move, the quantitative indexes improved. This software should definitively be reserved for moving lesions. This result was confirmed in Figure 6, which showed a reduction in the SUVmax of RRA images (with respect to ungated data) for the lesions with displacement <12 mm.
The respiratory frequency (10 or 15 cycles min−1) did not affect the quantification (no significant difference between the frequencies was obtained on the SUV measurements). This finding indicates that the software is not dependent on respiratory frequencies, which can be useful for patients with a lung disease.
We assessed the robustness of RRA regarding the acquisition time. The advertisements that concerned RRA method promised no longer of an acquisition time compared with classical acquisition (i.e. 2.5 min) because it used every event detected along this period. By contrast, other articles focused on respiratory-gated PET-CT proposed a longer acquisition time (e.g. Werner et al21 used a 10-min acquisition). We showed that a minimum of 4 min is necessary to obtain a stable quantification without variation because of image noise. We did not investigate the impact of reconstruction parameters (i.e. iterations, sub sets, post-filtering etc.), which directly influence the image noise, to the minimal required acquisition time.
RRA requires the user to define a “reference” phase. The theory would suggest the central phase (end of expiration) as a reference because of the limited respiratory motion in this part of the respiratory cycle. We demonstrated that the reference phase had no impact on the quantitative parameters. With elastic registration, every respiratory phase can be chosen, which validates the robustness of the registration algorithm.
The number of phases also has little impact on quantitative accuracy. This finding contradicts the previous results described by Dawood et al,22 who recommended a six-phase sampling. This sampling must be chosen in terms of its goal (i.e. quantification, visibility of the displacement and accuracy).
When this method was studied on a phantom by Wollenweber et al,25 it demonstrated a net correction of quantification (on SUVmax and metabolic volume) compared with images typically obtained. In this article, the signal was decomposed in six phases, and the reference phase was the first phase (expiration phase).
One of the main objectives of this study was to compare the quantification improvement obtained when using RRA to a “free motion” gold standard and to ungated data of a moving phantom. Indeed, SUVs should be lower when a target is moving during acquisition because the number of events is allocated over a larger volume of interest.16 Our results show, as expected, a better correlation between RRA and the reference data compared with that between ungated and reference data in terms of the SUVmax and SUVpeak. The RRA method software allows a restoration of the quantitative underevaluation observed for ungated data (−25% of the SUVmax). The SUV restoration was confirmed with a phantom containing spheres immersed in a low-density media (Styrofoam), proving the robustness of the method with regard to variable attenuation.
Patient study
We prospectively studied the impact of RRA on a population of patients assessed for pulmonary lesion or node. Although our results were quite positive regarding the phantom studies, they were more questionable regarding the patient data.
Thus, the SUVs significantly increased between the whole-body and ungated or gated acquisitions due to the difference in imaging time post injection, as has been previously reported in the literature.31,32 Tahari et al32 found a lesion SULmax increased by an average of 34% in the delayed non-gated scan as compared with the whole-body initial scan and further by an additional 17.2% in respiratory-gated images. The maximum lesion displacement was 6.2 ± 5.0 mm, and the acquisition time of the (un)gated data was 15 min. Regarding the 4D-PET-CT approach, Nehmeh et al18 showed an increase in the SUV in 5 patients using 10 respiratory phases. Werner et al21 then found a significant increase in the SUVmax values (p < 0.001) and a decrease in the metabolic volumes (p = 0.025) between respiratory gated (10 min acquisition, sampled in 10 phases) and ungated data in 18 patients. These results were obtained with 4D-PET-CT where acquisitions were longer and no registration phase to phase was performed.
At the opposite of the phantom data, there are no statistical differences between RRA and ungated delayed acquisition considering the whole set of lesions. This result is in line with those of Minamimoto et al26 who found that SUVmax was lower with RRA 10 min and RRA 5 min than with ungated or 4D-PET images, but there were no statistically significant differences in SUVmean and the lesion-to-background ratios. To understand the differences between the results obtained from the phantom and patients, some assumptions can be put forward: first, the large difference among patients in terms of lesion 18F-FDG uptakes do not allow any meaningful conclusions regarding the quantitative advantage of the RRA method based on an analysis of such population values. Second, the phantom moves according to a regular displacement, whereas a patient must be educated to regular breathing and no incidents should occur (i.e. cough, dyspnoea). Unfortunately, the respiratory gating system only allows sampling the respiratory cycle in timed phases, which supposes regularity in the respiratory amplitude. Several authors have shown that amplitude-based approaches are most robust in the case of irregular breathing patterns compared with phase-based gating approaches.33–35 The Q.Freeze software does not propose any amplitude sampling and only proposes a time sampling.
Third, the tumours were simulated by a sphere filled with water and 18F-FDG, which is a very homogeneous medium compared with tumours, which are known to be heterogeneous.36 Both the lesion and the patient uptake heterogeneity can affect the elastic registration, and thus, the quantitative parameters.
Finally, in clinical practice, we suggest to reserve the gated acquisition and the RRA correction for patients with lesion located in the lower regions, unattached to a mediastinal or pleural structures and who are able to maintain a rather regular breathing.
CONCLUSION
According to the results obtained using phantoms, the RRA method is promising, showing a real impact on the lesion quantification on phantom data.
With regard to the patient study, our results showed a trend towards an increase in the SUVs and a decrease in the volume with a significant difference between the whole-body and RRA data. We noticed a statistically significant correlation between the quantitative restoration obtained with RRA, compared with ungated data, and the lesion displacement, indicating that the RRA approach should be reserved to patients with small lesions or nodes moving with a displacement >1.2 cm.
A future study should evaluate this software using a larger patient population and should investigate parameters such as lesion position, lesion displacement or the size of lesions.
Acknowledgments
ACKNOWLEDGMENTS
The authors thank M Raphael Gauthier for his valuable help.
Contributor Information
Anne-Charlotte Bouyeure-petit, Email: anne-charlotte.bouyeure@chb.unicancer.fr.
Mathieu Chastan, Email: mathieu.chastan@chb.unicancer.fr.
Agathe Edet-Sanson, Email: agathe.edet-sanson@chb.unicancer.fr.
Stephanie Becker, Email: stephanie.becker@chb.unicancer.fr.
Sebastien Thureau, Email: sebastien.thureau@chb.unicancer.fr.
Estelle Houivet, Email: estelle.houivet@chu-rouen.fr.
Pierre Vera, Email: pierre.vera@chb.unicancer.fr.
Sebastien Hapdey, Email: sebastien.hapdey@chb.unicancer.fr.
REFERENCES
- 1.Fletcher JW, Djulbegovic B, Soares HP, Siegel BA, Lowe VJ, Lyman GH, et al. Recommendations on the use of 18F-FDG PET in oncology. J Nucl Med 2008; 49: 480–508. doi: https://doi.org/10.2967/jnumed.107.047787 [DOI] [PubMed] [Google Scholar]
- 2.Roman CD, Martin WH, Delbeke D. Incremental value of fusion imaging with integrated PET-CT in oncology. Clin Nucl Med 2005; 30: 470–7. doi: https://doi.org/10.1097/01.rlu.0000167514.11891.f5 [DOI] [PubMed] [Google Scholar]
- 3.Berghmans T, Dusart M, Paesmans M, Hossein-Foucher C, Buvat I, Castaigne C, et al. Primary tumor standardized uptake value (SUVmax) measured on fluorodeoxyglucose positron emission tomography (FDG-PET) is of prognostic value for survival in non-small cell lung cancer (NSCLC): a systematic review and meta-analysis (MA) by the European Lung Cancer Working Party for the IASLC Lung Cancer Staging Project. J Thorac Oncol 2008; 3: 6–12. doi: https://doi.org/10.1097/JTO.0b013e31815e6d6b [DOI] [PubMed] [Google Scholar]
- 4.Zhu Y, Lu J, Wei X, Song S, Huang G. The predictive value of interim and final [18F] fluorodeoxyglucose positron emission tomography after rituximab-chemotherapy in the treatment of non-Hodgkin's lymphoma: a meta-analysis. Biomed Res Int 2013; 2013: 275805. doi: https://doi.org/10.1155/2013/275805 [DOI] [PMC free article] [PubMed] [Google Scholar]
- 5.Mac Manus MP, Nestle U, Rosenzweig KE, Carrio I, Messa C, Belohlavek O, et al. Use of PET and PET/CT for radiation therapy planning: IAEA expert report 2006–2007. Radiother Oncol 2009; 91: 85–94. doi: https://doi.org/10.1016/j.radonc.2008.11.008 [DOI] [PubMed] [Google Scholar]
- 6.Callahan J, Kron T, Schneider-Kolsky M, Hicks RJ. The clinical significance and management of lesion motion due to respiration during PET/CT scanning. Cancer Imaging 2011; 11: 224–36. doi: https://doi.org/10.1102/1470-7330.2011.0031 [DOI] [PMC free article] [PubMed] [Google Scholar]
- 7.Otani Y, Fukuda I, Tsukamoto N, Kumazaki Y, Sekine H, Imabayashi E, et al. A comparison of the respiratory signals acquired by different respiratory monitoring systems used in respiratory gated radiotherapy. Med Phys 2010; 37: 6178–86. doi: https://doi.org/10.1118/1.3512798 [DOI] [PubMed] [Google Scholar]
- 8.Pepin A, Daouk J, Bailly P, Hapdey S, Meyer ME. Management of respiratory motion in PET/computed tomography: the state of the art. Nucl Med Commun 2014; 35: 113–22. [DOI] [PMC free article] [PubMed] [Google Scholar]
- 9.Nehmeh SA, Erdi YE, Meirelles GS, Squire O, Larson SM, Humm JL, et al. Deep-inspiration breath-hold PET/CT of the thorax. J Nucl Med 2007; 48: 22–6. [PubMed] [Google Scholar]
- 10.Yamashita S, Yokoyama K, Onoguchi M, Yamamoto H, Hiko S, Horita A, et al. Feasibility of deep-inspiration breath-hold PET/CT with short-time acquisition: detectability for pulmonary lesions compared with respiratory-gated PET/CT. Ann Nucl Med 2014; 28: 1–10. doi: https://doi.org/10.1007/s12149-013-0774-9 [DOI] [PMC free article] [PubMed] [Google Scholar]
- 11.Lupi A, Zaroccolo M, Salgarello M, Malfatti V, Zanco P. The effect of 18F-FDG-PET/CT respiratory gating on detected metabolic activity in lung lesions. Ann Nucl Med 2009; 23: 191–6. doi: https://doi.org/10.1007/s12149-008-0225-1 [DOI] [PubMed] [Google Scholar]
- 12.Daouk J, Fin L, Bailly P, Meyer ME. Respiratory-gated positron emission tomography and breath-hold computed tomography coupling to reduce the influence of respiratory motion: methodology and feasibility. Acta Radiol 2009; 50: 144–55. doi: https://doi.org/10.1080/02841850802627437 [DOI] [PubMed] [Google Scholar]
- 13.Fin L, Daouk J, Morvan J, Bailly P, El Esper I, Saidi L, et al. Initial clinical results for breath-hold CT-based processing of respiratory-gated PET acquisitions. Eur J Nucl Med Mol Imaging 2008; 35: 1971–80. doi: https://doi.org/10.1007/s00259-008-0858-2 [DOI] [PubMed] [Google Scholar]
- 14.Boucher L, Rodrigue S, Lecomte R, Benard F. Respiratory gating for 3-dimensional PET of the thorax: feasability and initial results. J Nucl Med 2004; 45: 214–19. [PubMed] [Google Scholar]
- 15.Daouk J, Leloire M, Fin L, Bailly P, Morvan J, El Esper I, et al. Respiratory-gated 18F-FDG PET imaging in lung cancer: effects on sensitivity and specificity. Acta Radiol 2011; 52: 651–7. doi: https://doi.org/10.1258/ar.2011.110018 [DOI] [PubMed] [Google Scholar]
- 16.Erdi YE, Nehmeh SA, Pan T, Pevsner A, Rosenzweig KE, Mageras G, et al. The CT motion quantitation of lung lesions and its impact on PET-measured SUVs. J Nucl Med 2004; 45: 1287–92. [PubMed] [Google Scholar]
- 17.Nehmeh SA, Erdi YE, Ling CC, Rosenzweig KE, Squire OD, Braban LE, et al. Effect of respiratory gating on reducing lung motion artifacts in PET imaging of lung cancer. Med Phys 2002; 29: 366–71. doi: https://doi.org/10.1118/1.1448824 [DOI] [PubMed] [Google Scholar]
- 18.Nehmeh SA, Erdi YE, Ling CC, Rosenzweig KE, Schoder H, Larson SM, et al. Effect of respiratory gating on quantifying PET images of lung cancer. J Nucl Med 2002; 43: 876–81. [PubMed] [Google Scholar]
- 19.Livieratos L, Stegger L, Bloomfield PM, Schafers K, Bailey DL, Camici PG. Rigid-body transformation of list-mode projection data for respiratory motion correction in cardiac PET. Phys Med Biol 2005; 50: 3313–22. doi: https://doi.org/10.1088/0031-9155/50/14/008 [DOI] [PubMed] [Google Scholar]
- 20.Qiao F, Pan T, Clark JW, Jr, Mawlawi OR. A motion-incorporated reconstruction method for gated PET studies. Phys Med Biol 2006; 51: 3769–83. doi: https://doi.org/10.1088/0031-9155/51/15/012 [DOI] [PubMed] [Google Scholar]
- 21.Werner MK, Parker JA, Kolodny GM, English JR, Palmer MR. Respiratory gating enhances imaging of pulmonary nodules and measurement of tracer uptake in FDG PET/CT. AJR Am J Roentgenol 2009; 193: 1640–5. doi: https://doi.org/10.2214/AJR.09.2516 [DOI] [PubMed] [Google Scholar]
- 22.Dawood M, Buther F, Stegger L, Jiang X, Schober O, Schafers M, et al. Optimal number of respiratory gates in positron emission tomography: a cardiac patient study. Med Phys 2009; 36: 1775–84. doi: https://doi.org/10.1118/1.3112422 [DOI] [PubMed] [Google Scholar]
- 23.Bettinardi V, Rapisarda E, Gilardi MC. Number of partitions (gates) needed to obtain motion-free images in a respiratory gated 4D-PET/CT study as a function of the lesion size and motion displacement. Med Phys 2009; 36: 5547–58. doi: https://doi.org/10.1118/1.3254431 [DOI] [PubMed] [Google Scholar]
- 24.Dawood M, Buther F, Jiang X, Schafers KP. Respiratory motion correction in 3-D PET data with advanced optical flow algorithms. IEEE Trans Med Imaging 2008; 27: 1164–75. doi: https://doi.org/10.1109/TMI.2008.918321 [DOI] [PubMed] [Google Scholar]
- 25.Wollenweber S, Gopalakrishnan G, Thielemans K, Manjeshwar RM. Evaluation of the accuracy and robustness of a motion correction algorithm for PET using a novel phantom approach. IEEE Trans Nucl Sci 2012; 59: 123–30. doi: https://doi.org/10.1109/tns.2011.2179983 [Google Scholar]
- 26.Minamimoto R, Mitsumoto T, Miyata Y, Sunaoka F, Morooka M, Okasaki M, et al. Evaluation of a new motion correction algorithm in PET/CT: combining the entire acquired PET data to create a single three-dimensional motion-corrected PET/CT image. Nucl Med Commun 2016; 37: 162–70. doi: https://doi.org/10.1097/mnm.0000000000000423 [DOI] [PubMed] [Google Scholar]
- 27.Polycarpou I, Tsoumpas C, Marsden PK. Analysis and comparison of two methods for motion correction in PET imaging. Med Phys 2012; 39: 6474–83. doi: https://doi.org/10.1118/1.4754586 [DOI] [PubMed] [Google Scholar]
- 28.Ross CS, Hussey DH, Pennington EC, Stanford W, Doornbos JF. Analysis of movement of intrathoracic neoplasms using ultrafast computerized tomography. Int J Radiat Oncol Biol Phys 1990; 18: 671–7. doi: https://doi.org/10.1016/0360-3016(90)90076-v [DOI] [PubMed] [Google Scholar]
- 29.Goerres GW, Kamel E, Seifert B, Burger C, Buck A, Hany TF, et al. Accuracy of image coregistration of pulmonary lesions in patients with non-small cell lung cancer using an integrated PET/CT system. J Nucl Med 2002; 43: 1469–75. [PubMed] [Google Scholar]
- 30.Seppenwoolde Y, Shirato H, Kitamura K, Shimizu S, van Herk M, Lebesque JV, et al. Precise and real-time measurement of 3D tumor motion in lung due to breathing and heartbeat, measured during radiotherapy. Int J Radiat Oncol Biol Phys 2002; 53: 822–34. doi: https://doi.org/10.1016/s0360-3016(02)02803-1 [DOI] [PubMed] [Google Scholar]
- 31.Hamberg LM, Hunter GJ, Alpert NM, Choi NC, Babich JW, Fischman AJ. The dose uptake ratio as an index of glucose metabolism: useful parameter or oversimplification? J Nucl Med 1994; 35: 1308–12. [PubMed] [Google Scholar]
- 32.Tahari AK, Lodge MA, Wahl RL. Respiratory-gated PET/CT versus delayed images for the quantitative evaluation of lower pulmonary and hepatic lesions. J Med Imaging Radiat Oncol 2014; 58: 277–82. doi: https://doi.org/10.1111/1754-9485.12154 [DOI] [PMC free article] [PubMed] [Google Scholar]
- 33.Chang G, Chang T, Pan T, Clark JW, Jr, Mawlawi OR. Implementation of an automated respiratory amplitude gating technique for PET/CT: clinical evaluation. J Nucl Med 2010; 51: 16–24. doi: https://doi.org/10.2967/jnumed.109.068759 [DOI] [PMC free article] [PubMed] [Google Scholar]
- 34.Dawood M, Buther F, Lang N, Schober O, Schafers KP. Respiratory gating in positron emission tomography: a quantitative comparison of different gating schemes. Med Phys 2007; 34: 3067–76. doi: https://doi.org/10.1118/1.2748104 [DOI] [PubMed] [Google Scholar]
- 35.van der Gucht A, Serrano B, Hugonnet F, Paulmier B, Garnier N, Faraggi M. Impact of a new respiratory amplitude-based gating technique in evaluation of upper abdominal PET lesions. Eur J Radiol 2014; 83: 509–15. doi: https://doi.org/10.1016/j.ejrad.2013.11.010 [DOI] [PubMed] [Google Scholar]
- 36.van Elmpt W, Zegers CM, Das M, De RD. Imaging techniques for tumour delineation and heterogeneity quantification of lung cancer: overview of current possibilities. J Thorac Dis 2014; 6: 319–27. doi: https://doi.org/10.3978/j.issn.2072-1439.2013.08.62 [DOI] [PMC free article] [PubMed] [Google Scholar]


