Abstract
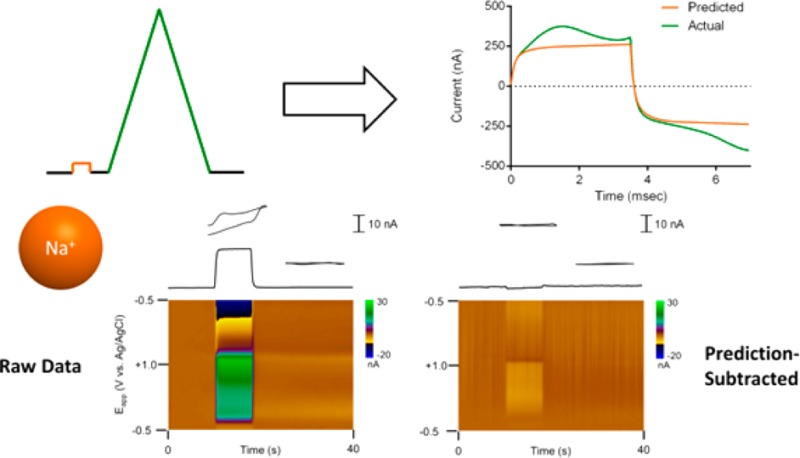
Due to its high spatiotemporal resolution, fast-scan cyclic voltammetry (FSCV) at carbon-fiber microelectrodes enables the localized in vivo monitoring of subsecond fluctuations in electroactive neurotransmitter concentrations. In practice, resolution of the analytical signal relies on digital background subtraction for removal of the large current due to charging of the electrical double layer as well as surface faradaic reactions. However, fluctuations in this background current often occur with changes in the electrode state or ionic environment, leading to nonspecific contributions to the FSCV data that confound data analysis. Here, we both explore the origin of such shifts seen with local changes in cations and develop a model to account for their shape. Further, we describe a convolution-based method for removal of the differential capacitive contributions to the FSCV current. The method relies on the use of a small-amplitude pulse made prior to the FSCV sweep that probes the impedance of the system. To predict the nonfaradaic current response to the voltammetric sweep, the step current response is differentiated to provide an estimate of the system’s impulse response function and is used to convolute the applied waveform. The generated prediction is then subtracted from the observed current to the voltammetric sweep, removing artifacts associated with electrode impedance changes. The technique is demonstrated to remove select contributions from capacitive characteristics changes of the electrode both in vitro (i.e., in flow-injection analysis) and in vivo (i.e., during a spreading depression event in an anesthetized rat).
Electrochemistry provides a method for the real-time in vivo detection of redox-active neurotransmitters. Refinement of voltammetry for this purpose has enabled evaluation of their localized concentration dynamics in awake and behaving animals.1−5 Cyclic voltammograms allow assignment of the signals to specific neurotransmitters and thus permit selective tracking in the complex extracellular environment. However, compared to amperometric techniques, the use of voltammetry comes at the cost of sensitivity and time resolution.6 To compensate, high scan rates are used (i.e., fast-scan cyclic voltammetry, or FSCV) which, while making in vivo detection practical, amplify other sources of current (e.g., the capacitive charging current and surface faradaic reactions).7 These interferences dwarf the analytical signal and are one of the primary sources of noise.
For these reasons, FSCV data analysis typically employs digital subtraction of the background using the current measured before the neurobiological phenomena of interest.8 This method is effective for signal isolation given background stability. However, if neurotransmitter release is accompanied by factors that affect the background, the subtracted data contain artifacts. At the scan rates typically used (e.g., hundreds of volts per second), a significant double-layer charging current exists.9 The magnitude and shape of this charging current and the presence of any background faradaic current strongly depend on the electrode material and its environment. Carbon fibers are the most common electrode material used for in vivo voltammetry.10 These fibers are known to have a diverse array of surface functional groups, particularly oxygen-containing ones.11 These moieties are critical in determining the electrode responses seen in FSCV (i.e., capacitive behavior, electrocatalytic properties, and adsorption).12−14 Further, a subset is known to be electroactive, generating peaks in the background voltammograms.15−18 Interactions with the carbon surface, through either adsorption or involvement in surface reactions, may alter these responses and contribute to the background-subtracted voltammograms. Indeed, nonfaradaic and faradaic currents have been seen in background-subtracted voltammograms taken during pH changes, as H+ plays a critical role in the redox reaction of surface-bound, quinone-like species and appears to alter the double layer.15,17−19 Additionally, an array of nonelectroactive species, including metal cations (e.g., Ca2+) and organic molecules, has been shown to adsorb to carbon microelectrodes, generating signals attributable to double-layer alteration.12,18,20 These latter signals are largely nonspecific, limiting their analytical utility.
A number of methods have been explored to deal with these background currents with fast-scan voltammetric data analysis. Early attempts by Millar and colleagues relied on the use of alternative waveforms (multiple triangular cycles or sine waves) aimed at exploiting the differential response of faradaic and nonfaradaic current to repeated sweep applications or voltage shifts.21−23 Later, Fourier domain analysis was attempted, relying on the unique spectral signatures of the nonfaradaic current for its identification and removal.24,25 Such approaches, while useful, typically required changes in the measurement protocol, complicating analysis of the voltammetric signal of interest. For direct analysis of multicomponent FSCV data, principal component regression has also been employed with incorporation of pH and background changes into the model to study dopamine concentration changes over extended time windows.26−28 However, this approach requires consistency of signal shape over time and is poorly characterized for ionic interferences. More recently, Atcherley et al. showed successful measurement of basal levels of dopamine using fast-scan controlled adsorption voltammetry, which relies on the use of previously measured CVs in conjunction with convolution for minimization of the nonfaradaic current.29 Additionally, Yoshimi and Weitemier also reported on the use of chronoamperometry to separate temporally the nonfaradaic currents due to pH changes from the faradaic currents of dopamine oxidation.20
Here, we build on this prior work to explore the origin of the background current seen at carbon-fiber microelectrodes and develop a novel method for its mitigation. First, the specific FSCV signals seen during local ion concentration changes (e.g., those of the major cations found in extracellular solutions and FSCV calibration buffers, K+, Na+, Ca2+, and Mg2+) are revisited. This information is used to build a model of the double layer that can qualitatively account for the observed CV shapes. Further, we introduce a procedure for the prediction and removal of the nonfaradaic component of the background signal that does not require considerable changes to the measurement protocol. The method utilizes an approach similar to that suggested by Yoshimi and Weitemier in which a small amplitude step is paired with each FSCV sweep. Here, this step is used to estimate the impulse response of the electrochemical cell prior to each measurement through differentiation of the step response. The impulse response estimate is then convoluted with the triangular sweep to generate a prediction of the nonfaradaic charging current expected for the sweep application. Subtraction of the predicted charging current allows for removal of this component, diminishing artifacts that arise from changes in these contributions. This approach permits removal of some spurious signals, as will be shown for both in vitro and in vivo FSCV recordings.
Experimental Section
Instrumentation and Software
T-650 type, cylindrical carbon-fiber microelectrodes (Thornel, Amoco Corporation, Greenville, SC; pulled in glass capillaries and cut to 75–125 μm exposed lengths) were used in experimentation. After pulling, the seals of electrodes were dipped in epoxy (EPON Resin 828, Miller-Stephenson, Danbury, Connecticut) mixed with 14% w/w m-phenylenediamine (Sigma-Aldrich, St. Louis, MO) at 80 °C, briefly washed with acetone, and heated at 100 °C (5 h) and then 150 °C (at least 12 h).
Data was acquired with a commercial interface (PCI-6052, 16 bit, National instruments, Austin TX) with a personal home computer and analyzed using locally constructed hardware and software written in LabVIEW (TarHeel CV, an earlier version used for simplicity of programmatic modification, and the more user-friendly HDCV, National Instruments, Austin, TX).30 Unless otherwise noted, triangular excursions of the potential were made at a scan rate of 400 V/s and repeated at a frequency of 10 Hz. Measurements were conducted inside a grounded Faraday cage to minimize electrical noise.
Electrochemical Experiments
Flow-injection analysis experiments were performed using a syringe pump (Harvard Apparatus, Holliston, MA) operated at 0.8 mL/min using PEEK tubing (Sigma-Aldrich) connected to a pneumatically controlled six-port injection valve (Rheodyne, Rohnert Park, CA). All solutions were prepared in either PBS (137 mM NaCl, 10 mM NaH2PO4, 2.7 mM KCl, and 2 mM K2H2PO4) or tris(hydroxymethyl)aminomethane (TRIS) buffer (2.0 mM Na2SO4, 1.25 mM NaH2PO4·H2O, 140 mM NaCl, 3.25 KCl, 1.2 mM CaCl2·2H2O, 1.2 mM MgCl2·6H2O, and 15 mM Trizma HCl) adjusted to pH 7.4 with NaOH as necessary. Dopamine solutions were bubbled under nitrogen to prevent oxidative degradation prior to use. Electrochemical conditioning of the carbon fiber was achieved through repeated voltammetric sweeps to +1.3 V vs Ag/AgCl to increase the surface concentration of bound oxides.13
For convolution-based prediction, a waveform was created with a small amplitude pulse placed prior (i.e., 1–3 ms) to the triangular sweep. After measurements were complete, the data were analyzed in locally written software in LabView. The discrete derivative of the current response to the potential pulse was used to generate an estimate of the system impulse response, which was convoluted with the waveform to yield the background current prediction that was digitally subtracted from a given recording.31 For color plot generation, digital background subtraction was performed using these prediction-subtracted backgrounds. To estimate electrode capacitances at specific potentials, small amplitude triangular waves were used. The capacitance was determined as
| 1 |
where C is the capacitance, iav is the average current amplitude at the potential, v is the scan rate, and ip and in are the current amplitude on the positive and negative sweeps, respectively.
In Vivo Measurements
Male Sprague–Dawley rats from Charles River (Wilmington, MA, United States) were pair-housed on a 12/12 h light/dark cycle. Animal procedures were approved by the UNC-Chapel Hill Institutional Animal Care and Use Committee (IACUC). For anesthetized experiments, rats (300–550 g) were injected with urethane (1.5 g/kg, i.p.) and placed in a stereotaxic frame. Holes were drilled in the skull for the working and reference, with an additional three holes for the delivery of pinpricks to induce spreading depression, using coordinates (relative to bregma) from the brain atlas of Paxinos and Watson.32 The carbon-fiber microelectrode was placed in the nucleus accumbens at coordinates relative to bregma: anterior/posterior (AP) +2.2 mm, medial/lateral (ML) +1.7 mm, and dorsal/ventral (DV) −7.0 mm. The additional holes were located at: −0.8 AP, +0.8 ML; −0.8 AP, +3.2 ML; and −2.8 AP, +1.7 ML. A Ag/AgCl reference electrode was inserted in the contralateral hemisphere. For the recording presented, a pinprick was delivered using 27-G hypodermic needles at a depth of −7.5 DV approximately 2–3 mm from the recording site.
Results and Discussion
1. Background Current and Ionic Interferences at Carbon-Fiber Microelectrodes
1.1. Metal Cation Sensitivity and Voltammetric Signals in PBS Buffer
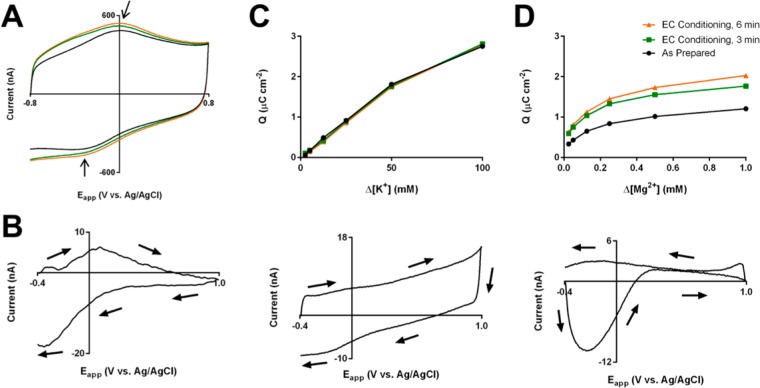
As shown in Figure 1A, the background voltammetric signal seen at carbon fiber microelectrodes in PBS (−0.8–0.8 V vs Ag/AgCl) deviates from that expected for application of a triangular voltage ramp to an ideal RC circuit.9 Peaks are seen around 0.0 and −0.3 V vs Ag/AgCl on the positive and negative sweeps, respectively, which were attributed to the two-electron, two-proton reaction of quinone-like moieties on the surface and match the location of peaks seen during an acidic pH change (Figure 1B).15 Additionally, there is a sharp asymmetry in the impedance properties of the electrode between more positive (>0.0 V) and negative potentials (<0.0 V). With electrochemical conditioning, this asymmetry grows, with relatively large changes seen at only negative potentials.
Figure 1.
FSCV signals in the absence of analytes and during ionic concentration changes in phosphate-buffered saline. (A) Total background currents for as-prepared carbon fiber microelectrodes (black) and after electrochemical conditioning for 3 and 6 min (green and orange, respectively). Arrows indicate the location of the peaks referenced in the text. (B) Background-subtracted CV (−0.4–1.0 V vs Ag/AgCl, 400 V/s, 10 Hz) for acidic pH shift (−0.15 pH units from pH 7.4) (C) Adsorption curves (2.5–100 mM, top) at each conditioning time point and representative background-subtracted CV (100 mM, bottom) for potassium injections. (D) Adsorption curves (0.025–1.0 mM, top) at each oxidation time point and representative background-subtracted CV (1.0 mM, bottom) for magnesium injections.
Of interest, these changes with conditioning correspond with sensitivity changes to electrochemically inert ionic species whose signals should originate solely from background considerations. After each conditioning interval (0, 3, and 6 min), background-subtracted cyclic voltammograms for concentration changes of KCl, NaCl, MgCl2, and CaCl2 were obtained (−0.4–1.0 V). In these data, a noticeable difference is seen between the responses seen with changes in pH (Figure 1B), other monovalent cations (Figure 1C and S-1A, bottom), and divalent cations (Figure 1D and S-1B, bottom). The origins of the peaks seen in the pH voltammogram have been extensively studied and are hypothesized to be primarily due to the direct participation of the hydrogen ion in the two-electron redox reaction of a quinone-like surface-confined moiety.17−19,33 The hydrogen ion’s role in the surface faradaic reaction makes FSCV at carbon particularly sensitive to changes in its concentration (e.g., yielding a 4.6 μC cm–2 signal for a −0.15 pH shift, or Δ[H+] = 16 nM, in Figure 1B). Other monovalent cations (i.e., K+ and Na+) gave background-subtracted signals similar to those of classical double-layer charging voltammograms at considerably higher concentrations (>1 mM). Of note, an overall slope is seen in the background-subtracted voltammograms, suggesting a resistance change linked to the large ionic strength changes at the concentrations studied. Finally, divalent cations give oxidation-responsive voltammetric signals that are prevalent at negative potentials and evoked at considerably lower concentrations (μM vs mM). These signals, which give negative peaks in the background-subtracted voltammograms, indicate a decrease in capacitance, which has previously been attributed to displacement of charge in the double layer by the divalent cation.18 Integration of the absolute current values across the entire voltammograms yield adsorption curves that are linear for non-hydrogen monovalent cations and curved for the divalent cations.
This behavior corresponds to the well-documented ion exchange capabilities of these ions. At cation exchange resins, monovalent cations are known to have interactions weaker than those of divalent cations (with ∼1–2 fold lower selectivity coefficients), leading to the former’s displacement by the latter.34−36 Here, injections of the divalent cations likely lead to ion exchange with the ambient monovalent cations at a surface functionality. Monovalent ion concentration changes, on the other hand, lead to minimal displacement of the ambient ions and require much higher concentrations to produce effects. This ion exchange functionality appears to be redox-active, giving the potential-dependence in the divalent voltammograms. Given the coincidence of potentials of the decay in the divalent voltammograms and the quinone-like faradaic peak, the working hypothesis is that the surface-bound, quinone-like species (or one with overlapping electrochemical behavior) have considerably different binding affinities for cations in the oxidized and reduced state. Indeed, quinone-containing species have been shown to have such redox-dependent metal cation affinities.37,38
To develop this further, a model was developed to simulate the expected current to a voltammetric sweep, given a surface-bound species that undergoes a reversible redox reaction and holds more charge to the surface, and thus exhibits a higher capacitance in its reduced state (Supporting Information). In this framework, the double layer (in the absence of electroactive compounds in solution) is treated as a network consisting of a voltage-dependent impedance element (ZQH, representing the quinone-like redox reaction and having a Nerstian relation to potential) and two capacitors (all in series to Rs, the solution resistance). The first capacitor (CQH*) represents the double-layer capacitance at the quinone-like surface sites. This area-normalized redox-coupled capacitance is assumed to be a linear function of the concentration of the reduced surface species (CQH(ΓQH(E))). The second capacitor (CI) is the remaining double-layer capacitance (representing the rest of the surface), which is treated as voltage-independent. Of note, such a model can qualitatively account for the shape of the background-subtracted voltammograms seen with local concentration changes in cations as well as the background voltammograms seen at carbon fibers (Figure S-8).
1.2. Metal Cation Sensitivity and Voltammetric Signals in TRIS Buffer
To explore this further in a medium more closely resembling the in vivo environment, the responses to these ionic species were also investigated in TRIS buffer, which contains ambient levels of all cations studied (145 mM Na+, 3.25 mM K+, 1.2 mM Ca2+, and 1.2 mM Mg2+). Additionally, some of the electrochemically inert TRIS is positively charged at the pH studied here (7.4) and has previously been shown to interfere with pH detection, suggesting some interaction with the quinone-like moiety. There is then expected to be considerable occupation of the binding sites prior to changes in local concentration of ionic species. Supporting this hypothesis, injections of TRIS buffer for an electrode in PBS (both at pH 7.4) show significant changes mainly in the negative region and give a divalent cation-like background-subtracted voltammogram (Figure S-2A).
Representative background-subtracted voltammograms and full voltammogram adsorption curves are shown in Figure S-2B-E. As compared to those in PBS, the divalent cation responses are considerably attenuated, as expected, given the ambient competition for the binding sites. In comparison, the monovalent cations give intermediate-type signals with behavior consistent to that seen in PBS but with increased complexity around the quinone-governed region, which is more pronounced for K+ than for Na+. However, this may be due to ambient additional species available for ion exchange.
2. Convolution-Based Prediction of Non-Faradaic Current
As discussed previously, there has been considerable work done toward the minimization of these background currents and interferences. Here, we build on these approaches to develop a novel method for removal of nonfaradaic current from FSCV recordings while retaining much of the general measurement protocol. Previously, chronoamperometry was shown to allow separation of the nonfaradaic current due to pH changes from the faradaic current of dopamine oxidation, and it was suggested that the alternation between chronoamperometry and FSCV during recording sessions would prove advantageous.20 We explored the hypothesis that the step response measured in chronoamperometry, which probes the impedance characteristics of the electrochemical cell, could be used to predict directly the nonfaradaic current seen for the triangular sweep application. To do this, the cell was considered to be a linear system, and we predicted its response for a given excitation waveform with its impulse response (i.e., the system response to a unit impulse).29,31,39 The output (y) for an arbitrary input signal (x) is given through convolution with the impulse response (h):
| 2 |
The current during voltage steps can be used to arrive at suitable estimates of the impulse response, as the derivative of the current response to the step provides an estimate of the impulse function.6,40
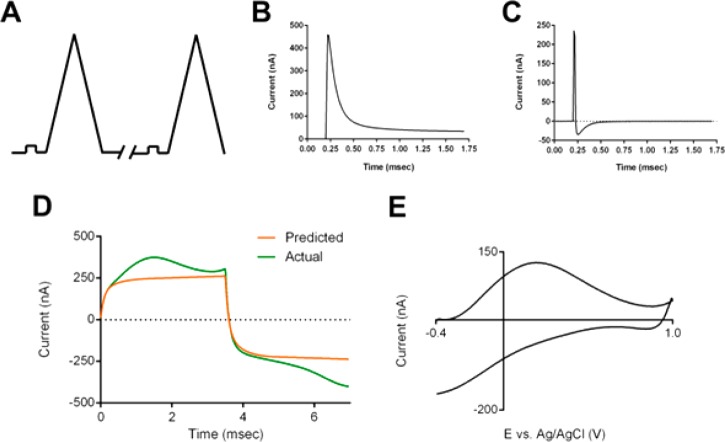
This approach requires the use of a pulse immediately before every FSCV sweep to account for changes that may occur between sweeps (Figure 2A). The current response (Figure 2B) to the step provides information on the impedance before each measurement. Due to the small amplitude of the potential step, the current response should be largely determined by the nonfaradaic characteristics of the electrochemical cell assuming appropriate choice of voltage range.9 This information is then used offline to predict the current response to the triangular FSCV sweep. Discrete differentiation of each step response is used to estimate the cell’s impulse response (Figure 2C), and this is convoluted with the FSCV waveform to generate the prediction of the nonfaradaic response (Figure 2D). In practice, even in the absence of electroactive species, residual current remains (Figure 2E, approximately 20% of the total background current). Evidence of a faradaic surface species is seen (matching background peaks previously assigned to the redox reaction of quinone-like moieties) as well as some unexplained current at positive potentials. However, these prediction-subtracted total voltammograms can be used with digital background subtraction to generate background-subtracted voltammograms with attenuated nonfaradaic interferences.
Figure 2.
Convolution-based approach for removal of ionic artifacts. (A) Waveform used for measurements with a small-amplitude prepulse placed in front of every FSCV sweep. (B) Typical step response measured at carbon-fiber microelectrode. (C) Typical impulse response estimate obtained from the discrete differentiation of the step response in panel B. (D) Figure showing a measured background current (green) and the corresponding prediction (orange) generated using convolution of the impulse estimate in panel C with the FSCV waveform. (E) Residual current after subtraction of the prediction for the data shown in panel D.
3. Convolution-Based Removal of Ionic Signals
3.1. In Vitro Separation of Ionic and Dopamine Voltammetric Signals
The convolution procedure is appropriate for linear systems and assumes the impedance is independent of potentials. Thus, this technique should work well for removal of currents where the main interaction is with the voltage-independent capacitance, like for those of the monovalent cations described above. To test this hypothesis, the flow-injection analysis of dopamine, sodium, and their mixture in TRIS buffer was performed using a waveform with a voltage step from −0.5 to −0.4 V vs Ag/AgCl (Figures 3A–C). The method, while not drastically altering the shape of the pure dopamine voltammogram (Figure 3A), can successfully remove contributions to the current at the dopamine oxidation potential from an injection of TRIS buffer spiked with 100 mM sodium (Figure 3B). This allows removal of the bulk of the sodium signal in the analysis of the dopamine–sodium mixture, permitting the use of the dopamine oxidation potential as a direct marker of dopamine concentration in a mixture of dopamine and sodium (Figure 3C). Note that, due to their nonlinear responses, neither the quinone-like peaks nor the divalent cation signals can be removed in this way. Further, the potentials where the quinone-like moiety redox reaction occurs should not be used for this method, as use of this information would lead to inaccurate predictions.
Figure 3.
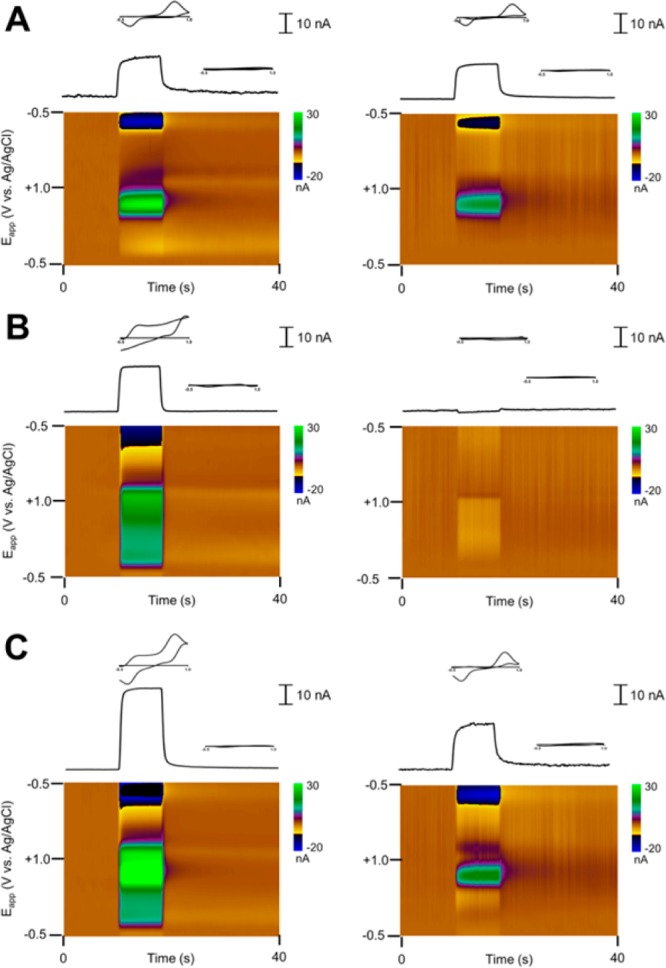
Removal of artifacts arising from Na+ concentration changes in TRIS buffer. Data before (left) and after (right) the convolution-based treatment for an injection of a DA (A, Δ[DA] = 1 μM) and NaCl-spiked solution (B, Δ[Na] = 100 mM) and their mixture (C), showing background-subtracted color plots (bottom) and the current–time traces at the dopamine oxidation potential (top) with cyclic voltammograms taken during and after the injection positioned above.
3.2. In Vivo Analysis of Dopamine during Spreading Depression
Spreading depression is a neurobiological phenomenon in which there is a mass depolarization of neurons, leading to a considerable shift in the ionic balance between the intracellular and extracellular spaces.41−43 Millimolar changes in the concentrations of common extracellular ions (e.g., ∼100 mM K+, ∼ 33 mM Na+, and ∼1.5 mM Ca2+), along with the concomitant release of neurotransmitters (e.g., dopamine), are expected. However, attempts to track the dopamine release using FSCV are confounded by the ionic shifts, which produce large capacitive artifacts in the obtained CVs (Figure 4A, −0.4–1.3 V), which resemble those seen for changes in the voltage-independent capacitance and local resistance.
Figure 4.
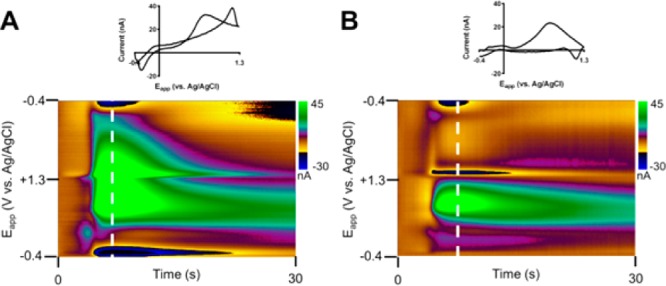
In vivo analysis of supraphysiological release of neurotransmitters during a spreading depression event using the convolution-based method. (A) Uncorrected background-subtracted cyclic voltammogram (top) and color plot (bottom) at 7 s into the recording. (B) Same cyclic voltammogram (top) and color plot (bottom) after use of the convolution-based method for removal of capacitive artifacts. Note that the step portion of the waveform is not shown in the color plots. A single pinprick (−7.5 DV, 2–3 mm away from the recording site) was delivered prior to this recording.
Using the convolution-based procedure, the capacitive artifacts are removed to obtain a cleaner picture of the dopamine changes over time (Figure 4B). Examination of the CVs before and after correction (bottom) reveals the method successfully removes strong artifacts around the switching potential as well as removes considerable current across the potential window. Note also that there remains a slight artifact on the negative sweep; this is attributed to differences in the impedance characteristics across the potential window. However, the artifact is considerably smaller than prior to correction. Thus, analysis of the time course of dopamine release has been considerably simplified with such an approach.
3.3. In Vitro Flow-Injection Analysis of Dopamine
As noted earlier, adsorption of organic species can also lead to capacitive artifacts. Of interest, these are seen during flow-injection experiments of dopamine, particularly at high concentration, including in recordings of dopamine during the earlier oxidation experiment (Figure S-3). Dopamine adsorption to carbon surfaces is well-characterized and has been shown to underlie the sensitivity of FSCV at carbon-fiber microelectrodes toward catecholamines.12,13 Of note, these artifacts are more prevalent in the negative region of the potential window, suggesting these originate from interactions similar to the divalent cations shown earlier. Interestingly, it has been previously reported that the presence of calcium and magnesium decrease the sensitivity of FSCV toward dopamine.44 Here, in their presence (i.e., in TRIS buffer), the absorption capacity and the intensity of the artifact are indeed decreased, suggesting that adsorption competition for the quinone-like moiety may underlie these effects.
The convolution-based technique was applied to mitigate the effects of these artifacts for an extended recording of multiple, closely spaced injections of dopamine boluses at a carbon-fiber electrode (Figure 5A) in PBS buffer. With a single background subtraction for this time window, distortions appear over time, both during the dopamine injections and during later measurement times. However, without correction for these contributions, the use of the dopamine peak oxidation potential as an indicator of concentration would suggest that the electrode sensitivity is decreasing over time (Figure 5C, top), while there is a change in the baseline dopamine current.
Figure 5.
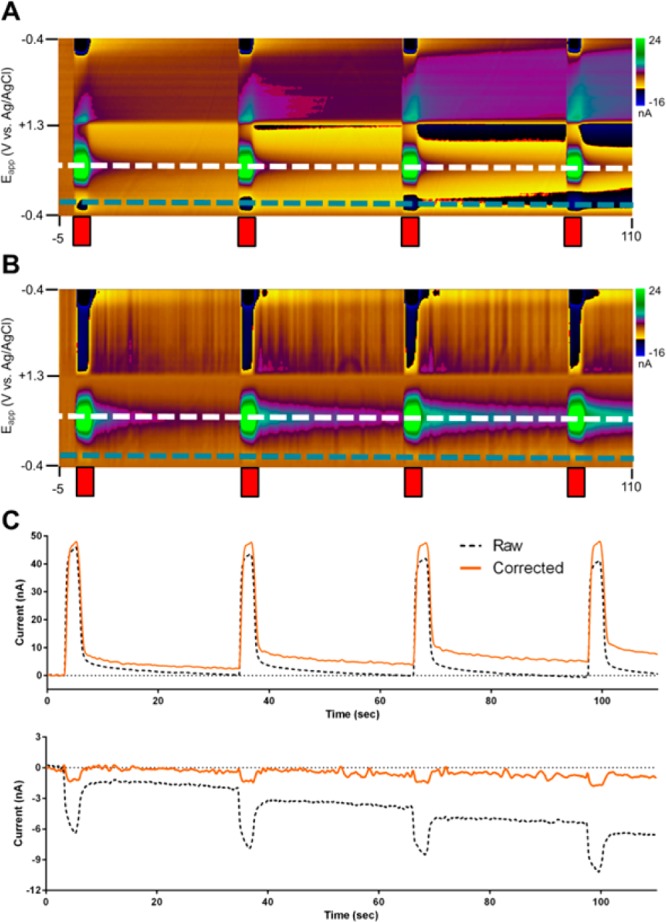
Convolution-based correction of flow-cell analysis of dopamine in PBS buffer. Dopamine (250 nM) was injected every 30 s (red bars). (A) Uncorrected and (B) corrected background-subtracted color plots. (C) Current at the dopamine oxidation potential (top, white dashed lines in A/B) and capacitive interferent potential (bottom, blue dashed lines in A/ B).
These capacitive artifacts, particularly those on the positive sweep, are removed from the data using the convolution-based procedure (Figure 5B). In the corrected data, the peak current during dopamine injections does not show evidence of baseline drift, and the peak current shows no significant differences between subsequent injections (Figure 5C, top). This is supported by analysis of the current at −0.3 V vs Ag/AgCl on the positive sweep (Figure 5C, bottom), where the current is largely determined by capacitive effects.
Overall, these results suggest that the increases in dopamine concentration were leading to capacitive changes at the electrode, which is expected at the large (by physiological standards) concentrations used in the experiment (250 nM). Additionally, due to the slow desorption kinetics of dopamine and the short injection spacing, there was insufficient time for complete desorption of dopamine between injections.12,45 This would lead to a buildup of surface concentration and a steady drift in the capacitive characteristics throughout the recording window, an insight that would be difficult to reveal without the convolution-based approach.
4. Optimization and Validation of Convolution-Based Approach
4.1. Optimization of Measurement Parameters
The idealized response to the application of a voltage step is a single-order exponential curve.9 At carbon-fiber microelectrodes, an exponential-like decay is observed. However, it appears to be multiorder (Figure S-4), with an extracted single-order time constant about an order of magnitude larger than that expected for a cylindrical carbon electrode in aqueous solutions (RC = 39.2 vs 4.5 μs).46,47 While not characterized further, this may be due to nonideal impedance behavior (including the effects of the microstructure and internal resistance of the carbon fiber)48,49 or stray impedance contributions from the instrumentation. Of note, cyclic voltammetric pseudocapacitance measurements (Figure S-5) reveal a distribution of apparent capacitances in the range of 20–40 μF cm–2, close to that reported for edge-plane carbon (although these measurements have clear Faradaic contributions, likely from the quinone-like moiety), suggesting that this is not the source of the nonideality.11 However, despite the departure from idealized responses, the convolution-based approach is nevertheless effective.
Of interest here, however, is the effect of the measurement parameters (i.e., step height and step width). The convolution theorem states that the time domain convolution is equivalent to pointwise multiplication in the frequency domain.39 Therefore, insight can be gained through analysis of the collected data in both the time and frequency domains (Figure S-6).
Concerning step height, smaller perturbations are preferred, as they probe the impedance characteristics of the electrochemical cell with minimal perturbation. However, the effect of noise needs to be considered, as the discrete derivative is a high-pass filter. This becomes important when considering that FSCV waveforms are typically low-pass filtered (most often with a cutoff frequency of 2 kHz). Such filtering distorts rapid potential changes, and higher cutoff frequencies are required (increasing noise in the data).50 As such, a trade-off exists: larger pulses improve signal-to-noise while perturbing the system more and requiring stronger consideration of the instrumentation used. Here, we consider the practical implications for the instrumentation (described in ref (47)) common for in vivo FSCV. Figure S-7 shows the current responses in PBS for applications of voltage steps between 20 and 200 mV as well as the resulting impulse response estimations in the time and frequency domains. While lower S/N ratios are seen for smaller step sizes, increasing step height brings a flattening of the current response and distortion of the impulse response estimates (likely due to the passive components used for current transduction in the headstage).51 When used for prediction, larger pulses can result in distortion around the switching potentials of the waveform, where the high frequency impedance dominates. However, smaller pulses are inadequate for measuring the low-frequency impedance, resulting in errors that increase with potential away from the step voltage region. Analysis of the average predictions and their variance, given by 20 and 200 mV pulses for 5-second recordings (Figure S-7F), reveal nearly identical average predictions but considerably higher uncertainty for more removed potentials with smaller pulses. Use of moderate step sizes (80–120 mV), where both of these issues are minimized, is thus recommended.
The pulse width is determined by the frequency range about which information is needed.40,52 Ideally, a Heaviside step function would be used to give information on all frequencies; however, the step must be limited. For application of a step, an ideal RC circuit would decay to 99.3% over a period equal to 5 times the RC time constant (for reference, 5RC = 196 and 22.5 μs for the experimental value from Figure S-4 and the theoretical value, respectively). Thus, to be conservative, the lower bound was placed at 25 time constants (here, 1 ms).
4.2. Comparison with Principal Component Regression
The current standard for resolving overlapping signals in FSCV is the use of multivariate analysis, specifically principal component regression (PCR).26,28,53 Combined with residual analysis, PCR has proven a powerful tool for dealing with chemical interferents. To compare the results of the convolution-based method here with the established PCR paradigm, separate data were recorded for the flow-injection analysis of a mixture of dopamine (200 nM) and potassium chloride (120 mM) solutions in phosphate-buffered saline. For this experiment, training sets were also built from injections of solutions of pure dopamine and pure potassium chloride at different concentrations. The data were then analyzed in three different ways. First, PCR models, constructed using either only dopamine standards (approach 1) or dopamine and potassium chloride standards (approach 2), were applied to the data. Next, the convolution-based method was first used to pretreat the data, after which it was analyzed using a PCR model consisting solely of the dopamine standards (approach 3).
The current vs time traces for the three different approaches are shown in Figure 6. As expected, analysis of the untreated data with a dopamine-only model (approach 1) resulted in a considerable overestimate (about 4-fold) of the dopamine concentration over time (dotted line), due to improper assignment of potassium signal to dopamine (as indicated by the failure of residual analysis, not shown). However, comparable results are obtained with the PCR-only (approach 2, green) and convolution/PCR approach (approach 3, orange), with only slight differences in the peak concentrations predicted and more noise seen for the latter approach.
Figure 6.
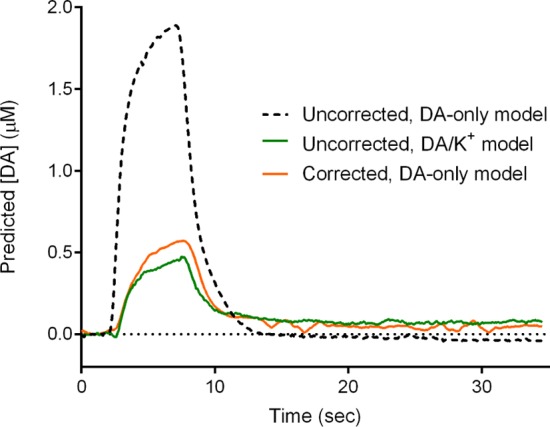
Comparison of convolution-based and PCR-only removal of ionic artifacts. The PCR predicted concentration traces for flow injection analysis of a mixture 500 nM dopamine and 120 mM potassium chloride (in PBS buffer) for the uncorrected data analyzed with a PCR model trained with only dopamine standards (dashed line) and dopamane/potassium chloride standards (green line) as well as the corrected data analyzed using PCR model containing only dopamine (orange line).
While giving similar results, the true advantage of the convolution-based approach lies in the experimental simplicity. As noted, to build the PCR model with both analytes, multiple standards were needed for each, requiring additional experimental work. The use of the convolution-based approach required only collection of the dopamine standards and the use of the pulse during measurements. Further, in vivo PCR model building is considerably harder, requiring a method for eliciting the interferent responses. Currently, there are no established protocols for generating ionic changes for this purpose.
Conclusions
The data presented here suggest two main types of ionic interactions with carbon fibers exposed to moderate oxidation, which determine the shape of the voltammetric responses seen with local ion concentration changes. Using this framework, we designed a measurement protocol to remove interference with voltammetric detection of electroactive species from the voltage-independent capacitance, building on previous literature approaches. This method uses a small-amplitude pulse coupled to a voltage sweep for probing and predicting the nonfaradaic behavior of the electrode. It was successfully able to remove interfering signals arising from interaction with the voltage-independent capacitance. Work is currently underway to find ways of minimizing the other types of ionic interferences.
Acknowledgments
This research was supported by grants from NIH to R.M.W. (DA 10900 and DA032530).
Supporting Information Available
The Supporting Information is available free of charge on the ACS Publications website at DOI: 10.1021/acs.analchem.7b01005.
Background-subtracted FSCV signals for Na+/Ca2+ (PBS, S-1), Na+/K+/Ca2+/Mg2+ (TRIS, S-2), and dopamine (PBS/TRIS, S-3) concentration changes; one-phase exponential decay fit to voltage step (S-4); small-amplitude CV pseudocapacitance measurements (S-5); power spectra for triangular voltage wave and impulse response (S-6); data showing effect of step size on convolution-based prediction (S-7) for different voltage step amplitudes; derivation and simulation (S-8) of background currents at carbon-fiber microelectrodes (PDF)
The authors declare no competing financial interest.
Supplementary Material
References
- Phillips P. E.; Stuber G. D.; Heien M. L.; Wightman R. M.; Carelli R. M. Nature 2003, 422, 614–618. 10.1038/nature01476. [DOI] [PubMed] [Google Scholar]
- Dankoski E. C.; Agster K. L.; Fox M. E.; Moy S. S.; Wightman R. M. Neuropsychopharmacology 2014, 39, 2928–2937. 10.1038/npp.2014.162. [DOI] [PMC free article] [PubMed] [Google Scholar]
- Bucher E. S.; Wightman R. M. Annu. Rev. Anal. Chem. 2015, 8, 239–261. 10.1146/annurev-anchem-071114-040426. [DOI] [PMC free article] [PubMed] [Google Scholar]
- Fox M. E.; Rodeberg N. T.; Wightman R. M. Neuropsychopharmacology 2017, 42, 671. 10.1038/npp.2016.135. [DOI] [PMC free article] [PubMed] [Google Scholar]
- Owesson-White C.; Belle A. M.; Herr N. R.; Peele J. L.; Gowrishankar P.; Carelli R. M.; Wightman R. M. J. Neurosci. 2016, 36, 6011–6021. 10.1523/JNEUROSCI.0393-16.2016. [DOI] [PMC free article] [PubMed] [Google Scholar]
- Kawagoe K. T.; Wightman R. M. Talanta 1994, 41, 865–874. 10.1016/0039-9140(94)E0064-X. [DOI] [PubMed] [Google Scholar]
- Baur J. E.; Kristensen E. W.; May L. J.; Wiedemann D. J.; Wightman R. M. Anal. Chem. 1988, 60, 1268–1272. 10.1021/ac00164a006. [DOI] [PubMed] [Google Scholar]
- Howell J. O.; Kuhr W. G.; Ensman R. E.; Wightman R. M. J. Electroanal. Chem. Interfacial Electrochem. 1986, 209, 77–90. 10.1016/0022-0728(86)80187-5. [DOI] [Google Scholar]
- Bard A. J.; Faulkner L. R.. Electrochemical Methods: Fundamentals and Applications, 2nd ed.; John Wiley & Sons: New York, NY, 2001. [Google Scholar]
- Zachek M. K.; Hermans A.; Wightman R. M.; McCarty G. S. J. Electroanal. Chem. (Lausanne) 2008, 614, 113–120. 10.1016/j.jelechem.2007.11.007. [DOI] [PMC free article] [PubMed] [Google Scholar]
- McCreery R. L. Chem. Rev. 2008, 108, 2646–2687. 10.1021/cr068076m. [DOI] [PubMed] [Google Scholar]
- Bath B. D.; Michael D. J.; Trafton B. J.; Joseph J. D.; Runnels P. L.; Wightman R. M. Anal. Chem. 2000, 72, 5994–6002. 10.1021/ac000849y. [DOI] [PubMed] [Google Scholar]
- Heien M. L.; Phillips P. E.; Stuber G. D.; Seipel A. T.; Wightman R. M. Analyst 2003, 128, 1413–1419. 10.1039/b307024g. [DOI] [PubMed] [Google Scholar]
- Takmakov P.; Zachek M. K.; Keithley R. B.; Walsh P. L.; Donley C.; McCarty G. S.; Wightman R. M. Anal. Chem. 2010, 82, 2020–2028. 10.1021/ac902753x. [DOI] [PMC free article] [PubMed] [Google Scholar]
- Kawagoe K. T.; Garris P. A.; Wightman R. M. J. Electroanal. Chem. 1993, 359, 193–207. 10.1016/0022-0728(93)80409-B. [DOI] [Google Scholar]
- Jones S. R.; Mickelson G. E.; Collins L. B.; Kawagoe K. T.; Wightman R. M. J. Neurosci. Methods 1994, 52, 1–10. 10.1016/0165-0270(94)90048-5. [DOI] [PubMed] [Google Scholar]
- Runnels P. L.; Joseph J. D.; Logman M. J.; Wightman R. M. Anal. Chem. 1999, 71, 2782–2789. 10.1021/ac981279t. [DOI] [PubMed] [Google Scholar]
- Takmakov P.; Zachek M. K.; Keithley R. B.; Bucher E. S.; McCarty G. S.; Wightman R. M. Anal. Chem. 2010, 82, 9892–9900. 10.1021/ac102399n. [DOI] [PMC free article] [PubMed] [Google Scholar]
- Dengler A. K.; Wightman R. M.; McCarty G. S. Anal. Chem. 2015, 87, 10556–10564. 10.1021/acs.analchem.5b02866. [DOI] [PMC free article] [PubMed] [Google Scholar]
- Yoshimi K.; Weitemier A. Anal. Chem. 2014, 86, 8576–8584. 10.1021/ac500706m. [DOI] [PubMed] [Google Scholar]
- Stamford J. A.; Kruk Z. L.; Millar J. J. Neurosci. Methods 1984, 10, 107–118. 10.1016/0165-0270(84)90064-5. [DOI] [PubMed] [Google Scholar]
- Millar J.; Williams G. V. J. Electroanal. Chem. Interfacial Electrochem. 1991, 282, 33–49. 10.1016/0022-0728(91)85088-7. [DOI] [Google Scholar]
- Millar J.; O’Connor J. J.; Trout S. J.; Kruk Z. L. J. Neurosci. Methods 1992, 43, 109–118. 10.1016/0165-0270(92)90020-E. [DOI] [PubMed] [Google Scholar]
- Long J. T.; Weber S. G. Electroanalysis 1992, 4, 429–437. 10.1002/elan.1140040408. [DOI] [Google Scholar]
- Cullison J. K.; Kuhr W. G. Electroanalysis 1996, 8, 314–319. 10.1002/elan.1140080403. [DOI] [Google Scholar]
- Keithley R. B.; Heien M. L.; Wightman R. M. TrAC, Trends Anal. Chem. 2009, 28, 1127–1136. 10.1016/j.trac.2009.07.002. [DOI] [PMC free article] [PubMed] [Google Scholar]
- Keithley R. B.; Wightman R. M. ACS Chem. Neurosci. 2011, 2, 514–525. 10.1021/cn200035u. [DOI] [PMC free article] [PubMed] [Google Scholar]
- Rodeberg N. T.; Johnson J. A.; Cameron C. M.; Saddoris M. P.; Carelli R. M.; Wightman R. M. Anal. Chem. 2015, 87, 11484–11491. 10.1021/acs.analchem.5b03222. [DOI] [PMC free article] [PubMed] [Google Scholar]
- Atcherley C. W.; Laude N. D.; Parent K. L.; Heien M. L. Langmuir 2013, 29, 14885–14892. 10.1021/la402686s. [DOI] [PubMed] [Google Scholar]
- Bucher E. S.; Brooks K.; Verber M. D.; Keithley R. B.; Owesson-White C.; Carroll S.; Takmakov P.; McKinney C. J.; Wightman R. M. Anal. Chem. 2013, 85, 10344–10353. 10.1021/ac402263x. [DOI] [PMC free article] [PubMed] [Google Scholar]
- Bracewell R. N.The Fourier transform and its applications, 3rd ed.; McGraw Hill: Boston, 2000, p 616. [Google Scholar]
- Paxinos G.; Watson C.. The Rat Brain in Stereotaxic Coordinates; Academic Press: San Diego, CA, 1998. [Google Scholar]
- Karweik D. H.; Hu I. F.; Weng S.; Kuwana T. ACS Sym. Ser. 1985, 288, 582–595. 10.1021/bk-1985-0288.ch048. [DOI] [Google Scholar]
- Haddad P. R.; Jackson P. E.. Ion Chromatography: Priniciples and Applications; Elsevier: Amsterdam, 1990; Vol. 46. [Google Scholar]
- Fritz J. S.; Gjerde D. T.. Ion Chromatography, 3rd ed.; Wiley-VCH: New York, 2000. [Google Scholar]
- Walton H. F. In Chromatography: Fundamentals and Applications of Chromatography and Related Differential Migration Methods, Heftmann E., Ed.; Elsevier: Amsterdam, 1992. [Google Scholar]
- Lee H.; Scherer N. F.; Messersmith P. B. Proc. Natl. Acad. Sci. U. S. A. 2006, 103, 12999–13003. 10.1073/pnas.0605552103. [DOI] [PMC free article] [PubMed] [Google Scholar]
- Kim Y. J.; Wu W.; Chun S. E.; Whitacre J. F.; Bettinger C. J. Adv. Mater. 2014, 26, 6572–6579. 10.1002/adma.201402295. [DOI] [PubMed] [Google Scholar]
- Manolakis D. G.; Ingle V. K.. Applied digital signal processing: theory and practice; Cambridge University Press: New York, 2011. [Google Scholar]
- Chang B. Y.; Park S. M. Annu. Rev. Anal. Chem. 2010, 3, 207–229. 10.1146/annurev.anchem.012809.102211. [DOI] [PubMed] [Google Scholar]
- Kraio R. P.; Nicholson C. Neuroscience 1978, 3, 1045–1059. 10.1016/0306-4522(78)90122-7. [DOI] [PubMed] [Google Scholar]
- Nicholson C.; Kraig R. P.; Bruggencate G. T.; Stockle H.; Steinberg R. Arzneimittelforschung 1978, 28, 874–875. [PubMed] [Google Scholar]
- Rogers M. L.; Feuerstein D.; Leong C. L.; Takagaki M.; Niu X.; Graf R.; Boutelle M. G. ACS Chem. Neurosci. 2013, 4, 799–807. 10.1021/cn400047x. [DOI] [PMC free article] [PubMed] [Google Scholar]
- Kume-Kick J.; Rice M. E. J. Neurosci. Methods 1998, 84, 55–62. 10.1016/S0165-0270(98)00087-9. [DOI] [PubMed] [Google Scholar]
- Venton B. J.; Troyer K. P.; Wightman R. M. Anal. Chem. 2002, 74, 539–546. 10.1021/ac010819a. [DOI] [PubMed] [Google Scholar]
- Wightman R. M.; Wipf D. O. In Electroanalytical Chemistry, Bard A. J., Ed.; Marcel Dekker: New York, 1989. [Google Scholar]
- Michael A. C.; Wightman R. M. In Laboratory Techniques in Electroanalytical Chemistry, Kissinger P. T., Ed.; Marcel Dekker: New York, 1996. [Google Scholar]
- Kim C.-H.; Pyun S.-I.; Kim J.-H. Electrochim. Acta 2003, 48, 3455–3463. 10.1016/S0013-4686(03)00464-X. [DOI] [Google Scholar]
- Lambie B. A.; Brennan C.; Olofsson J.; Orwar O.; Weber S. G. Anal. Chem. 2007, 79, 3771–3778. 10.1021/ac062045+. [DOI] [PMC free article] [PubMed] [Google Scholar]
- Keithley R. B.; Takmakov P.; Bucher E. S.; Belle A. M.; Owesson-White C. A.; Park J.; Wightman R. M. Anal. Chem. 2011, 83, 3563–3571. 10.1021/ac200143v. [DOI] [PMC free article] [PubMed] [Google Scholar]
- Takmakov P.; McKinney C. J.; Carelli R. M.; Wightman R. M. Rev. Sci. Instrum. 2011, 82, 074302. 10.1063/1.3610651. [DOI] [PMC free article] [PubMed] [Google Scholar]
- Jurczakowski R.; Lasia A. Anal. Chem. 2004, 76, 5033–5038. 10.1021/ac0493929. [DOI] [PubMed] [Google Scholar]
- Rodeberg N. T.; Johnson J. A.; Bucher E. S.; Wightman R. M. ACS Chem. Neurosci. 2016, 7, 1508–1518. 10.1021/acschemneuro.6b00142. [DOI] [PMC free article] [PubMed] [Google Scholar]
Associated Data
This section collects any data citations, data availability statements, or supplementary materials included in this article.


