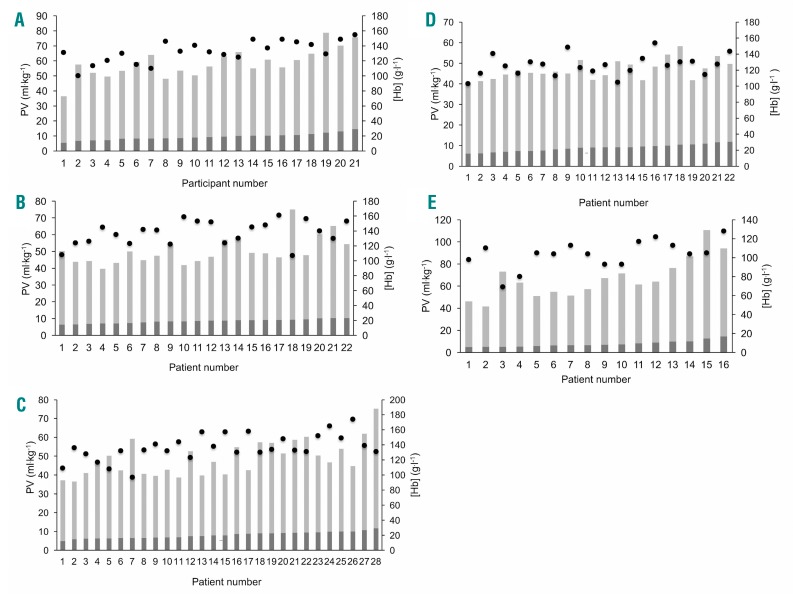
Figure 5.
Individual participant data for total hemoglobin mass, plasma volume and hemoglobin concentration. Participants ranked by tHb-mass (g.kg−1) (dark gray bars) from smallest to largest with corresponding PV (ml.kg−1) (light gray bars) and [Hb] (g.l−1) (black circles) in healthy volunteers (A), inflammatory bowel disease (B), surgical (C), chronic heart failure (D), and chronic liver disease (E). PV: plasma volume; [Hb]: hemoglobin concentration.

