

Abstract
Social interaction is a fundamental behavior in all animal species, but the developmental timing of the social neural circuit formation and the cellular and molecular mechanisms governing its formation are poorly understood. We generated a mouse model with mutations in two Dishevelled genes, Dvl1 and Dvl3, that displays adult social and repetitive behavioral abnormalities associated with transient embryonic brain enlargement during deep layer cortical neuron formation. These phenotypes were mediated by the embryonic expansion of basal neural progenitor cells (NPCs) via deregulation of a β-catenin/Brn2/Tbr2 transcriptional cascade. Transient pharmacological activation of the canonical Wnt pathway during this period of early corticogenesis rescued the β-catenin/Brn2/Tbr2 transcriptional cascade and the embryonic brain phenotypes. Remarkably, this embryonic treatment prevented adult behavioral deficits and partially rescued abnormal brain structure in Dvl mutant mice. Our findings define a mechanism that links fetal brain development and adult behavior, demonstrating a fetal origin for social and repetitive behavior deficits seen in disorders such as autism.
Introduction
Social interaction is a fundamental behavior found in nearly all organisms. Uncovering the developmental mechanisms and genetic pathways governing social behavior is essential for understanding pathophysiological processes that may lead to the development of treatments for neuropsychiatric disorders that display social interaction abnormalities. Social behaviors result from extensive cognitive processes such as obtaining, retrieving, and processing information about the lives, relationships, and mental states of others. The cerebral cortex is responsible for integrating this complex information from multiple brain networks in order to respond to complex social behaviors1. As social interaction behaviors become more complex, the related regions in the frontal cortex become more active, reflecting the transfer of information processing from automatic to cognitive processes1, 2. Thus, it is likely that abnormal brain development can cause long-term alterations in brain circuitry that may later manifest in behavioral affective disorders in the adult3.
During cerebral cortical development, neuronal progenitor cells (NPCs) in the cerebral cortex undergo temporally and spatially coordinated proliferation, differentiation into neurons, and migration to their final destination, where they will form functional contacts with other neurons to form neuronal circuits (reviewed in4). The highly conserved Wnt/wingless signaling cascades regulate many of the processes involved in cortical development, including proliferation, differentiation and migration5, 6. Wnt signals are relayed from the receptors to the downstream effectors by scaffold proteins of the Dvl family. Wnt signals can be transduced through multiple pathways, including canonical Wnt/β-catenin, planar cell polarity (PCP), and Wnt/Ca2+ cascades. The canonical WNT pathway plays a role in the development and patterning of the brain. Dvl can convert naive ectoderm into neural tissue in Xenopus7. In addition, WNT signaling via Dvl, posteriorizes neural ectoderm, generating an anteroposterior pattern in the central nervous system8. Dvl also appears to be important for later events in neural development, governing the morphology, differentiation and function of neurons in vertebrates9–11.
Dvl1-null mice (Dvl1−/−) exhibit abnormal social interaction behaviors and defects in prepulse inhibition of startle12, 13. No gross pathological abnormalities were previously detected in the brains of adult Dvl1−/− mice that could account for their behavioral phenotypes12. It is possible that Dvl1−/− mice have a subtle brain phenotype, due to the known functional redundancy among the Dvl genes14. Another possible explanation is that transient brain abnormalities are present during development that impact adult brain function. Thus, we hypothesized that the study of Dvl double mutants may unravel the subtle developmental pathological abnormalities in the Dvl1−/− mice. To test this hypothesis, we generated Dvl1−/−3+/− mutant mice and uncovered transient fetal brain growth abnormality that was associated with increase in NPCs proliferation and premature differentiation. These embryonic phenotypes were regulated by a novel transcriptional mechanism downstream of canonical Wnt signaling that links fetal brain development with adult social behavior and structural brain defects.
Material and Methods
Mice
All animal care and experiments were performed under protocols approved by UCSF Institutional Animal Care and Use Committee. We generated Wild-type (WT); Dvl3+/−; Dvl1−/− and Dvl1−/−3+/− mice on the 129S6 background by mating WT with Dvl3+/− and Dvl1−/− with Dvl1−/−; 3+/− mice14. BAT-gal mice on the 129 background15 were crossed with the Dvl mutants to generate the BAT-gal Dvl mutant mice. Genotyping for all the mouse strains used were previously described14. Brn2 mutant mice16 were maintained on C57BL/6 mice background as heterozygotes and genotyping for the Brn2 mutants were previously described16. For rescue experiments WT and Dvl1−/− and Dvl1−/−3+/− dams were IP injected daily from E9.5 to E14.5 with 4mg/kg CHIR99021, a potent and highly selective inhibitor of glycogen synthase kinase 317 (Tocris), which was dissolved according to manufacturer’s instructions (4mM DMSO in PBS). The CHIR99021 delivery regime was chosen to maximize effectiveness of the compound taking into consideration diffusion to the target and induction of the normalization of the transcriptional cascade that requires two steps of transcriptional regulation. For BrdU incorporation experiments WT and Dvl1−/− and Dvl1−/−3+/− dams were IP injected 60 min prior embryos collection with 40μg of BrdU per g of mouse weight. The experimental data from each genotype was generated from at least 3 litters. Mice were housed in standard cages and maintained on a 12:12 h light/dark cycle at 22°C. All testing occurred during the light portion of the cycle.
Behavioral analysis
Wild-type, Dvl1−/− and Dvl1−/−3+/− mice (129S6 background) were subjected to a behavioral phenotyping battery18. Briefly, several behavioral and physical features of the mice were assessed. Next, with the use of a cotton-tipped applicator, each mouse was assessed for several sensorimotor reflexes and its response to an approaching object. Finally, several postural reflexes were also assessed.
A separate cohort of wild-type, Dvl1−/− and Dvl1−/−3+/− mice, and a third cohort of CHIR99021 and mock treated mice were subjected to: nest building, open field, three chamber social approach and marble burying. Mice were 6 weeks of age at the start of the home cage nesting behavioral testing. Mice were transferred to the Gladstone behavioral facility and allowed one week to habituate before behavioral testing began. The open field task was conducted first followed by three-chambered social approach task then finally marble burying task was perfomed. Time between the two tasks ranged from 2 days to 6 days. Behavioral testing was conducted in dedicated behavioral testing rooms during the standard light phase, usually between 1000 h and 1500 h. All procedures were approved by the Gladstone Institute and the UCSF Animal Care and Use committee.
Nesting
Nest building activity was assessed in their home cages, 3–4 mice per cage. On the day of the testing a clean cage with equal amounts of bedding and a 5×5cm piece of commercial nesting pad (Ancare, Bellmore, NY) was placed in the cage. Assessments were made at 20, 40, 60 min and 24hours. At each time point the activity of the mice and an estimate of percentage of chewed nestlet were recorded. The depth of the thickest part of the nest was measured.
Open field
General exploratory locomotion in a novel open field environment was assayed as previously described 18. Briefly, mice were transferred to the testing room and acclimated for at least one hour. Individual mice were placed in a standard Photobeam Activity System (PAS) open field apparatus (San Diego Instruments, San Diego, CA, USA). Test chambers consisted of clear Plexiglas sides and floor, approximately 40 × 40 × 30.5 cm. Mice were placed in the center of the open field at the initiation of the testing session. Photocells at standard heights for recording activity were aligned 16 to a side detecting horizontal and vertical activity. Total distance, horizontal activity, vertical activity, and center time were automatically collected using PAS software. Test chambers were cleaned with 30% ethanol between test subjects. At least five minutes between cleaning and the start of the next session was allowed for ethanol evaporation and odor dissipation.
Social approach
Social approach was assayed in a three-chambered apparatus using methods previously described19. Briefly, the apparatus was a rectangular, three-chambered box made of opaque white polycarbonate (60L × 40W × 25D, in cm). Mice were transferred to the testing room and acclimated for at least one hour. The test session began with a 10 min habituation session in the center chamber only, followed by a 10 min habituation to all three empty chambers. Following the second habituation phase, a clean novel object (wire cup) was placed in one of the side chambers and a novel mouse was placed in an identical wire cup located in the other side chamber. After both stimuli were positioned, the subject mouse was allowed access to all three chambers for 10 min. Trials were video recorded and time spent sniffing the novel object and time spent sniffing the novel mouse were later scored by a trained observer that was blinded to the experimental groups and treatments. Mice that did not explore both chambers with the mouse and the object were excluded from the test. On 129S6 genetic background, 10–30% of the cohorts tested were excluded. This behavior was not associated with any specific genotype or treatment. However, very few (<5%) mice were excluded when they were on the B6 genetic background (WT and Brn2+/− mutants).
Acoustic startle and prepulse inhibition of the acoustic startle
Acoustic startle and prepulse inhibition of the acoustic startle responses were measured using four SR-Lab Systems (San Diego Instruments, San Diego, CA). A test session was begun by placing a subject in the Plexiglas cylinder where it was left undisturbed for 5 min. A test session consisted of seven trial types. One trial type was a 40 ms, 120 dB white noise sound burst presented alone as the startle eliciting stimulus. There were five different acoustic prepulse plus acoustic startle stimulus trials. The prepulse sound was presented 100 ms before the startle stimulus, and was 20 ms in duration. Prepulse sounds used were 74, 78, 82, 86, or 90 dB in each of the five respective trial types. Finally, there were test trials where no stimulus was presented. These were used to measure baseline movement in the cylinders. Six blocks of the seven trial types were presented in pseudorandom order such that each trial type was presented once within each block of seven trials. The average inter-trial interval was 15 sec (ranged from 10 to 20 sec). The startle response was recorded for 65 ms (measuring the response every 1 ms) beginning at the onset of the startle stimulus. The background white noise noise level in each chamber was 70 dB. The maximum startle amplitude recorded during the 65-ms sampling window was used as the dependent variable. Percent prepulse inhibition of a startle response was calculated as: 100 − [(startle response on acoustic prepulse and startle stimulus trials/startle response alone trials) × 100].
A separate startle response curve session was conducted using procedures identical to that described above, except that startle stimulus only trials were presented at dB levels ranging from 0 to 48 dB above the 70 dB baseline. The different startle stimuli were presented in a random order, with five presentations at each level. This procedure provided a gross indication of the hearing and startle.
Marble burying
Marble burying repetitive pattern of behavior was assessed as previously described20. Clean cages (31 × 17 × 14 cm) were filled with 4.5 cm SANI-CHIP bedding, and mice were tested for 20 min. The number of marbles buried (>50% marble covered by bedding material) was recorded.
Histology and immunohistochemistry on whole brains
Embryonic brain samples were dissected without perfusion, and included forebrain through hindbrain. Brain weight was measured and brains were immediately fixed overnight in 4% paraformaldehyde (PFA). Embryos tails were collected for PCR analysis to determine the genotype of the embryo. Samples were transferred to a 30% sucrose solution for 24 hours and then embedded and flash frozen in O.T.C. compound (Tissue-Tek, Torrance, CA). Frozen coronal sections (25 μm) were collected serially every 250μm, mounted on super-frost slides and stored at −80°C until use. Sections were treated identically and staining was performed on the same day for all genotypes. Cresyl-violet/Nissl staining was performed by standard protocols. The cortical wall and subregions of the cortical wall were measured at 3–4 locations mediolaterally across the neocortex and across the rostal caudal axis every 200μm, using imagePro software. The Atlas of the Prenatal Mouse Brain21 was used as guides for the frontal neocortex, specifically coronal sections #1–4 at E12.5; #1–4 at E14.5; #4–9 at E16.5 and #7–11 for E18.5 were used for all the histological analysis.
For immunohistochemistry, sections were air dried for 1 hr and then rehydrated in PBS followed by incubation with blocking solution (5% donkey serum and 0.5% Triton X-100 in PBS) for 1 hr at room temperature (RT). For Tbr2 staining, antigen retrieval was performed by placing slides in Sodium Citrate Buffer (10mM Sodium Citrate, 0.05% Tween 20, pH 6.0) at 100°C for 30 min and the slides were then incubated in blocking solution. Sections were incubated with primary antibodies diluted in blocking solution for 24h at 4°C, followed by the appropriate secondary antibody conjugated with Alexa Fluor 488, 568, or 647 (Invitrigen; 1:1000). Primary antibodies used were anti-Sox2 (Santa Cruz, sc17320; 1:200); anti-Tbr2 (Milipore, AB15894; 1:1000); anti-Tbr2 (gift from Dr. R. Hevner, Seattle Children’s Research Institute; 1:500); anti-5-bromo-2′-deoxyuridine (BrdU) (Sigma, B8434 1:500); anti-phospho-Histone H3 (Sigma, H0412; 1:500); anti-Ki67 (Dako, M7249; 1:200); anti-Ctip2 (Abcam, ab18465; 1:2000); anti-Cux1 (Santa-cruz, sc-13024; 1:200); anti-NeuN (Millipore, MAB377; 1:500); anti-FoxP2 (Abcam, ab1307; 1:2000); Anti-Brn2 (Santa Cruz, cs6029; 1:400) anti-Brn2 (2R2; 1:2000)22, anti-Tbr1 (Abcam, 31940; 1:200). After immunohistochemistry, slides were mounted with DAPI counter-stain (Invitrogen, P36930).
For Lac-Z enzymatic staining (β-gal), sections were air dried for 1 hr and washed three times in PBS for 5 min. The sections were transferred to β-Gal staining solution [1 mg/ml of 5-bromo-4-chloro-3-indolyl β-D-galactoside (X-Gal), 2 mM MgCl2, 5 mM potassium ferrocyanide, 5 mM potassium ferricyanide, 0.01% sodium deoxycholate, and 0.02% Nonidet-P40] at 37°C overnight. The samples were washed in distilled water three times, counterstained by Neutral Red, dehydrated in increasing concentrations of ethanol, cleared in xylene, and mounted. Sections were treated identically and the enzymatic reaction was performed on the same day for all genotypes (n=3 for each genotype, derived from at least 3 litters). Staining reaction was timed to ensure uniform exposure and slides from all the mice were randomized.
Neural progenitor cell culture
Neurospheres
Cerebral cortices were isolated from E14.5 mouse embryos, and dissociated by papain-containing dispersion solutions (Sumitomo Bakelite Co. MBX-9901) according to the manufacturer’s protocol. At the final step, cells were filtered, added to uncoated tissue culture six-well plates containing N2 supplement with DMEM, 10 ng/ml human recombinant epidermal growth factor, and 10 ng/ml basic fibroblast growth factor (NPC media), then incubated at 37°C in 95% air and 5% CO2 in a humidified chamber. Half of the media was replaced every other day, allowing cells to grow as floating neurospheres. When culture media began to turn yellow or after 10 days cells were passaged by incubation in 0.0025% Trypsin/EDTA solution (Gibco) for 5 min at 37°C, trypsin inhibitor 1mg/ml (Sigma, T6522) for 5 min at room temperature, collected by centrifugation and re-suspended in fresh NPC media. Doubling time was calculated by counting the number of NPCs at plating and at each passage using a hemocytometer (http://www.doubling-time.com/compute.php). Each embryo derived line of NPCs was passaged 3 times. Experimental results were obtained from secondary and tertiary neurospheres. In preparation for immunostaining, neurospheres were fixed in 4% PFA for 16 hours at 4°C, samples were transferred to a 30% sucrose solution for 24 hours at 4°C, embedded and flash frozen in O.T.C. compound (Tissue-Tek, Torrance, CA). Frozen coronal sections (10 μm) were then cut on a cryostat and mounted on super-frost slides and stored at −80°C until use.
Monolayer adherent NPC cultures
Tertiary neurospheres were dissociated and plated as single cell suspension on poly-ornithine (Sigma, P3655, 10μg/ml) and laminin (Sigma, L2020, 5μg/ml) coated plates. Cells were grown in DMEM/F-12 Glutamax (Gibco), 1× B27 without vitamin A, 1× N2 supplement, 10 ng/ml hEGF, and 10 ng/ml bFGF and plated at the density of 1×10^6 cells/cm2. Cells were passaged when they reached ~90% confluence (usually within 3–6 days) by accutase (Millipore) treatment. For LiCl experiments, 5M LiCl was dissolved in water and added to the growth media at a final concentration of 5mM. The cells were checked daily for their growth and proliferation. Dose response curves using (0, 1, 2.5, 5 and 10mM LiCl) demonstrated that consistent and reliable inhibition of growth rate was achieved with 5mM LiCl within 3 days. In preparation for immunostaining, cells were cultured on 12mm cover glass and fixed in 4% PFA then washed with PBS three times and stored at 4°C until use.
Immunofluorescence
Slides or cells were washed once with PBS and then permeabilized with 0.5% Triton X-100 in PBS for 5 minutes. After washing with PBS and blocking with 10% Donkey serum, 0.5% Triton X-100 in PBS (blocking solution), cells were incubated with the primary antibodies diluted in blocking solution for 16 hours at 4°C. After PBS washes, cells were incubated with labeled secondary antibodies for 60 minutes. Nuclei were stained after incubation with 1μg/ml DAPI for 5 minutes. The slides were mounted using prolong-gold (Invitrogen, P36930).
Cell cycle analysis
Monolayer adherent NPCs were harvested, washed with PBS, resuspended in PBS and fixed for 1 hour in 4°C in 100% ethanol (−20°C). Cells were collected, resupended in PBS containing 100 μg/ml RNase A for 30 min in 37°C, and stained with 1mg/ml propidium iodide solution (10mg/1×10ˆ6 cells stained) for 2 h at 4°C. For each sample, 50000 cells were collected in the appropriate gate for analysis on FACSCalibur (BD Biosciences, Mountain View, CA) using FlowJo software (Tree Star, Ashland, OR).
Western Blotting
E14.5 cortex or monolayer cultured NPCs were washed with cold PBS. Protein was extracted with 50mM Tris pH 7.6, 500 mM NaCl, 1 mM EDTA, 1% NP-40, 1% deoxycholate, 0.1% SDS and protease inhibitor cocktail (Roche, # 1 836 153). Lysates were centrifuged for 25 min at 15000 rpm at 4°C, the resulting supernatant was collected and the total protein content of the samples was determined by the BCA Protein Assay Kit (Pierce Biotechnology, #23225). SDS gel electrophoresis was performed utilizing 15μg protein per lane. Gels were transferred to nitrocellulose membranes (BioRad, 9004-70-0). Proteins were detected with anti-Brn2 (2R2 1:200022); anti-Tbr2 (Milipore, AB15894; 1:2000); Anti-GAPDH (Acris, ACR001P; 1:10000). All membranes were visualized using ECL (Thermo scientific, 34080) and exposure to autoradiography film (Denville scientific inc. E3018).
Chromatin Immunoprecipitation Assays
ChIP assays23 were performed on samples from mouse E14.5 cerebral cortex. For each ChIP, 20–30 mg of chromatin was used. For immunoprecipitation, rabbit anti-Brn2 (2R222) or rabbit anti β-catenin (Cell signaling, #8480) and normal rabbit IgG as control were used (Santa-cruz, sc-2027). Primer sequences used for qPCR amplification were:
NestinInt2 5′-CAGCCTGAGAATTCCCACTT-3′ 5′-GAGAGGGAGGCCGATTCT-3′
mTbr2_905 5′-AGCTGGAGCAAAGGAGCTTA-3′ 5′-CTCTCTGCGGCACAATACAG -3′
mTbr2_95 5′- AAGAAACACCAAACCAGCAA-3′ 5′-TGCTATTGGCTGTTAGAGGTGA-3′
Axin T3 5′- GCATACCTCCCTTCCAGGAC -3′ 5′- GGCGCTTCCAACAAAAACT -3′
Axin T7 5′- CGGAAAAAGTGTGTGTGGAG -3′ 5′- ATCAAGCAACCCAGCTATCC -3′
Brn2 5′- AAGCTCTCTCCCGCTCTCTT -3′ 5′- GGGTACAGCTCTGCACCAAT -3′
qPCR was carried out using SsoFast EvaGreen Supermix (Bio-Rad) and run on the Eppendorf Mastercycler EP Realplex 2 thermal cycler. ChIP-qPCR signals were standardized to the nonspecific rabbit IgG signal. For the identification of putative binding sites for β-catenin and Brn2 binding sites at Brn2 and Tbr2 promoters respectively, we used five different prediction tools (TFBIND (TFBIND.hgc.jp); TESS (www.cbil.upenn.edu); TFSEARCH ver.1.3 (www.cbrc.jp/research/db/TFSEARCH.html), UniPROBE (the_brain.bwh.harvard.edu) and TRANSFAC24). A putative binding site was tested only if two or more tools identified that site. For the identification of putative β-catenin sites, we used predicted TCF binding sites.
shRNA and RT-PCR
HEK293T cells were used to produce lentiviruses expressing GFP (Addgene, 11579, pSicoR) or shRNA viruses against Brn2 (Thermo, TRCN0000075429). HEK293T cells were cotransfected with pLKO.1-Brn2-C5/pSicoR, pCMV-ΔR8.2, and pVSVg vectors using TransIT-LT1 (Mirus, MIR2300) according to the manufacturer’s protocol. After 12 hr, the media was replaced with DMEM/F12 GlutaMAX™ (Invitrogen, 10565) and after an additional 24 hr, the viral supernatant was collected, filtered and supplemented with NPC media supplements. Monolayer adherent NPCs were infected with the viral supernatant by centrifugation for 1 hr at 32–35°C at 1000 rpm. Following centrifugation, the viral supernatant was replaced with fresh NPC media. Total cellular RNA was extracted with TRIzol (Invitrogen) and purified on a column using the RNeasy Mini Kit. DNAase treatment was performed on the column. Extracted RNA (1μg) samples were reverse transcribed into cDNA according to the manufacturer’s protocol for RT-PCR (BioRad, 170-8891). RT-qPCR was performed by using SsoFast EvaGreen Supermix (Biorad) and run on the Eppendorf Mastercycler EP Realplex 2 thermal cycler. The specific primers used for RT-qPCR were:
Brn2_5′ 5′- GGTGAGCAGGCTGTAGTGGT -3′ 5′- AGAGCCCAAGGCAGAAAAGT -3′
Brn2_M 5′- CTCACCACCTCCTTCTCCAG -3′ 5′- CCATTTCCTCAAATGCCCTA -3′
Brn2_3′ 5′- CCATCAGCATGTCTGTGGTC -3′ 5′- GCCCCAAACAGATTCTACCA -3′
Brn2_3′B 5′- TGAACCAACCTTCCTTTCCA -3′ 5′- TTCATGGAACTGTGCTCTGG -3′
Tbr2_2 5′- AAACACGGATATCACCCAGC -3′ 5′- GACCTCCAGGGACAATCTGA -3′
B2M_2 5′- CCTGGTCTTTCTGGTGCTTG -3′ 5′- TATGTTCGGCTTCCCATTCT -3′
Due to the fact that Brn2 is a one exon gene, we designed three primer sets within the mRNA (Brn2_5′, Brn2_M, Brn2_3′) and as a negative control one primer set for the boundary region of the 3′ end (Brn2_3′B).
NPC transfection
pCAG-GFP (Addgene 11150) or pCAG-mBrn2 (Addgene 19711) plasmids were transiently transfected into NPCs (750ng/200000cells one chamber of a four chambered slide) using Lipofectamine LTX+ (Invitrogen) according to the manufacturer’s instruction. Transfection was performed in NPC media, which was replaced after 24 hr following transfection. Transfection efficiency was measured by GFP expression and was ~45%. Super Top-Flashx8 (Addgene 12456; 50ng), super Fop-Flashx8 (Addgene 12457; 50ng) and Renilla (10ng) plasmids were transiently transfected into NPCs (40000 cells per well of a 96 well plate) using Lipofectamine LTX+ in NPC media, which was replaced 24 hr following transfection. After 48 hr, cells were lysed in the 96 well plates with passive lysis buffer (Promega). Firefly luciferase and Renilla luciferase activity in the lysates were measured on a Synergy 2 microplate reader (BioTek Instruments, Winooski, VT) in replicates of 3, using the Dual-Luciferase reporter assay system (Promega). The ratios for firefly luciferase:Renilla luciferase were determined and expressed as relative luciferase activity.
Image Acquisition and Analysis
The immunofluorescent slides were viewed and photographed with 40× or 60× objectives using a Nikon C1si microscope. Analysis of the thickness and/or cell counts of immunohistochemical staining were captured and quantified across the entire image taken by the Image-Pro Plus system (version 5.1; Media Cybernetics).
For Sox2 and Tbr2 staining, the number of DAPI+Sox2+, DAPI+Tbr2+ and DAPI+Sox2+Tbr2+ cells was quantified from 2–3 sequential serial coronal sections (250μm apart) and normalized to the number of DAPI+ nuclei of the entire cortical wall (ventricle to pia). The data for each developmental time point was normalized to the WT of the indicated time point in order to present all the developmental stages in one plot.
For pHH3 analysis the number of DAPI+pHH3+ cells were counted across 500μm of the mediolateral plane at the level of the VZ and the SVZ, based on the DAPI staining, which was used to define the morphological compartments.
For cortical plate markers (Ctip2, Cux1, Brn2 and FoxP2) a rectangle of 150μm width was placed on the image in 3 locations and the number and width of the stained neurons was quantified. The data for each developmental time point was normalized to the WT of the indicated time point in order to present all the developmental stages in one plot or as the raw data in case one developmental stage is presented.
Magnetic resonance imaging
Following embryonic mock or CHIR99021 treatment, 18 week old WT and Dvl1−/− mice were anesthetized with ketamine/xylazine and intracardially perfused with 30mL of 0.1M PBS containing 10U/mL heparin (Sigma) and 2mM ProHance (a Gadolinium contrast agent, Bracco Diagnostics) followed by 30mL of 4% paraformaldehyde (PFA) containing 2mM ProHance25. After perfusion, mice were decapitated and the skin, lower jaw, ears, and the cartilaginous nose tip were removed. The brain and remaining skull structures were incubated in 4% PFA + 2mM ProHance overnight at 4°C then transferred to 0.1M PBS containing 2mM ProHance and 0.02% sodium azide for at least 7 days prior to MRI scanning.
Magnetic resonance Imaging
A multi-channel 7.0 Tesla MRI scanner (Agilent Inc., Palo Alto, CA) was used to image the brains within skulls. Sixteen custom-built solenoid coils were used to image the brains in parallel26.
For the anatomical MRI scans a T2- weighted, 3-D fast spin-echo sequence was used, with a cylindrical acquisition of k-space27, and with a TR of 350 ms, and TEs of 12 ms per echo for 6 echoes, field-of-view of 20 × 20 × 25 mm3 and matrix size = 504 × 504 × 630 giving an image with 0.040 mm isotropic voxels. Total imaging time for this sequence is currently ~14 h.
Diffusion Tensor Imaging
For DTI imaging, a 3-D diffusion weighted fast spin-echo sequence was used with an echo train length of 6, with a TR of 270 ms, first TE of 30 ms, and a TE of 10 ms for the remaining 5 echoes, field-of-view 14 × 14 × 25 mm3 and a matrix size of 180 × 180 × 324 yielding an image with 0.078 mm isotropic voxels. Five b=0 s/mm2 images and 30 high b-value images (b=1917 s/mm2) in 30 different directions were acquired, using the Jones30 scheme28. Total imaging time for the DTI sequence is currently ~12 h.
To visualize and compare any changes in the mouse brains the anatomical images, as well as the b=0 s/mm2 diffusion images (in a separate registration), are linearly (6 parameter followed by a 12 parameter) and nonlinearly registered. All scans are then resampled with the appropriate transform and averaged to create a population atlas representing the average anatomy of the study sample. The result of the registration is to have all scans deformed into exact alignment with each other in an unbiased fashion29, 30.
For the volume measurements, this allows for the analysis of the deformations needed to take each individual mouse’s anatomy into this final atlas space, the goal being to model how the deformation fields relate to genotype29, 30. The jacobian determinants of the deformation fields are then calculated as measures of volume at each voxel. Significant volume changes can then be calculated by warping a pre-existing classified MRI atlas onto the population atlas, which allows for the volume of 159 segmented structures encompassing cortical lobes, large white matter structures (i.e. corpus callosum), ventricles, cerebellum, brain stem, and olfactory bulbs31–33 to be assessed in all brains. Further, these measurements can be examined on a voxel-wise basis in order to localize the differences found within regions or across the brain.
For the diffusion measurements this registration allows direct comparisons of intensity differences between groups for all diffusion measures. Fractional Anisotropy, Mean Diffusivity, Axial Diffusivity, and Radial Diffusivity Maps were created using the FSL software package (www.fmrib.ox.ac.uk/fsl) and then resampled using the exact transform that was required to register the b=0 s/mm2 images. Similar to the volume measurements differences between groups can be assessed in two different ways. 1) Mean values of these parameters can be calculated for specific regions throughout the brain using the exact same atlas used in the volume analysis, and 2) differences in these parameters can be examined on a voxel-wise basis in order to localize the differences found within regions or across the brain.
Statistical Analyses
The majority of the statistical analyses were performed using SPSS version 12. The four groups (WT, Dvl3+/−, Dvl1−/− and Dvl1−/−3+/−) were compared by one-way ANOVA or two-way ANOVA for the LiCl and CHIR99021 treatment experiments. The experimental variation was similar between groups and following treatments. Experimental sample size was chosen based on previous data, which was obtained in a similar experimental design using other mouse models. Where appropriate, two-tailed Student’s t-test post-hoc analysis was performed with Bonferroni correction for multiple comparisons and the p-values presented are those of the corrected values. The investigator was blinded for the behavioral analysis but was not blinded to the group allocation during the experiment and/or when assessing the outcome of the histological and biochemical experiment. The statistical analysis for the social approach task was a paired t-test that compares the time sniffing the mouse and the object as paired data for each mouse19.
For the MRI analyses statistical analysis was performed in the R statistical environment (www.rproject.org). Multiple comparisons for the MRI analysis were controlled for using the False Discovery Rate (FDR)34.
Results
Dvl1−/−3+/− mice display social deficits
Dvl2 or Dvl3 single null mutants as well as Dvl1−/−2−/− and Dvl2−/−3−/− mutants do not survive past embryonic or neonatal stages, precluding behavioral examination14, 35, 36. However, Dvl1−/−3+/− mice were viable and fertile. In addition, behavioral testing of Dvl1−/−2+/− mice did not reveal any additional phenotype compared with Dvl1−/− mice. Therefore, we generated cohorts of Dvl1−/−, Dvl1−/−3+/− and wild-type (WT) mice to assess them in a battery of behavioral tasks. Similar to Dvl1−/− mutants12, Dvl1−/−3+/− mice display social behavior abnormalities, including defects in social barbering, nesting and the three chamber social approach task (Figure 1a–c). These social behavioral tasks we used are qualitative measures of social interaction that determine whether or not a mouse genotype is social, but they are not able to determine quantitative differences between mouse strains in social behavioral phenotypes19. However, a marble-burying task, which examines repetitive patterns of behavior, revealed that Dvl1−/−3+/− mice buried more marbles than WT and Dvl1−/− mice (Figure 1d). No differences between Dvl1−/−, Dvl1−/−3+/− mutant and WT mice were observed in a behavioral test battery, including normal gross physical appearance and sensorimotor reflexes (Supplementary Table 1). In addition, the total distance traveled and the time spent in the center of the chamber in the open field task was not different between Dvl1−/−, Dvl1−/−3+/− and WT mice (Supplementary Figure 1a–b). We previously found that Dvl1−/− mice display inconsistent deficits in prepulse inhibition of startle (PPI,12, 13). The additional reduction in Dvl allele in Dvl1−/−3+/− mice did not display reduced PPI and startle response compared to Dvl1−/− and WT mice (Supplementary Figure 1–d). Thus, we concluded that Dvl1−/−3+/− mice displayed abnormal social behaviors, similar to the Dvl1−/− mutants, and novel and repetitive behaviors not displayed by Dvl1−/− mutants, but were otherwise neurologically intact.
Figure 1. Dvl1−/−3+/− mice display social deficits and embryonic brain enlargement.
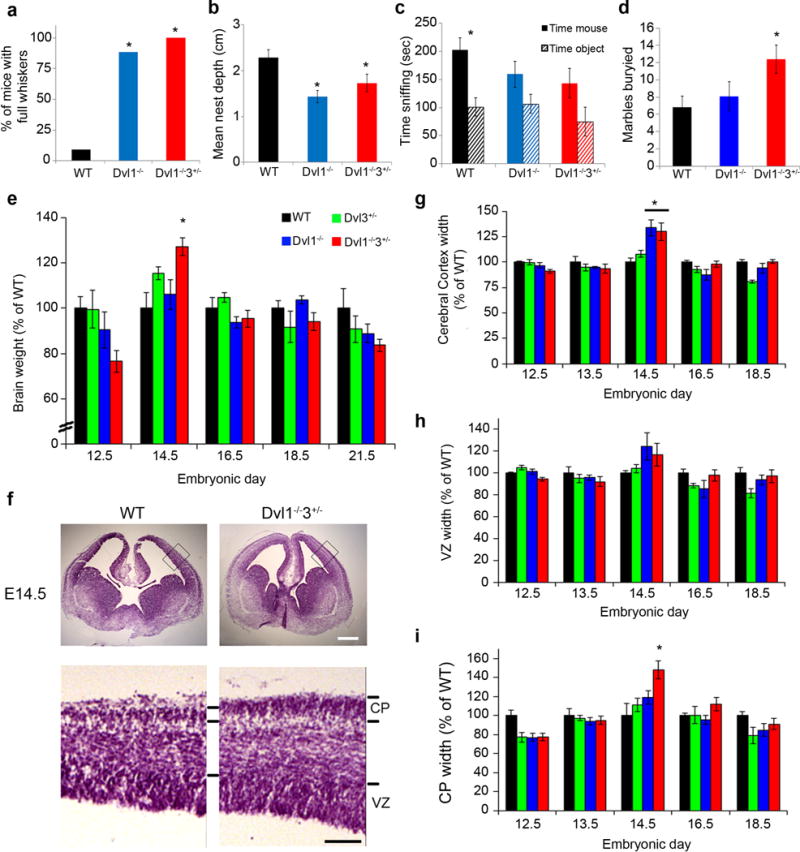
WT, Dvl1−/− and Dvl1−/−3+/− mice behavioral phenotypes were determined in: (a) Whisker trimming (n≥11) (*p<0.0001), (b) nest building (n≥5) (*p<0.04), (c) three chamber social approach (n≥9) (*p<0.01) and (d) marble burying task (n≥8) (*p<0.02). e, WT, Dvl1−/− and Dvl1−/−3+/− embryonic heads (E12.5–E13.5) or brains (E14.5-P0) were dissected, weighed and quantified as a percentage of the average WT brain weight for the indicated time point (mean±SEM, n≥5, ANOVA<0.001; *p<0.04 for comparison of the Dvl1−/−3+/− brains with those from WT). f, Coronal sections of WT, Dvl1−/− and Dvl1−/−3+/− were Nissl stained and representative images of the neocortex are shown at E14.5 (scale bar: 250; 100μm). Nissl stained images were quantified as percentage of the average width of WT total neocortex (g), ventricular zone (h) and cortical plate (i) for the indicated time points. Results are presented as mean±SEM (n≥4, ANOVA<0.02; *p<0.02 for comparison of the brains from Dvl1−/−3+/− and Dvl1−/− mutants with those of WT).
Dvl1−/−3+/− mice display transient embryonic brain enlargement
To determine whether Dvl1 and Dvl3 play a role in brain development, we analyzed the brain size and weight of WT, Dvl3+/−, Dvl1−/− and Dvl1−/−3+/− embryos between embryonic days 12.5 (E12.5) and 21 (P0). The brain size (Supplementary Figure 1e) and weight (Figure 1e and Supplementary Table 2) were greater in Dvl1−/−3+/− embryos than in WT or single mutants specifically at E14.5, but not at the other time points examined. Consistent with the transient increase in the overall brain size, Dvl1−/−3+/− embryos displayed a dorsoventral thickening of cerebral cortex wall in all the histological sections (coronal sections #1–4 at E12.5; #1–4 at E14.5; #4–9 at E16.5 and #7–11 for E18.521) of the frontal cortex, with a specific increase in cortical plate (CP) thickness at E14.5 only (Figure 1f–I, Supplementary Figure 1f and Supplementary Table 2).
Dvl1−/−3+/− embryos display early differentiation of apical to basal progenitors
Expansion of the CP in Dvl1−/−3+/− mutants may be due to altered proliferation or differentiation of cortical neural progenitor cells (NPCs) as a result of reduced β-catenin transcriptional activity. There are two major classes of cortical NPCs in mice: Sox2+ apical radial glial NPCs and Tbr2+ basal NPCs4. We performed immunohistochemistry (IHC) for Sox2 and Tbr2 at various stages of embryonic development (Figure 2a). The area of Sox2 expressing cells was broader, and Tbr2+ cells were positioned more basally in Dvl1−/−3+/− embryonic brains at E14.5 and E16.5 than in other genotypes (Figure 2a and Supplementary Figure 2a). Immunohistochemistry (IHC) for phospho-histone-H3, a mitotic marker, revealed that both apical and basal progenitor regions of Dvl1−/−3+/− brains displayed more apical and basal mitotically active cells at E14.5 than WT (Supplementary Figure 2b–c). Combined Ki67 IHC and BrdU incorporation experiments revealed an increased number of Ki67+ (cycling cells) and BrdU+Ki67+ cells in the Dvl mutant cortex (Supplementary Figure 2d–e), indicating a significant increase in the proliferation in Dvl1−/− and Dvl1−/−3+/− mutants. To determine the specific type of NPC that was expanded, we measured the change of each NPC subclass relative to WT. The percentage of Sox2+Tbr2− NPCs was reduced in the Dvl1−/−3+/− embryos compared with all other genotypes at E14.5 (Figure 2b). The percentage of Sox2-Tbr2+ NPCs were unaffected by genetic loss of Dvls (Figure 2c). In contrast, the percentage of the minor cell population of basally positioned and doubly labeled Sox2+Tbr2+ NPCs was slightly increased at E13.5 in all Dvl mutants compared to WT, reaching statistical significance at E14.5 only (Figure 2d), suggesting that the increase cortical thickening starts at E13.5 and persists to E14.5. The percentage ratios of Sox2+: Tbr2+: Sox2+Tbr2+ NPCs are 40%:17%:5% for WT and 29%:22%:20% for Dvl1−/−3+/− mice, respectively. These findings were recapitulated in adherent NPC monolayer cultures from E14.5 brains (Supplementary Figure 3ab). There was a significant increase of Sox2+Tbr2+ NPCs in monolayers from Dvl3+/− and Dvl1−/−3+/− compared to WT cells both in neurosphere (Supplementary Figure 3c–e) and monolayer cultures (Supplementary Figure 3f–g). Dvl1−/− NPCs were enriched for Sox2−Tbr2+ cells, but not for Sox2+Tbr2+ NPCs (Supplementary Figure 3g). The population doubling time was significantly decreased in Dvl1−/− and Dvl1−/−3+/− NPCs, while there was a non-significant trend toward decreased doubling time in Dvl3+/− NPCs (Supplementary Figure 3h). One interpretation of these findings is that elevated expression of Tbr2 either in Sox2+ or Sox2− NPCs may result in increased NPC proliferation in the Dvl mutants.
Figure 2. Early expansion of basal progenitors in Dvl1−/−3+/− embryos.
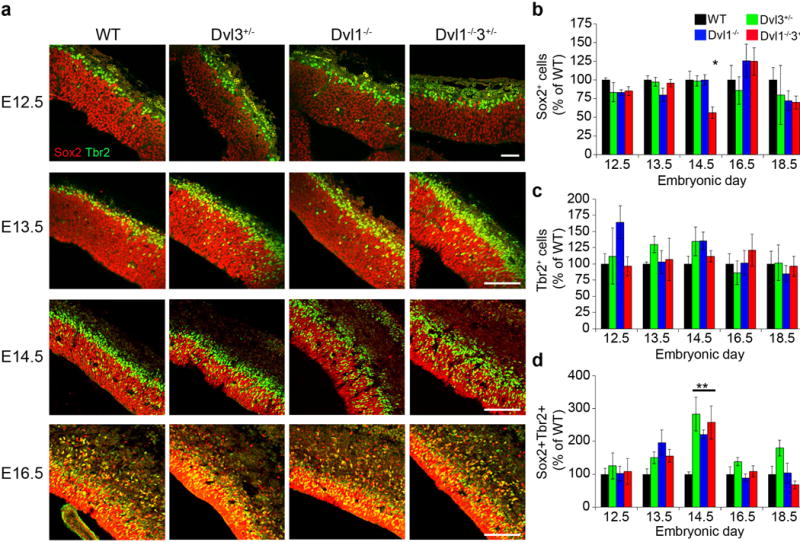
a, Coronal sections from WT, Dvl1−/− and Dvl1−/−3+/− embryonic brains were immunostained with anti-Sox2 (Red) and anti-Tbr2 (Green) (scale bar: 100μm). Quantification of the single and double labeled cells was performed and results are presented as mean±SEM (n≥4). b, Sox2 single labeled cells (ANOVA<0.01; *p<0.01 for comparing the results of the Dvl1−/−3+/− with those of all the mouse groups); c, Tbr2 single labeled cells and d, Sox2+Tbr2+ double labeled cells. (ANOVA<0.02; *p<0.002 for comparing the results of the Dvl mutants with those of WT mouse groups).
Dvl1−/−3+/− embryos display early expansion of deep layer neurons
To determine the relationship between the early differentiation of apical to basal progenitors and the early and transient thickening of the CP in brains from Dvl mutant embryos, we examined cortical lamination by performing IHC for Ctip2 (layer 5 and 6 marker) and Cux1 (layer 2–4 marker). The number of deep layer Ctip2+ cells in the CP was increased in Dvl1−/−3+/− mutants compared to WT at E14.5, then decreased by E18.5 in the mutants (Figure 3a–b). By contrast, superficial neuronal layers, marked by Cux1, were similar in numbers in all genotypes starting at E16.5 when this marker is normally expressed37 and thereafter (Figure 3a and Supplementary Figure 4a). The expanded Ctip2+ cells in the CP at E14.5 were indeed neurons, since the NeuN+ cell layer was significantly increased in Dvl1−/−3+/− brains (Figure 3c and Supplementary Figure 4b). Thus, there was a transient expansion of deep layer Ctip2+ neurons in Dvl1−/−3+/− mice at E14.5 that did not persist throughout brain development.
Figure 3. Early differentiation of deep layer neurons in Dvl1−/−3+/− embryos.
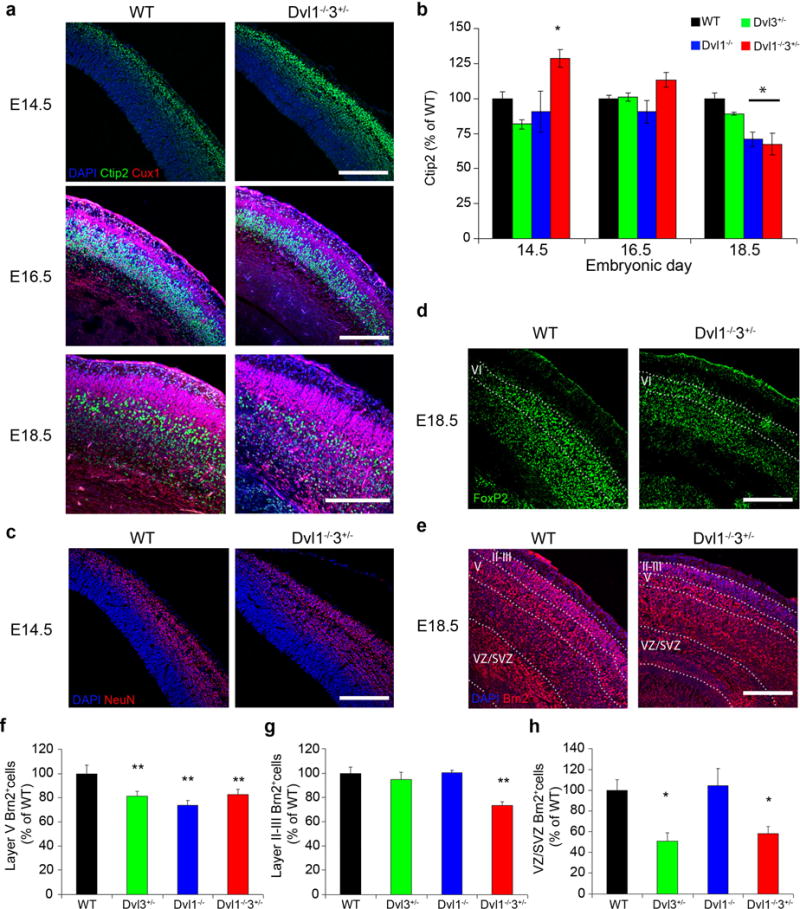
a, WT and Dvl mutant embryonic brain sections were immunostained with DAPI (Blue), anti-Ctip2 (Green) and anti-Cux1 (Red) (Scale bar: 200μm), Representative images of the staining are shown. b, Quantification of the percentage of Ctip2 labeled cells are presented as mean±SEM (n≥4, ANOVA<0.007; *p<0.01 for comparing the results of the Dvl1−/−3+/− with those of the WT mice). c, WT and Dvl embryonic brain sections were immunostained with DAPI (Blue), anti-NeuN (Green) and representative images of the staining are shown. (Scale bar: 200μm). d–e, Coronal sections of WT and Dvl embryonic brains at E18.5 were immunostained with DAPI (Blue), anti-FoxP2 (Green) (d) and anti-Brn2 (Red) (e). Representative images of the staining are shown. (Scale bar: 200μm). f–h, Quantification of the percentage of Brn2+ neuron in layer V (ANOVA<0.04) (f), layers II–III (ANOVA<0.003) (g) and VZ/SVZ (ANOVA<0.009) (h), results are presented as mean±SEM of n=3–5 per group (**p<0.01 and *p<0.05 for comparing the results of the Dvl mutants with those of the WT). Black, green, blue and red bars represent WT, Dvl3+/−, Dvl1−/− and Dvl1−/−3+/− genotypes, respectively.
Next, we examined the expression of FoxP2 (layer 6 marker, expressed only after E18.5,38) and Brn2 (marking layers 2–3 and 5). Similar to Ctip2+ cells, FoxP2+ and Brn2+ deep layer neurons were reduced at E18.5 in all the Dvl mutants compared to WT embryos (Figure 3d–f). The number of Brn2+ neurons in layers 2–3 of Dvl1−/−3+/− mutants were also reduced at E18.5 (Figure 3e and 3g), even though Cux1+ cells were unchanged (Figure 3a and Supplementary Figure 4a). Layer 2–3 Brn2−DAPI+ nuclei were observed in Dvl1−/−3+/− mice, suggesting that these cells were not expressing Brn2 (Figure 3e and Supplementary Figure 4c). Thus, Brn2 levels in layer 2–3 neurons were reduced in Dvl1−/−3+/− brains, while the number of superficial layer neurons remained unchanged.
β-catenin transcriptional activity regulates Brn2 levels in NPCs
Brn2 levels increased in the entire cortical wall of WT embryos from E14.5 to E18.5 and were consistently reduced in Dvl1−/−3+/− embryos (Figure 3e, 4a and Supplementary Figure 4c). Western blot analysis at E14.5 of cortical lysates revealed reduced expression of Brn2 in Dvl1−/− and Dvl1−/−3+/− mutants (Supplementary Figure 4–e). Consistent with these in vivo observations, the number of Brn2+ cells was reduced by 50% in Dvl1−/−3+/− NPCs compared to WT NPCs (Figure 4b and 4c). These findings suggest that the loss of Dvl genes results in the reduction of Brn2 expression in the developing neocortex.
Figure 4. β-catenin/Brn2/Tbr2 transcriptional cascade directly regulates NPCs proliferation.
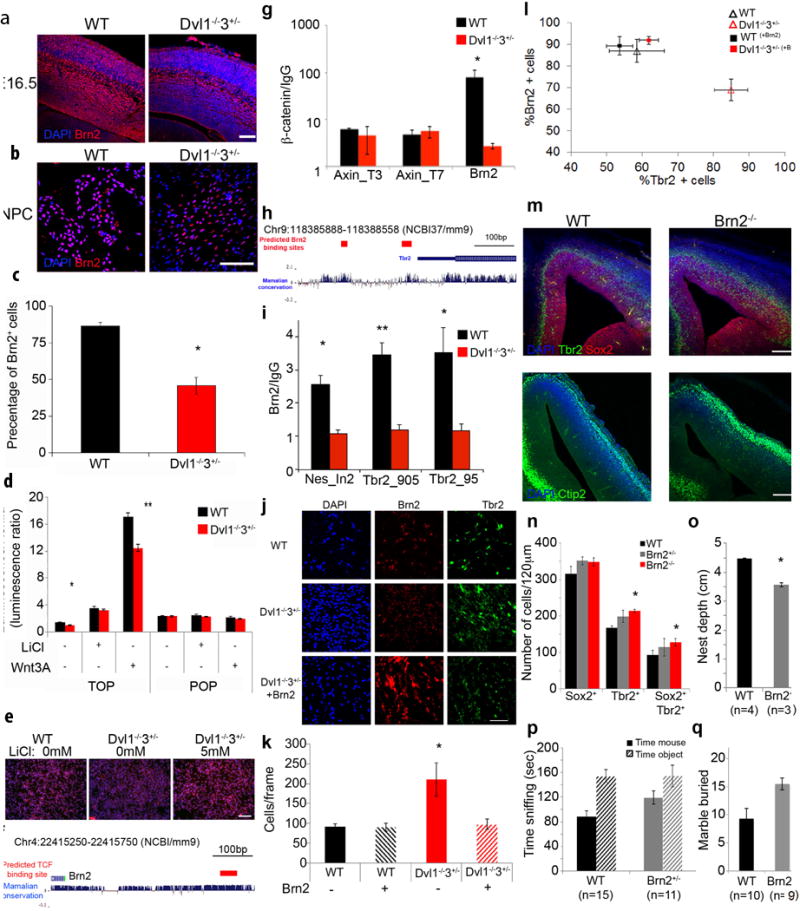
WT and Dvl1−/−3+/− brains at E16.5 were double-labeled with DAPI (blue) and anti-Brn2 (red) and representative images are presented (Scale bar: 100μm) (a) and in WT and Dvl1−/−3+/− NPCs (Scale bar: 100μm) (b). c, Brn2 labeled NPCs were quantified as the percentage of total cells counted (DAPI). Results are presented as mean±SEM (n≥3, *p<0.01 for comparing the percentage of Brn2+ cells in the Dvl1−/−3+/− NPCs with those of the WT NPCs). d, WT and Dvl1−/−3+/− NPCs were transfected with TOP-Flash and fire-fly renilla reporters and treated with either 5mM LiCl or 100ng/ml Wnt3A. Results are presented as mean±SEM (n≥3, ANOVA<0.001; *p<0.02 and **p<0.002 for comparing the luminescence ratio in the Dvl1−/−3+/− NPCs with those of the WT NPCs). e, WT and Dvl1−/−3+/− NPC treated with 5mM LiCl were immunostained for Brn2 and representative images are presented (Scale bar: 100μm). f, Schematic Image of the promoter region of Brn2, the predicted region for TCF binding is marked by red rectangle. g, At E14.5 WT and Dvl1−/−3+/− cortexes were isolated and β-catenin ChIP was preformed followed by qPCR analysis for the Axin2 intron1 and the predicted region on the Brn2 promoter. (mean±SEM, n≥4, *p<0.04 for comparing the enrichment in the Dvl1−/−3+/− cortical cells with those of the WT cortical cells). h, Schematic image of the promoter region of Tbr2, the red rectangle indicates the predicted regions for Brn2 binding. i, At E14.5 WT and Dvl1−/−3+/− cortexes were isolated and Brn2 ChIP was performed followed by qPCR analysis for the nestin intron2 and the predicted binding sites on the Tbr2 promoter. Results are presented as fold enrichment of the Brn2 signal above the IgG control (mean±SEM, n≥4, *p<0.04, **p<0.003, for comparing the enrichment in the Dvl1−/−3+/− cortical cells with those of the WT cortical cells). j, WT and Dvl1−/−3+/− NPCs grown as monolayer cultures were transfected with pCAG-Brn2. NPCs were immunostained for DAPI, Brn2 and Tbr2. Representative images are presented (Scale bar: 100μm). k, pCAG-Brn2 transfected WT and Dvl1−/−3+/− NPCs were immunostained for DAPI and DAPI+ nuclei were counted. Results are presented as mean±SEM (n≥4, ANOVA<0.04 *p<0.05 for comparing the results of the Dvl1−/−3+/− with those of the WT and the Brn2 transfected Dvl1−/−3+/− NPCs groups). l, pCAG-Brn2 transfected WT and Dvl1−/−3+/− NPCs were immunostained for DAPI, Brn2 and Tbr2. The percentage of Brn2+ and Tbr2+ cells was measured. Results are presented as mean±SEM (n≥4, AVOVA<0.04 *p<0.03, comparing the results of the GFP transfected Dvl1−/−3+/− with those of the WT and the Brn2 transfected Dvl1−/−3+/− NPCs). m, WT and Brn2−/− brain coronal sections from E14.5 were immunostained with anti-Sox2 (Red) and anti-Tbr2 (Green) and representative images are presented (scale bar: 100μm). WT and Brn2−/− brain coronal sections from E14.5 were immunostained with anti-Ctip2 (Green) and representative images are presented (scale bar: 100μm). n, The number of Sox2+, Tbr2+ and Sox2+Tbr2+ labeled cells were quantified and the results are presented as mean±SEM (n≥4, ANOVA<0.04; *p<0.001 for comparing the results of the Brn2 mutants with those of the WT embryos). o, Nest building activity in WT and Brn2+/− cages was assessed and measurements of the nest depth are presented as mean±SEM (n≥4, *p<0.003 for comparing the results of the Brn2 mutants with those of the WT cages). p, WT and Brn2+/− mice were assessed in the social approach task and scored, results are presented as mean±SEM (*p<0.002 for comparing the results of the time spent sniffing the mouse compared with the object). q, The marble burying task was scored and the results are presented as mean±SEM (*p<0.02 for comparing the results of the Brn2+/− mutants with those of the WT mice).
Previous studies demonstrated that β-catenin activates Brn2 expression in cancer cells39. The reduced levels of Brn2 in Dvl deficient VZ/SVZ and cultured NPCs led us to hypothesize that β-catenin may directly regulate Brn2 in NPCs. To test this hypothesis, we examined Wnt/β-catenin transcriptional activity using TOP-flash assays in WT and Dvl1−/−3+/− NPCs. TOP-flash encodes seven copies of LEF/TCF binding sites linked to firefly luciferase and reflects Wnt/β-catenin transcriptional activity. TOP flash, β-catenin transcriptional activity was reduced in untreated Dvl1−/−3+/− NPCs or upon activation of the canonical Wnt signaling with Wnt3A compared with WT NPCs (Figure 4d). To validate the reduced canonical Wnt signaling in vivo, we crossed WT and Dvl mutants with the BAT-gal reporter mice15 that express β-galactosidase (β-gal) in the presence of active β-catenin transcription. β-gal staining was visually reduced in cortical sections of E14.5 Dvl1−/−3+/− embryos compared to the WT cortex, specifically in the VZ and the CP, although staining was variable (Supplementary Figure 5a) and thus was not quantified. β-gal staining was also reduced in Dvl1−/− and Dvl3+/− embryos but to a lesser extent (Supplementary Figure 5b). In addition, β-gal staining in WT mice was most pronounced in the frontal cortex at E14.5, but this was diminished by E16.5 and restricted to the cortical hem region (Supplementary Figure 5c). These results suggest that the transient increase in proliferation and early expansion of deep layer neurons in the Dvl1−/−3+/− embryos at E14.5 was associated with reduced β-catenin transcriptional activity and reduced canonical Wnt signaling in the VZ and CP.
Lithium Chloride (LiCl) treatment, which prevents β-catenin degradation downstream of Dvl in the canonical Wnt pathway, elevated β-catenin transcriptional activity to similar levels in the WT and Dvl1−/−3+/− NPCs (Figure 4d), decreased the proliferation of NPCs from both genotypes (Supplementary Figure 5d), and restored Brn2 to similar levels in Dvl1−/−3+/− as in WT NPCs (Figure 4e and Supplementary Figure 5e). Double labeling for Brn2 and an activated form of β-catenin (ABC) revealed that the nuclear staining of Brn2 and ABC were spatially and quantitatively correlated (Supplementary Figure 5f). Finally, chromatin immunoprecipitation (ChIP) with a β-catenin antibody demonstrated specific enrichment for β-catenin interaction with a putative TCF binding site on the Brn2 promoter region in WT E14.5 cortex, but not with the known β-catenin interaction sites40 on Axin2 (Figure 4f–g), while this enrichment was reduced in Dvl1−/−3+/− cortex. These findings demonstrate that β-catenin binds to the Brn2 promoter and suggest that down-regulation of β-catenin transcriptional activity in Dvl mutants leads to direct reduction of Brn2 levels and increased proliferation in Dvl1−/−3+/− NPCs.
Brn2 regulates Tbr2 expression in NPCs
We observed an inverse correlation between Tbr2 and Brn2 levels in Dvl1−/−3+/− embryonic brains and NPCs. The VZ/SVZ region in the mutant brains displayed elevated expression of Tbr2 but reduced expression of Brn2 (Figure 2a, 3e and 3h). The levels of Brn2 were reduced in Dvl1−/−3+/− compared to WT NPCs by Western blot analysis, consistent with the IHC results, while LiCl treatment resulted in similar Brn2 levels in both WT and Dvl1−/−3+/− NPCs (Supplementary Figure 6a and 6b). In contrast, Tbr2 levels were higher in Dvl1−/−3+/− NPCs than WT, and decreased upon LiCl treatment (Supplementary Figure 6a and 6c). These results suggest that Wnt signaling pathway regulates both Brn2 and Tbr2. We further hypothesized that Brn2 may directly regulate Tbr2 expression. ChIP analysis with a Brn2 antibody22 for two predicted Brn2 binding sites on the Tbr2 promoter (Figure 4h) demonstrated that these sites were significantly enriched for Brn2 binding in the WT but not in the Dvl1−/−3+/− cortex (Figure 4i). In addition, a known binding site of Brn2 on the nestin promoter41 was also significantly enriched for Brn2 binding in the WT but not in the Dvl1−/−3+/− cortex (Figure 4i)
To further support the direct regulation of Tbr2 by Brn2, we knocked down and overexpressed Brn2 in NPCs. We used lentiviral-based shRNA to reduce Brn2 levels in WT NPCs. Tbr2 mRNA and protein levels increased as Brn2 levels decreased over time (Supplementary Figure 6e and 6f), suggesting that Brn2 represses Tbr2 expression. We next transfected CAG-Brn2 into WT and Dvl1−/−3+/− NPCs, and found that the rapid growth rates of Dvl1−/−3+/− NPCs was reduced to WT levels after Brn2 overexpression (Figure 4j and 4k). Importantly, the expression pattern of Brn2 and Tbr2 in the Brn2 transfected Dvl1−/−3+/− NPCs resembled that of WT cells (Figure 4l), providing further support for the direct regulation of Tbr2 by Brn2. Collectively, these findings demonstrate that Brn2 directly represses Tbr2 expression, and suggest that reduced Brn2 levels in Dvl1−/−3+/− mice resulted in upregulation of Tbr2 and increased proliferation.
Brn2 regulates adult social behavior
If both embryonic brain enlargement and social behavior phenotypes in Dvl1 and Dvl3 mutants are mediated by Brn2 downregulation, then the phenotype of Brn2 null mice22 should be similar to the Dvl mutant phenotypes. Indeed, at E14.5, the thickness of the cortical wall was significantly greater in Brn2−/− embryos than in WT embryos (Figure Supplementary Figure 6g), due to expansion of the VZ and CP (Supplementary Figure 6h and Supplementary Table 3). There was an increase in Tbr2+ and Sox2+Tbr2+ cells in the VZ (Figure 4m and 4n) and early differentiation of Ctip2+ neurons in the CP (Figure 4m), similar to the Dvl1−/−3+/− embryos. Pools of both Sox2−Tbr2+ and Sox2+Tbr2+ cells are increased in Brn2−/− embryos compared to WT. It is important to note that Brn2 levels are completely reduced in Brn2−/− mice while in Dvl mutants Brn2 levels are reduced by about 50% (Figure 4c and Supplementary Figure 6a–b). This might explain the broader effect on the Tbr2+ cells in the Brn2−/− null embryos than Dvl1−/−3+/− mutants. Brn2 null mice die between P0 and P10, which precludes behavior testing of adults. Therefore, we examined Brn2+/− embryos and viable adults. We found that Brn2+/− embryos displayed VZ and CP expansion that was intermediate to the phenotypes of WT and Brn2−/− embryos (Figure 4n and Supplementary Figure 6h). Brn2+/− 6-week-old mice displayed reduced nest depth compared with WT mice (Figure 4o), and at 8–10 weeks, Brn2+/− mice did not display social preference, unlike their WT littermate controls (Figure 4p). In addition, at 12 weeks of age, Brn2+/− mice displayed increased marble burying compared with WT mice (Figure 4q). The similar embryonic progenitor and neuronal expansion phenotypes and adult behavior deficits found in Brn2 and Dvl mutant mice provide strong genetic support for the notion that the embryonic brain enlargement of Dvl1−/−3+/− mice is mediated by deregulation of the β-catenin/Brn2/Tbr2 transcriptional cascade, and that this prenatal deregulation causes the social behavior deficits observed in the adult mutant mice.
Prenatal canonical Wnt signaling regulates adult social behavior
We predicted that if the transient embryonic brain enlargement in Dvl1−/−3+/− mice, due to reduced prenatal β-catenin transcriptional activity, was the cause of the social behavior deficits observed in the adult Dvl1−/− and Dvl1−/−3+/− mice, then normalization of β-catenin specifically at the time of embryonic brain enlargement would rescue the adult social behavior phenotype. To test this hypothesis, we treated pregnant dams between E9.5–E14.5 with daily IP injections of 4 mg/kg CHIR99021 (Supplementary Figure 7a), a specific GSK3β inhibitor that activates intracellular canonical Wnt signaling42. At the end of the treatment (E14.5), we examined embryonic brain enlargement and the associated cellular phenotypes. CHIR99021 treatment between E9.5–E14.5 normalized brain weight (Supplementary Figure 7b), cerebral cortical wall thickness (Figure 5a and 5b), and CP thickness of Dvl1−/−3+/− E14.5 embryonic brains (Figure 5a and Figure 5d). In addition, CHIR99021 treatment between E9.5–E14.5 normalized the percentages of the doubly labeled Sox2+Tbr2+ NPCs in the E14.5 Dvl1−/− and Dvl1−/−3+/− brains (Figure 5e and 5h), as well as the number and width of Ctip2+ and Ctip2+Tbr1+ neurons, which mark the deep layer neurons in the CP (Figure 5i–l). Importantly, CHIR99021 treatment normalized Brn2 and β-catenin levels in Dvl1−/− and Dvl1−/−3+/− embryonic brains and increased Brn2 levels in Dvl1−/− brains (Supplementary Figure 8a–d). These findings demonstrate that CHIR99021 treatment rescued the brain enlargement and all of the associated cellular phenotypes in Dvl1−/− and Dvl1−/−3+/− embryos. CHIR99021 treatment had no effect on VZ thickness in any of the genotypes, as expected (Figure 5a and 5c). However, in WT mice, CHIR99021 treatment resulted in an increase in the percentages of the Sox2+Tbr2− cells (Figure 5e and 5f) and a decrease in the percentages of the Sox2−Tbr2+ cells (Figure 5e and 5g), providing additional support for the role of canonical Wnt signaling in regulating Tbr2 expression.
Figure 5. Embryonic activation of Wnt canonical pathway regulates Dvl1−/−3+/− embryonic brain phenotype.
a, WT and Dvl mutant brains at E14.5 following CHIR99021 treatment were Nissl stained and representative images are presented (scale bar: 100μm). Nissl stained images were quantified as a percentage of the average width of WT total neocortex (ANOVA<0.02) (b), ventricular zone (c) and cortical plate (ANOVA<0.001) (d). Results are presented as mean±SEM (n≥4, ANOVA<0.01; *p<0.02 for comparison of the brains from Dvl1−/−3+/− mock treated with those of WT mock treated embryos). e, Coronal sections of WT and Dvl mutant mock and CHIR99021 treated embryo brains at E14.5 were double label with anti-Sox2 (Red) and anti-Tbr2 (Green) and representative images are presented (scale bar: 100μm). Quantification presented as mean±SEM of Sox2 single labeled cells (f); Tbr2 single labeled cells (g) (n≥4, ANOVA<0.05 *p<0.03 for comparing the results of the WT mock and CHIR99021 treated embryos) and Sox2+Tbr2+ double labeled cells (h) (ANOVA<0.006; *p<0.01 for comparing the results of the Dvl1−/− and Dvl1−/−3+/− mock treated with those of the other embryo genotypes). (i) WT and Dvl1−/−3+/− brains at E14.5 from mock or CHIR99021 treated embryos were immunostained with DAPI (Blue) and anti-Ctip2 (Green) and representative images are presented (Scale bar: 200μm). j, Quantification of Ctip2+ cells (mean±SEM) are presented as percentage of the average number of Ctip2+ cells from WT mock treated embryos (n≥4, ANOVA<0.02; *p<0.01 for comparing the results of the Dvl1−/−3+/− mock treated with those of the Dvl1−/−3+/− CHIR99021 treated and WT embryos).
To test whether deficits in social behavior of adult Dvl1−/− and Dvl1−/−3+/− mutant mice originated from the developmental defects, we produced a cohort of adult mice treated in utero with CHIR99021 or mock treated (4mM DMSO in PBS) between E9.5–14.5 in and identical regimen that corrected the embryonic brain phenotypes. These adult mice were tested in the social behavior, marble burying, and open field tasks. At 6 weeks of age, mock treated Dvl1−/− and Dvl1−/−3+/− mutant mice displayed reduced nest depths compared with WT mice, as we had found previously, while the treatment with CHIR99021 during embryonic development normalized this behavior in Dvl1−/− and Dvl1−/−3+/− mutant mice (Figure 6a and Supplementary Figure 8e). At 8–10 weeks, WT mock treated males displayed social preference, and Dvl1−/− mock treated males did not, as expected (Figure 6b). By contrast, CHIR99021 treatment of Dvl1−/− mice rescued the lack of social preference of the Dvl1−/− mock treated mice (Figure 6b). Surprisingly, WT male mice treated with CHIR99021 as embryos did not display social preference, perhaps due to the effect of CHIR99021 treatment on Sox2+ (Figure 5f) and Tbr2+ (Figure 5g) cells. Females from the 129S6 strain do not display social preference in the three chamber social approach task43. Consistent with this, we found that mock and CHIR99021 treated females displayed no social preference regardless of genotype (Supplementary Figure 8f), and thus females were not informative in this task. In addition, out of the 7 litters that were treated with CHIR99021, no adult male Dvl1−/−3+/− mice were found (Dvl1−/−:Dvl1−/−3+/− male ratios were 14:0 and female ratios were 5:8), as the CHIR99021 treated Dvl1−/−3+/− neonates were born but died postnatally of unknown causes. Thus, Dvl1−/−3+/− males could not be tested in the social approach task. At 12 weeks of age, mock treated Dvl1−/−3+/− male and female mice displayed increased marble burying compared with WT mice, as we had found previously, while the treatment with CHIR99021 during embryonic development normalized this behavior in Dvl1−/−3+/− female mice (Figure 6c). WT male mice treated with CHIR99021 as embryos displayed increased marble burying compared with mock treated WT mice, providing additional support for the role of canonical Wnt signaling in regulating stereotypic behavior. There were no significant effects of genotype or treatment in the open field task (Figure 6d and 6e). Thus, CHIR99021 treatment displayed a degree of specificity for the development of social behavior and stereotypic behavior.
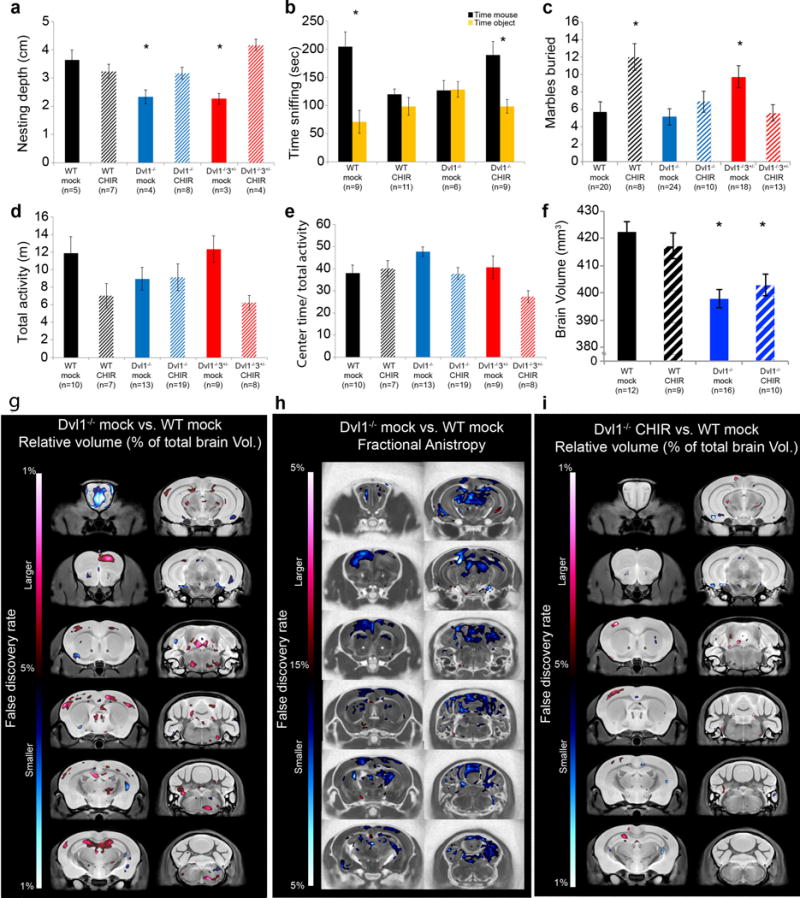
Figure 6. Prenatal Wnt canonical pathway regulates adult social behavior.
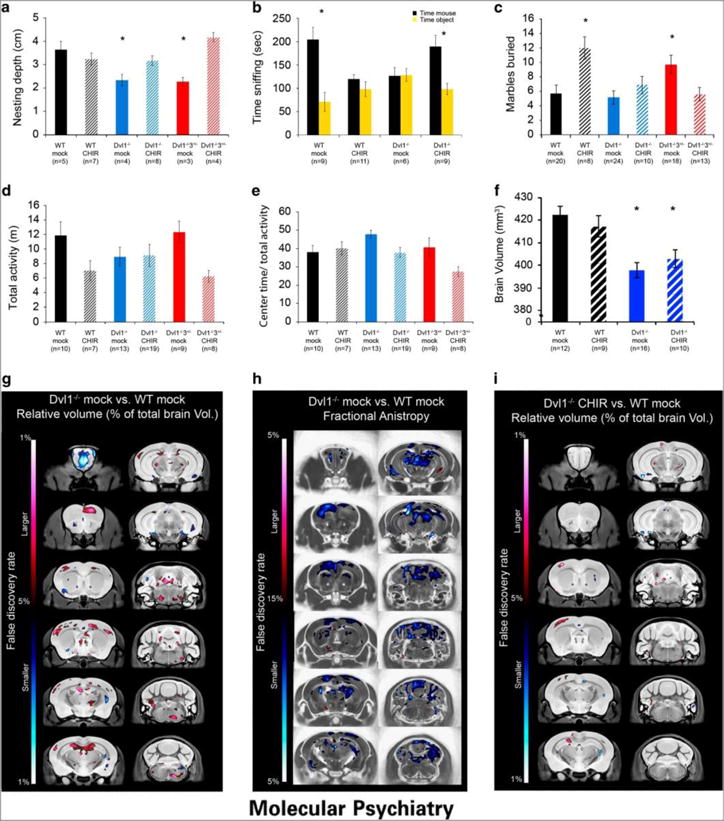
WT and Dvl mutant (Dvl1−/− and/or Dvl1−/−3+/−) adult mice treated with CHIR99021 or mock treated only as embryos (E9.5–14.5) were tested in behaviors found to be abnormal in the Dvl mutants. a, Nest depth was measured after 24hr and the recorded depth are presented as mean±SEM (n≥3, ANOVA<0.002; *p<0.04 for comparing the results of the Dvl1−/− and Dvl1−/−3+/− mock treated mice with those of the other mouse groups). b, The social approach task was recorded, scored and the results are presented as mean±SEM (*p<0.02 for comparing the results of the time spent sniffing the mouse compared with the object). c, The marble burying task was scored and the results are presented as mean±SEM (ANOVA<0.001 ;*p<0.03 for comparing the results of the Dvl1−/−3+/− mock treated and WT CHIR99021 treated mice with those of the other mouse). Total activity in the open field task (in meters distance traveled, d) the time spent in the center of the arena relative to their total activity (e) in the open field task are presented as mean±SEM. There were no significant genotypic differences in these tasks. WT and Dvl1−/− mock and CHIR mice treated in utero between E9.5–14.5 (n≥9) were imaged using an MRI separately, with both a T2-weighted anatomical scan and a subsequent Diffusion Tensor Imaging (DTI) scan. (f) Total brain volume (mm3) for the four groups are presented as mean±SEM (*p<0.0004 for comparison of the results from Dvl1−/− with those of WT brains). g, Voxel-wise analysis highlighting significant relative volume differences (false discovery rate, FDR) throughout the brain between the mock treated Dvl1−/− and WT mice (h) Fractional anisotropy (FA) analysis of significant differences (FDR) throughout the brain between the mock treated Dvl1−/− and WT mice. i, Voxel-wise analysis of significant relative volume differences (FDR) throughout the brain between the Dvl1−/− CHIR and WT mock treated mice.
These findings demonstrate that the rescue of the canonical Wnt pathway in Dvl1−/− and Dvl1−/−3+/− mutant embryos specifically during E9.5–14.5 rescued the embryonic cellular and molecular phenotypes of the developing cortex, as well as the adult social behavior deficits and the increase in stereotypic behavior. These data indicate that precise tuning of the Wnt canonical pathway during this critical developmental period is essential for the establishment of normal social and stereotypic behavior in the adult.
Prenatal canonical Wnt signaling rescues Dvl mutant adult brain architecture defects
Our previous work was unable to detect any gross histopathological abnormalities in Dvl1−/− mice12. To test whether adult Dvl1−/− mice (18 weeks old) present with brain morphological and structural deficits that may have originated from developmental defects, we produced a third cohort of adult mice treated in utero with CHIR99021 or mock treated (4mM DMSO in PBS) between E9.5–14.5 that corrected the embryonic and behavioral deficits of the Dvl mutants. Using a T2-weighted magnetic resonance (MR) imaging sequence and advanced registration techniques, we performed a volumetric analysis of the entire brain and 159 independent regions throughout the brain including but not limited to the several cortical delineations, large white matter structures (i.e. corpus callosum), ventricles, cerebellar structures, brain stem, and olfactory bulbs31–33. Dvl1−/− mock treated brains were smaller than WT brains (94% of WT volume), and that effect did not change following embryonic CHIR treatment in either WT or Dvl1−/− mice (Figure 6f). Thus, we assessed the neuroanatomy of the independent regions as relative volume to account for the brain volume difference between groups. We found that 21 out of the 159 independent regions displayed significantly different relative volumes between Dvl1−/− mock compared to WT mock brains (FDR<0.05), and these regions were often increased (Figure 6g and Supplementary Table 4). A bilateral increase in relative volume of the dentate gyrus and the dorsal raphe nuclei were of particular interest as they were also seen as some of the most affected regions in a previous report that examined 26 mouse models relevant to autism44. Diffusion Tensor Imaging (DTI) and subsequent analyses revealed that 68 out of the 159 independent regions were significantly different (FDR<0.10) in fractional anisotropy (FA), which was predominantly a decreased FA (Figure 6h and Supplementary Table 5).
CHIR99021 embryonic treatment did not affect either T2 or DTI imaging in WT mice. However, volumetric analysis revealed significant differences between mock and CHIR99021 embryonically treated Dvl1−/− mice. The olfactory bulbs and the lateral olfactory tract displayed a significant interaction between genotype and treatment, the most substantial of which was also found voxel-wise in the olfactory bulb (Supplementary Figure 9a–c). The second area where an interaction was found, also voxel-wise, was the tip of the cerebral peduncle seen in both an axial and coronal slice (Supplementary Figure 9b). We also examined the proportion of the voxels that displayed evidence of an improvement with treatment. We found that 74.7% and 81.2% of the voxels that were significantly different by volumetric analysis (Figure 6i) and FA analysis (Supplementary Figure 9a, Supplementary Table 4 and 5), respectively, in the Dvl1−/− mock vs. the WT mock trended towards recovery in the Dvl1−/− CHIR treated mice. Lastly, analysis of the relative volume of Dvl1−/− CHIR99021 compared to WT mock brains revealed that 6 of the 21 regions that were significantly different in Dvl1−/− mock vs. WT brains were not significantly different in the Dvl1−/− CHIR99021 treated brains, demonstrating a regional-specific normalization of brain structure. These regions were the fundus of the striatum, olfactory bulb, copula white matter frontal association cortex, primary motor cortex and the primary somatosensory cortex (Supplementary Table 4 and 6). Thus, CHIR99021 treatment displayed a degree of specificity for the development of specific brain structures, including several regions of the cerebral cortex.
Discussion
A β-catenin/Brn2/Tbr2 pathway regulates fetal brain growth and development, as well as adult social and repetitive behavior
Social interaction is a fundamental behavior found in nearly all organisms, but the molecular and cellular mechanisms governing this behavior are poorly understood. We generated Dvl1−/−3+/− mice, which allowed us to identify a β-catenin/Brn2/Tbr2 transcriptional pathway that regulates embryonic brain size and deep layer neurogenesis that is essential for normal social and stereotypic behaviors. We propose a model in which Dvl1 and Dvl3 facilitate canonical Wnt signaling via β-catenin to directly promote expression of the Brn2 transcription factor (Supplementary Figure 10a and 10b). Brn2 in turn acts as a direct repressor on the Tbr2 promoter to inhibit expression of this transcription factor (Supplementary Figure 10a and 10b) and the expansion of basal progenitors during deep layer neurogenesis (Supplementary Figure 10c and 10d).
Multiple lines of evidence support our proposed mechanism. The genetic loss of Dvl genes leads to an early enlargement of the embryonic brain, which is the result of a transient over-proliferation of neural progenitors in the cerebral cortex and premature differentiation of deep layer cortical neurons (Supplementary Figure 10c and 10d). During cortical development in WT mice (Supplementary Figure 10a), activation of the canonical Wnt pathway in the VZ results in the activation of β-catenin transcriptional activity, increased Brn2 expression, and suppression of Tbr2 in neural progenitors to promote accurate temporal proliferation and neurogenesis. In Dvl mutant mice (Supplementary Figure 10b), there is less activation of the canonical Wnt pathway, reduced β-catenin transcriptional activity in the VZ, decreased Brn2 expression, and premature expression of Tbr2. In vitro, both β-catenin transcriptional activity and Brn2 levels were decreased while Tbr2 levels were increased in cortical NPCs from Dvl1−/−3+/− versus WT embryos, associated with increased proliferation. Activation of β-catenin transcriptional activity in Dvl1−/−3+/− NPCs by LiCl reversed both the decrease in Brn2 levels and the increase in Tbr2 levels, resulting in reduced proliferation of the Dvl mutant NPCs. Knock-down of Brn2 in WT NPCs resulted in increased Tbr2, while forced expression of Brn2 rescued the proliferative phenotype of Dvl1−/−3+/− NPCs. Brn2 null mice phenocopied the embryonic cortical phenotype of the Dvl mutant mice, and Brn2 heterozygotes display similar adult behavior deficits (Figure 4m–q). Finally, the activation of the canonical Wnt pathway by CHIR99021 specifically during this critical embryonic period (E9.5–14.5) rescued the embryonic dysregulation of the β-catenin/Brn2/Tbr2 transcriptional cascade in the developing brain, the transient over-proliferation of neural progenitors and the premature differentiation of deep layer cortical neurons. Importantly, this treatment also rescued the social and stereotypic behavioral deficits that were observed in adult Dvl mutant mice. Finally, restoration of the canonical Wnt pathway in Dvl1−/− mutant embryos specifically during E9.5–14.5 resulted in the recovery of specific adult brain morphological and structural deficits, including areas of the cerebral cortex. The ability to reverse an adult phenotype by transient embryonic normalization of the Wnt pathway provides strong evidence for our model.
The β-catenin/Brn2/Tbr2 transcriptional cascade and its role in the regulation of NPC number and brain size during development have not been previously described, although features of this cascade are supported by previous studies. Early in neurogenesis, NPCs respond to Wnt stimulation by proliferating symmetrically, whereas later in development Wnts also induce neuronal differentiation by promoting terminal neurogenesis of intermediate progenitors (IPs)6, 45, 46. These studies highlight the complex temporal and context-dependent control of Wnt signaling in distinct progenitor types during brain development. It is likely that some of the temporal and context-dependent effects of β-catenin on NPCs are mediated by transcriptional regulation of Brn2. In melanoma cells, β-catenin directly regulates Brn2 expression and controls proliferation47, which implies that the regulation of Brn2 expression by canonical Wnt signaling is not unique to NPCs. In the brain, Brn2 is a positive regulator of genes that are expressed in apical NPCs such as Nestin41 and Sox248, while Brn2 co-regulates neurogenesis with Mash-149. Brn2 is one of three factors necessary for the direct reprogramming of fibroblasts to induced neurons by contributing long-term transcription of selected genes50. Similar to Dvl mutants, initial examination of Brn2 knockouts failed to reveal significant cortical brain abnormalities16, but our more detailed examination revealed that Brn2 mutant mice display similar embryonic brain enlargement and social behavior phenotypes as Dvl mutants, strongly supporting the linkage of these phenotypes and the molecular pathway. Dvl and Brn2 mutant mice are maintained on 129S6 and C57Bl6/J inbred genetic backgrounds, demonstrating that the embryonic brain development and the behavioral phenotypes are strain independent. Tbr2 null mice are severely affected and cortical layers are reduced in thickness, confirming that Tbr2+ IPs are necessary to expand the pool of the neurons of each cortical layer51. It was previously shown that sustained β-catenin activity in the developing cortex delays the onset of Tbr2 expression52, which is consistent with our finding that reduction of β-catenin activity due to the loss of Dvl genes resulted in an increase in Tbr2 expression, while CHIR99021 treatment of WT embryos resulted in reduce Tbr2 expression. In contrast to our findings, it was recently reported that Brn2 promotes the expression of Tbr253. This study employed the N2a cell line and the Engrailed dominant negative system to eliminate Brn2 function, which may result in off target effects on closely related POU-domain transcription factors such Brn1 and Oct6. Our studies used Brn2 genetic mutants as well as Brn2 knock-down or overexpression in primary cells with findings consistent with our model.
The initial expansion of deep layer neurons (Figure 3a–b) in Dvl1−/−3+/− mice was due to the deregulation of Brn2 levels, but the mechanism for the rapid decrease in the deep layer neurons at about E16.5 is not clear. We were unable to find evidence for several potential mechanisms that could account for the decrease of deep layer neurons. Premature NPCs depletion is unlikely to account for the deep layer neuronal decrease, since the later born superficial layer neurons are unaffected in the Dvl1−/−3+/− mice. Apoptosis of the increased numbers of deep layer neurons could potentially account for the deep layer neuronal decrease, but the number of apoptotic nuclei was not different between Dvl1−/−3+/− and WT mice at E16.5 (Supplementary Figure 11a). Interneurons invade the CP after E15.554, however, the number of GABA positive neurons in the cortex of E18.5 Dvl1−/−3+/− and WT mice are similar (Supplementary Figure 11b). Lastly, it was reported that microglia (Iba1+ cells) could limit the production of cortical neurons by phagocytizing neural precursor cells55. However, the number of Iba1+Tbr2+ cells was not different between Dvl1−/−3+/− and WT mice at E16.5 (Supplementary Figure 11c). Thus, we speculate that the rate of neurogenesis at early stages of cortical development in Dvl1−/−3+/− mice is rapid due to β-catenin transcriptional activity that drives the induction of basal identity of the progenitor pool, and then decreases at E16.5 due to the lack of β-catenin transcriptional activity (Supplementary Figure 5) and Brn2, a proneuronal transcription factor (Supplementary Figure 10e).
Redundancy of Dvl genes in development and social behavior
Our study was aimed at unraveling the molecular mechanism that controls abnormal social interaction behaviors in Dvl1 mutant mice. Adult Dvl1−/− mice display social interaction abnormalities, but detectable brain gross pathological abnormalities were not found that could account for their behavioral phenotypes12. One reason for the lack of detectable abnormalities in adult Dvl1−/− mutants is that the relevant phenotypes occurred during embryonic development, since Dvl1−/−3+/− embryos displayed brain enlargement mediated by expansion of basal progenitors during the production of deep layer neurons (E14.5). In addition, the known functional redundancy of Dvl2 and Dvl3 resulted in a subtle, difficult to detect brain phenotype in Dvl1−/− mice that was revealed only by after examination of Dvl1−/−3+/− mutants. Once embryonic brain defects were uncovered in Dvl1−/−3+/− mutants, some of these phenotypes were also found in Dvl1−/− or Dvl3+/− mutants. Functional redundancy among the Dvl genes results from their overlapping expression patterns and their high degree of conservation, and this is highlighted by their ability when overexpressed to cross-rescue phenotypes resulting from loss-of-function of other Dvl genes 14. Some of the embryonic brain phenotypes (Sox2+Tbr2+ cells at E14.5 and reduced Brn2 in layer 5 at E18.5) were found in all Dvl mutants, other phenotypes (cortical thickness) were present only in Dvl1−/− and Dvl1−/3+/− mutants, while all phenotypes were found in Dvl1−/−3+/− mutants. In addition, while Dvl1−/− and Dvl1−/3+/− mutants share the social behavior deficits, Dvl1−/3+/− mutants display additional behavioral deficits, such as marble burying (Figure 1d). These observations are consistent with complex functional redundancy of Dvl1 and Dvl3, affecting the penetrance and expressivity of an individual embryonic brain or adult social behavior phenotype in Dvl3+/−, Dvl1−/− and Dvl1−/−3+/− mutants, as is the complete penetrance of all phenotypes in the Dvl1−/−3+/− mutants. It does not appear that Dvl2 plays an important role in social behavior, since preliminary studies of Dvl2+/− and Dvl1+/−2+/− mutants did not reveal social interaction abnormalities (J.L., A.W.B., unpublished). This suggests that functional redundancy among Dvl genes is incomplete, which is supported by in vitro analysis of Dvl genes56.
Fetal development and autism
The embryonic brain enlargement and developmental defects displayed by Dvl mutant mice appear to be responsible for the adult social and stereotypic behavioral deficits displayed by Dvl mutants, supporting an embryonic origin for the social interaction phenotypes in the mouse. The embryonic brain phenotypes are mediated by expansion of basal progenitors during the production of deep layer neurons (E14.5) due to the dysregulation of a β-catenin/Brn2/Tbr2 transcriptional cascade. Premature neuronal differentiation of deep layer neurons was observed in Dvl mutant mice without affecting superficial layers (Figure 3). The initial enlargement was due to the deregulation of Brn2 levels. We speculate that the rate of neurogenesis at early stages of cortical development in Dvl1 mutant mice is rapid due to induction of basal identity of the progenitor pool, and then decreases due to the lack of β-catenin transcriptional activity (Supplementary Figure 5) and Brn2, a proneuronal transcription factor (Supplementary Figure 10e). The linkage of embryonic brain phenotypes and adult social interaction deficits in both Brn2 and Dvl1−/−3+/− mutants further supports the embryonic origin of the social behavioral deficits. Finally, the successful rescue of the embryonic brain defects in the Dvl mutants by the specific and restricted activation of the canonical Wnt pathway between E9.5 and E14.5 also rescued the adult social behavior deficits that were observed in Dvl1−/− and Dvl1−/−3+/− mutants. Surprisingly, CHIR99021 treatment resulted in lack of sociability and increase of stereotypic behavior in WT mice (Figure 6b and 6c), suggesting that both activation and inhibition of β-catenin canonical pathway during deep layer neurogenesis are associated with these behavioral abnormalities. Such a “bell-shaped” dose response relationship in canonical Wnt signaling was recently proposed for autism based on genetic studies in humans57, as well as in syndromic mouse models of autism, such as Tsc2(+/−) and Fmr1(−/y) mice58 and MECP2 gain- and loss-of-function mice59. This provides additional support for a bell-shaped dose response relationship in ASD.
The phenotypes and molecular mechanisms responsible for the behavioral defects in the Dvl mutants may model some aspects of autism. Dvl1−/−3+/− mutants displays both social deficits and repetitive patterns of behavior, similar to autism. Postmortem brain gene expression60, 61 and neuronal counting in young autistic cases 62 identified developmental disturbances in molecular and genetic mechanisms that govern proliferation, cell cycle regulation, and apoptosis, and inferred that these events occurred prior to birth. Two recent independent studies of human ASD genes identified spatial and temporal convergence of these genes in human mid-fetal cortical development63, 64. Interestingly, one study identified coexpression of ASD genes with deep layer 5/6 projection neurons63, 64, while the second study identified superficial layer glutamatergic inter- and intra-cortical neurons63, 64. In addition, two Wnt associated genes (Wnt10B and CTTNBP2) and Ctip2 (Bcl11b) were present in their coexpression networks with genes important for the development of autism64, supporting a role for prenatal canonical Wnt signaling in the development of deep layer neurons in humans.
Embryonic neurogenesis has been identified as a critical temporal period in other environmental and genetic mouse models of autism. Several known environmental exposure models, including maternal infection and maternal valproate administration, have emphasized the importance of this embryonic period65, 66. Knockdown of Tuberous sclerosis 1 (TSC1) from the thalamic circuitry at E12.5 alters neuronal physiology, resulting in both seizures and compulsive grooming in adult mice3. By contrast, only a subset of these phenotypes occurs when thalamic Tsc1 is deleted at a later embryonic stage.
Structural histopathological abnormalities in the adult Dvl1−/− mice that could account for their behavioral phenotypes have not been identified12. By employing state-of-the-art T2 and DTI MR imaging, we found that the whole brain volume of Dvl1−/− mice was reduced (Figure 6f) and that multiple brain regions of the Dvl mutant brains displayed abnormal size (Figure 6g–i and Supplementary Table 4–6). A previous report investigated 26 different mouse lines with relevance to autism, and clustered these lines into three large groups that differed in both directional volumetric differences as well as localization of anatomical phenotypes44. Based on this study, the Dvl1−/− mouse brain MRI phenotype corresponds to group 1, and closely and specifically resembles the Fmr1 (FVB) and Nrxn1α models, with less resemblance to the Shank3 and En2 models. The common phenotype of mouse mutant within this group is increased volumes in large white matter structures and frontal and parieto-temporal lobes as well as decreased volumes in the cerebellar cortex. Consistent with these mutants, the frontal (FDR=0.15) and parieto-temporal lobes (FDR=0.14) were increased in relative volume in the Dvl1−/− mice.
T2 and DTI MR imaging also revealed that of the 21 brain regions that were abnormal in Dvl1−/− mutants in the adult brain, 6 were rescued by CHIR99021 treatment: the fundus of the striatum; olfactory bulb; copula white matter; frontal association cortex; primary motor cortex; and the primary somatosensory cortex (Supplementary Table 4 and 6). These regions were previously reported to be associated with the neurological manifestation in autistic patients. The striatum was previously implicated in the stereotypic pattern of behavior 67. The abnormalities in the olfactory bulb could be associated with the heightened olfaction that was reported in autistic patients68. We have not behaviorally tested olfaction in Dvl mutant mice and future studies will be needed to address this in detail, both molecularly and behaviorally. The motor cortex and the copula (part of the cerebellum) structural abnormalities could participate in the motor impairments found in 80% of patients with autism69, as well as the reduced somatosensory response and connectivity in the somatosensory cortex found in autism70, 71. Lastly, the increased volume of the frontal association cortex (FAC) in Dvl1−/− mock treated mice was almost completely recovered by in utero CHIR99021 treatment (Figure 6i and Supplementary Figure 9c). Interestingly, the FAC was also increased, though not significantly, in WT mice that were in utero treated with CHIR99021 that also displayed abnormal behavior. The specific involvement of the FAC in the social behavioral deficits seen in Dvl1−/− mock treated and WT CHIR99021 treated mice, provides further support for an important role of the embryonic canonical β-catenin signaling on the development of specific brain structures central for the neurological/behavioral abnormalities in autism.
In summary, our studies of the Dvl and Brn2 mutant mice support a model in which abnormalities in embryonic brain development are responsible for abnormal adult brain structures and behavioral abnormalities. We identified a critical period during embryonic brain development for the establishment of normal social behavior in mice, when deep layer projection neurons are produced, which is regulated by a β-catenin/Brn2/Tbr2 transcriptional cascade. In addition, we link this critical period with abnormalities in specific adult brain structures. These findings are consistent with a model that autism may be caused by increased production of neurons during cortical prenatal development 62, specifically during the development of deep layer glutamatergic projection neurons63, 64. Further studies will be required to determine the consequences of the abnormal development of deep layer neurons to the adult brain circuitry and function and possible therapeutic interventions.
Supplementary Material
Acknowledgments
This research was supported by NINDS grants R01 NS073159 (AWB) and R01NS079231 (RYB & NA), the Simons Foundation SFARI #256769 (NA), the Ontario Brain Institute (JPL), and a Autism Speaks Translational Postdoctoral Fellowship #7587 (HB). Behavioral data were obtained with the help of the Gladstone Institute Behavioral Core (supported by NIH grant P30NS065780). This research was supported in part by the Intramural Research Program of the NIH, National Institute on Aging. We thank Peter Scacheri for his critical comments on the manuscript.
Footnotes
Conflict of Interest
We declare that there are no competing financial interests in relation to the work described here.
References
- 1.Rudie JD, Shehzad Z, Hernandez LM, Colich NL, Bookheimer SY, Iacoboni M, et al. Reduced functional integration and segregation of distributed neural systems underlying social and emotional information processing in autism spectrum disorders. Cereb Cortex. 2012;22(5):1025–1037. doi: 10.1093/cercor/bhr171. [DOI] [PMC free article] [PubMed] [Google Scholar]
- 2.Hagmann P, Cammoun L, Gigandet X, Meuli R, Honey CJ, Wedeen VJ, et al. Mapping the structural core of human cerebral cortex. PLoS Biol. 2008;6(7):e159. doi: 10.1371/journal.pbio.0060159. [DOI] [PMC free article] [PubMed] [Google Scholar]
- 3.Normand EA, Crandall SR, Thorn CA, Murphy EM, Voelcker B, Browning C, et al. Temporal and mosaic Tsc1 deletion in the developing thalamus disrupts thalamocortical circuitry, neural function, and behavior. Neuron. 2013;78(5):895–909. doi: 10.1016/j.neuron.2013.03.030. [DOI] [PMC free article] [PubMed] [Google Scholar]
- 4.Lui JH, Hansen DV, Kriegstein AR. Development and evolution of the human neocortex. Cell. 2011;146(1):18–36. doi: 10.1016/j.cell.2011.06.030. [DOI] [PMC free article] [PubMed] [Google Scholar]
- 5.Kuwahara A, Hirabayashi Y, Knoepfler PS, Taketo MM, Sakai J, Kodama T, et al. Wnt signaling and its downstream target N-myc regulate basal progenitors in the developing neocortex. Development. 2010;137(7):1035–1044. doi: 10.1242/dev.046417. [DOI] [PubMed] [Google Scholar]
- 6.Munji RN, Choe Y, Li G, Siegenthaler JA, Pleasure SJ. Wnt signaling regulates neuronal differentiation of cortical intermediate progenitors. J Neurosci. 2011;31(5):1676–1687. doi: 10.1523/JNEUROSCI.5404-10.2011. [DOI] [PMC free article] [PubMed] [Google Scholar]
- 7.Sokol SY, Klingensmith J, Perrimon N, Itoh K. Dorsalizing and neuralizing properties of Xdsh, a maternally expressed Xenopus homolog of dishevelled. Development. 1995;121(6):1637–1647. doi: 10.1242/dev.121.6.1637. [DOI] [PubMed] [Google Scholar]
- 8.Itoh K, Sokol SY. Graded amounts of Xenopus dishevelled specify discrete anteroposterior cell fates in prospective ectoderm. Mech Dev. 1997;61(1–2):113–125. doi: 10.1016/s0925-4773(96)00627-2. [DOI] [PubMed] [Google Scholar]
- 9.Fan S, Ramirez SH, Garcia TM, Dewhurst S. Dishevelled promotes neurite outgrowth in neuronal differentiating neuroblastoma 2A cells, via a DIX-domain dependent pathway. Brain Res Mol Brain Res. 2004;132(1):38–50. doi: 10.1016/j.molbrainres.2004.09.003. [DOI] [PubMed] [Google Scholar]
- 10.Luo ZG, Wang Q, Zhou JZ, Wang J, Luo Z, Liu M, et al. Regulation of AChR clustering by Dishevelled interacting with MuSK and PAK1. Neuron. 2002;35(3):489–505. doi: 10.1016/s0896-6273(02)00783-3. [DOI] [PubMed] [Google Scholar]
- 11.Schulte G, Bryja V, Rawal N, Castelo-Branco G, Sousa KM, Arenas E. Purified Wnt-5a increases differentiation of midbrain dopaminergic cells and dishevelled phosphorylation. J Neurochem. 2005;92(6):1550–1553. doi: 10.1111/j.1471-4159.2004.03022.x. [DOI] [PubMed] [Google Scholar]
- 12.Lijam N, Paylor R, McDonald MP, Crawley JN, Deng CX, Herrup K, et al. Social interaction and sensorimotor gating abnormalities in mice lacking Dvl1. Cell. 1997;90(5):895–905. doi: 10.1016/s0092-8674(00)80354-2. [DOI] [PubMed] [Google Scholar]
- 13.Long JM, LaPorte P, Paylor R, Wynshaw-Boris A. Expanded characterization of the social interaction abnormalities in mice lacking Dvl1. Genes Brain Behav. 2004;3(1):51–62. doi: 10.1046/j.1601-183x.2003.00045.x. [DOI] [PubMed] [Google Scholar]
- 14.Etheridge SL, Ray S, Li S, Hamblet NS, Lijam N, Tsang M, et al. Murine dishevelled 3 functions in redundant pathways with dishevelled 1 and 2 in normal cardiac outflow tract, cochlea, and neural tube development. PLoS Genet. 2008;4(11):e1000259. doi: 10.1371/journal.pgen.1000259. [DOI] [PMC free article] [PubMed] [Google Scholar]
- 15.Maretto S, Cordenonsi M, Dupont S, Braghetta P, Broccoli V, Hassan AB, et al. Mapping Wnt/beta-catenin signaling during mouse development and in colorectal tumors. Proc Natl Acad Sci U S A. 2003;100(6):3299–3304. doi: 10.1073/pnas.0434590100. [DOI] [PMC free article] [PubMed] [Google Scholar]
- 16.Schonemann MD, Ryan AK, McEvilly RJ, O’Connell SM, Arias CA, Kalla KA, et al. Development and survival of the endocrine hypothalamus and posterior pituitary gland requires the neuronal POU domain factor Brn-2. Genes Dev. 1995;9(24):3122–3135. doi: 10.1101/gad.9.24.3122. [DOI] [PubMed] [Google Scholar]
- 17.Ring DB, Johnson KW, Henriksen EJ, Nuss JM, Goff D, Kinnick TR, et al. Selective glycogen synthase kinase 3 inhibitors potentiate insulin activation of glucose transport and utilization in vitro and in vivo. Diabetes. 2003;52(3):588–595. doi: 10.2337/diabetes.52.3.588. [DOI] [PubMed] [Google Scholar]
- 18.Corbo JC, Deuel TA, Long JM, LaPorte P, Tsai E, Wynshaw-Boris A, et al. Doublecortin is required in mice for lamination of the hippocampus but not the neocortex. J Neurosci. 2002;22(17):7548–7557. doi: 10.1523/JNEUROSCI.22-17-07548.2002. [DOI] [PMC free article] [PubMed] [Google Scholar]
- 19.Yang M, Silverman JL, Crawley JN. Automated three-chambered social approach task for mice. Curr Protoc Neurosci. 2011 doi: 10.1002/0471142301.ns0826s56. Chapter 8: Unit 8 26. [DOI] [PMC free article] [PubMed] [Google Scholar]
- 20.Thomas A, Burant A, Bui N, Graham D, Yuva-Paylor LA, Paylor R. Marble burying reflects a repetitive and perseverative behavior more than novelty-induced anxiety. Psychopharmacology (Berl) 2009;204(2):361–373. doi: 10.1007/s00213-009-1466-y. [DOI] [PMC free article] [PubMed] [Google Scholar]
- 21.Schambra UB. Prenatal Mouse Brain Atlas. New York: Springer; 2008. [Google Scholar]
- 22.McEvilly RJ, de Diaz MO, Schonemann MD, Hooshmand F, Rosenfeld MG. Transcriptional regulation of cortical neuron migration by POU domain factors. Science. 2002;295(5559):1528–1532. doi: 10.1126/science.1067132. [DOI] [PubMed] [Google Scholar]
- 23.Nelson JD, Denisenko O, Bomsztyk K. Protocol for the fast chromatin immunoprecipitation (ChIP) method. Nat Protoc. 2006;1(1):179–185. doi: 10.1038/nprot.2006.27. [DOI] [PubMed] [Google Scholar]
- 24.Matys V, Kel-Margoulis OV, Fricke E, Liebich I, Land S, Barre-Dirrie A, et al. TRANSFAC and its module TRANSCompel: transcriptional gene regulation in eukaryotes. Nucleic Acids Res. 2006;34:D108–110. doi: 10.1093/nar/gkj143. Database issue. [DOI] [PMC free article] [PubMed] [Google Scholar]
- 25.Spring S, Lerch JP, Henkelman RM. Sexual dimorphism revealed in the structure of the mouse brain using three-dimensional magnetic resonance imaging. Neuroimage. 2007;35(4):1424–1433. doi: 10.1016/j.neuroimage.2007.02.023. [DOI] [PubMed] [Google Scholar]
- 26.Bock NA, Konyer NB, Henkelman RM. Multiple-mouse MRI. Magn Reson Med. 2003;49(1):158–167. doi: 10.1002/mrm.10326. [DOI] [PubMed] [Google Scholar]
- 27.Nieman BJ, Bock NA, Bishop J, Sled JG, Josette Chen X, Mark Henkelman R. Fast spin-echo for multiple mouse magnetic resonance phenotyping. Magn Reson Med. 2005;54(3):532–537. doi: 10.1002/mrm.20590. [DOI] [PubMed] [Google Scholar]
- 28.Jones DK, Horsfield MA, Simmons A. Optimal strategies for measuring diffusion in anisotropic systems by magnetic resonance imaging. Magn Reson Med. 1999;42(3):515–525. [PubMed] [Google Scholar]
- 29.Lerch JP, Carroll JB, Spring S, Bertram LN, Schwab C, Hayden MR, et al. Automated deformation analysis in the YAC128 Huntington disease mouse model. Neuroimage. 2008;39(1):32–39. doi: 10.1016/j.neuroimage.2007.08.033. [DOI] [PubMed] [Google Scholar]
- 30.Nieman BJ, Flenniken AM, Adamson SL, Henkelman RM, Sled JG. Anatomical phenotyping in the brain and skull of a mutant mouse by magnetic resonance imaging and computed tomography. Physiol Genomics. 2006;24(2):154–162. doi: 10.1152/physiolgenomics.00217.2005. [DOI] [PubMed] [Google Scholar]
- 31.Dorr AE, Lerch JP, Spring S, Kabani N, Henkelman RM. High resolution three-dimensional brain atlas using an average magnetic resonance image of 40 adult C57Bl/6J mice. Neuroimage. 2008;42(1):60–69. doi: 10.1016/j.neuroimage.2008.03.037. [DOI] [PubMed] [Google Scholar]
- 32.Steadman PE, Ellegood J, Szulc KU, Turnbull DH, Joyner AL, Henkelman RM, et al. Genetic effects on cerebellar structure across mouse models of autism using a magnetic resonance imaging atlas. Autism Res. 2014;7(1):124–137. doi: 10.1002/aur.1344. [DOI] [PMC free article] [PubMed] [Google Scholar]
- 33.Ullmann JF, Watson C, Janke AL, Kurniawan ND, Reutens DC. A segmentation protocol and MRI atlas of the C57BL/6J mouse neocortex. Neuroimage. 2013;78:196–203. doi: 10.1016/j.neuroimage.2013.04.008. [DOI] [PubMed] [Google Scholar]
- 34.Genovese CR, Lazar NA, Nichols T. Thresholding of statistical maps in functional neuroimaging using the false discovery rate. Neuroimage. 2002;15(4):870–878. doi: 10.1006/nimg.2001.1037. [DOI] [PubMed] [Google Scholar]
- 35.Hamblet NS, Lijam N, Ruiz-Lozano P, Wang J, Yang Y, Luo Z, et al. Dishevelled 2 is essential for cardiac outflow tract development, somite segmentation and neural tube closure. Development. 2002;129(24):5827–5838. doi: 10.1242/dev.00164. [DOI] [PubMed] [Google Scholar]
- 36.Wang J, Hamblet NS, Mark S, Dickinson ME, Brinkman BC, Segil N, et al. Dishevelled genes mediate a conserved mammalian PCP pathway to regulate convergent extension during neurulation. Development. 2006;133(9):1767–1778. doi: 10.1242/dev.02347. [DOI] [PMC free article] [PubMed] [Google Scholar]
- 37.Nieto M, Monuki ES, Tang H, Imitola J, Haubst N, Khoury SJ, et al. Expression of Cux-1 and Cux-2 in the subventricular zone and upper layers II–IV of the cerebral cortex. J Comp Neurol. 2004;479(2):168–180. doi: 10.1002/cne.20322. [DOI] [PubMed] [Google Scholar]
- 38.Ferland RJ, Cherry TJ, Preware PO, Morrisey EE, Walsh CA. Characterization of Foxp2 and Foxp1 mRNA and protein in the developing and mature brain. J Comp Neurol. 2003;460(2):266–279. doi: 10.1002/cne.10654. [DOI] [PubMed] [Google Scholar]
- 39.Goodall J, Martinozzi S, Dexter TJ, Champeval D, Carreira S, Larue L, et al. Brn-2 expression controls melanoma proliferation and is directly regulated by beta-catenin. Mol Cell Biol. 2004;24(7):2915–2922. doi: 10.1128/MCB.24.7.2915-2922.2004. [DOI] [PMC free article] [PubMed] [Google Scholar]
- 40.Jho EH, Zhang T, Domon C, Joo CK, Freund JN, Costantini F. Wnt/beta-catenin/Tcf signaling induces the transcription of Axin2, a negative regulator of the signaling pathway. Mol Cell Biol. 2002;22(4):1172–1183. doi: 10.1128/MCB.22.4.1172-1183.2002. [DOI] [PMC free article] [PubMed] [Google Scholar]
- 41.Jin Z, Liu L, Bian W, Chen Y, Xu G, Cheng L, et al. Different transcription factors regulate nestin gene expression during P19 cell neural differentiation and central nervous system development. J Biol Chem. 2009;284(12):8160–8173. doi: 10.1074/jbc.M805632200. [DOI] [PMC free article] [PubMed] [Google Scholar]
- 42.Ye S, Tan L, Yang R, Fang B, Qu S, Schulze EN, et al. Pleiotropy of glycogen synthase kinase-3 inhibition by CHIR99021 promotes self-renewal of embryonic stem cells from refractory mouse strains. PLoS One. 2012;7(4):e35892. doi: 10.1371/journal.pone.0035892. [DOI] [PMC free article] [PubMed] [Google Scholar]
- 43.Moy SS, Nonneman RJ, Young NB, Demyanenko GP, Maness PF. Impaired sociability and cognitive function in Nrcam-null mice. Behav Brain Res. 2009;205(1):123–131. doi: 10.1016/j.bbr.2009.06.021. [DOI] [PMC free article] [PubMed] [Google Scholar]
- 44.Ellegood J, Anagnostou E, Babineau BA, Crawley JN, Lin L, Genestine M, et al. Clustering autism: using neuroanatomical differences in 26 mouse models to gain insight into the heterogeneity. Mol Psychiatry. 2015;20(1):118–125. doi: 10.1038/mp.2014.98. [DOI] [PMC free article] [PubMed] [Google Scholar]
- 45.Hirabayashi Y, Itoh Y, Tabata H, Nakajima K, Akiyama T, Masuyama N, et al. The Wnt/beta-catenin pathway directs neuronal differentiation of cortical neural precursor cells. Development. 2004;131(12):2791–2801. doi: 10.1242/dev.01165. [DOI] [PubMed] [Google Scholar]
- 46.Chenn A, Walsh CA. Regulation of cerebral cortical size by control of cell cycle exit in neural precursors. Science. 2002;297(5580):365–369. doi: 10.1126/science.1074192. [DOI] [PubMed] [Google Scholar]
- 47.Goodall J, Carreira S, Denat L, Kobi D, Davidson I, Nuciforo P, et al. Brn-2 represses microphthalmia-associated transcription factor expression and marks a distinct subpopulation of microphthalmia-associated transcription factor-negative melanoma cells. Cancer Res. 2008;68(19):7788–7794. doi: 10.1158/0008-5472.CAN-08-1053. [DOI] [PubMed] [Google Scholar]
- 48.Catena R, Tiveron C, Ronchi A, Porta S, Ferri A, Tatangelo L, et al. Conserved POU binding DNA sites in the Sox2 upstream enhancer regulate gene expression in embryonic and neural stem cells. J Biol Chem. 2004;279(40):41846–41857. doi: 10.1074/jbc.M405514200. [DOI] [PubMed] [Google Scholar]
- 49.Castro DS, Skowronska-Krawczyk D, Armant O, Donaldson IJ, Parras C, Hunt C, et al. Proneural bHLH and Brn proteins coregulate a neurogenic program through cooperative binding to a conserved DNA motif. Dev Cell. 2006;11(6):831–844. doi: 10.1016/j.devcel.2006.10.006. [DOI] [PubMed] [Google Scholar]
- 50.Wapinski OL, Vierbuchen T, Qu K, Lee QY, Chanda S, Fuentes DR, et al. Hierarchical mechanisms for direct reprogramming of fibroblasts to neurons. Cell. 2013;155(3):621–635. doi: 10.1016/j.cell.2013.09.028. [DOI] [PMC free article] [PubMed] [Google Scholar]
- 51.Sessa A, Mao CA, Hadjantonakis AK, Klein WH, Broccoli V. Tbr2 directs conversion of radial glia into basal precursors and guides neuronal amplification by indirect neurogenesis in the developing neocortex. Neuron. 2008;60(1):56–69. doi: 10.1016/j.neuron.2008.09.028. [DOI] [PMC free article] [PubMed] [Google Scholar]
- 52.Wrobel CN, Mutch CA, Swaminathan S, Taketo MM, Chenn A. Persistent expression of stabilized beta-catenin delays maturation of radial glial cells into intermediate progenitors. Dev Biol. 2007;309(2):285–297. doi: 10.1016/j.ydbio.2007.07.013. [DOI] [PMC free article] [PubMed] [Google Scholar]
- 53.Dominguez MH, Ayoub AE, Rakic P. POU-III Transcription Factors (Brn1, Brn2, and Oct6) Influence Neurogenesis, Molecular Identity, and Migratory Destination of Upper-Layer Cells of the Cerebral Cortex. Cereb Cortex. 2012 doi: 10.1093/cercor/bhs252. [DOI] [PMC free article] [PubMed] [Google Scholar]
- 54.Lopez-Bendito G, Sanchez-Alcaniz JA, Pla R, Borrell V, Pico E, Valdeolmillos M, et al. Chemokine signaling controls intracortical migration and final distribution of GABAergic interneurons. J Neurosci. 2008;28(7):1613–1624. doi: 10.1523/JNEUROSCI.4651-07.2008. [DOI] [PMC free article] [PubMed] [Google Scholar]
- 55.Cunningham CL, Martinez-Cerdeno V, Noctor SC. Microglia regulate the number of neural precursor cells in the developing cerebral cortex. J Neurosci. 2012;33(10):4216–4233. doi: 10.1523/JNEUROSCI.3441-12.2013. [DOI] [PMC free article] [PubMed] [Google Scholar]
- 56.Lamb AN, Rosenfeld JA, Neill NJ, Talkowski ME, Blumenthal I, Girirajan S, et al. Haploinsufficiency of SOX5 at 12p12.1 is associated with developmental delays with prominent language delay, behavior problems, and mild dysmorphic features. Hum Mutat. 2012;33(4):728–740. doi: 10.1002/humu.22037. [DOI] [PMC free article] [PubMed] [Google Scholar]
- 57.Kalkman HO. A review of the evidence for the canonical Wnt pathway in autism spectrum disorders. Mol Autism. 2012;3(1):10. doi: 10.1186/2040-2392-3-10. [DOI] [PMC free article] [PubMed] [Google Scholar]
- 58.Auerbach BD, Osterweil EK, Bear MF. Mutations causing syndromic autism define an axis of synaptic pathophysiology. Nature. 2011;480(7375):63–68. doi: 10.1038/nature10658. [DOI] [PMC free article] [PubMed] [Google Scholar]
- 59.Lombardi LM, Baker SA, Zoghbi HY. MECP2 disorders: from the clinic to mice and back. J Clin Invest. 2015;125(8):2914–2923. doi: 10.1172/JCI78167. [DOI] [PMC free article] [PubMed] [Google Scholar]
- 60.Chow ML, Pramparo T, Winn ME, Barnes CC, Li HR, Weiss L, et al. Age-dependent brain gene expression and copy number anomalies in autism suggest distinct pathological processes at young versus mature ages. PLoS Genet. 8(3):e1002592. doi: 10.1371/journal.pgen.1002592. [DOI] [PMC free article] [PubMed] [Google Scholar]
- 61.Voineagu I, Wang X, Johnston P, Lowe JK, Tian Y, Horvath S, et al. Transcriptomic analysis of autistic brain reveals convergent molecular pathology. Nature. 2011;474(7351):380–384. doi: 10.1038/nature10110. [DOI] [PMC free article] [PubMed] [Google Scholar]
- 62.Courchesne E, Mouton PR, Calhoun ME, Semendeferi K, Ahrens-Barbeau C, Hallet MJ, et al. Neuron number and size in prefrontal cortex of children with autism. Jama. 2011;306(18):2001–2010. doi: 10.1001/jama.2011.1638. [DOI] [PubMed] [Google Scholar]
- 63.Parikshak NN, Luo R, Zhang A, Won H, Lowe JK, Chandran V, et al. Integrative functional genomic analyses implicate specific molecular pathways and circuits in autism. Cell. 2013;155(5):1008–1021. doi: 10.1016/j.cell.2013.10.031. [DOI] [PMC free article] [PubMed] [Google Scholar]
- 64.Willsey AJ, Sanders SJ, Li M, Dong S, Tebbenkamp AT, Muhle RA, et al. Coexpression networks implicate human midfetal deep cortical projection neurons in the pathogenesis of autism. Cell. 2013;155(5):997–1007. doi: 10.1016/j.cell.2013.10.020. [DOI] [PMC free article] [PubMed] [Google Scholar]
- 65.Go HS, Kim KC, Choi CS, Jeon SJ, Kwon KJ, Han SH, et al. Prenatal exposure to valproic acid increases the neural progenitor cell pool and induces macrocephaly in rat brain via a mechanism involving the GSK-3beta/beta-catenin pathway. Neuropharmacology. 2012;63(6):1028–1041. doi: 10.1016/j.neuropharm.2012.07.028. [DOI] [PubMed] [Google Scholar]
- 66.Patterson PH. Modeling autistic features in animals. Pediatr Res. 2011;69(5 Pt 2):34R–40R. doi: 10.1203/PDR.0b013e318212b80f. [DOI] [PMC free article] [PubMed] [Google Scholar]
- 67.Rothwell PE, Fuccillo MV, Maxeiner S, Hayton SJ, Gokce O, Lim BK, et al. Autism-associated neuroligin-3 mutations commonly impair striatal circuits to boost repetitive behaviors. Cell. 2014;158(1):198–212. doi: 10.1016/j.cell.2014.04.045. [DOI] [PMC free article] [PubMed] [Google Scholar]
- 68.Ashwin C, Chapman E, Howells J, Rhydderch D, Walker I, Baron-Cohen S. Enhanced olfactory sensitivity in autism spectrum conditions. Mol Autism. 2014;5:53. doi: 10.1186/2040-2392-5-53. [DOI] [PMC free article] [PubMed] [Google Scholar]
- 69.Nebel MB, Joel SE, Muschelli J, Barber AD, Caffo BS, Pekar JJ, et al. Disruption of functional organization within the primary motor cortex in children with autism. Hum Brain Mapp. 2012;35(2):567–580. doi: 10.1002/hbm.22188. [DOI] [PMC free article] [PubMed] [Google Scholar]
- 70.Khan S, Michmizos K, Tommerdahl M, Ganesan S, Kitzbichler MG, Zetino M, et al. Somatosensory cortex functional connectivity abnormalities in autism show opposite trends, depending on direction and spatial scale. Brain. 2015;138(Pt 5):1394–1409. doi: 10.1093/brain/awv043. [DOI] [PMC free article] [PubMed] [Google Scholar]
- 71.Marco EJ, Khatibi K, Hill SS, Siegel B, Arroyo MS, Dowling AF, et al. Children with autism show reduced somatosensory response: an MEG study. Autism Res. 2012;5(5):340–351. doi: 10.1002/aur.1247. [DOI] [PMC free article] [PubMed] [Google Scholar]
Associated Data
This section collects any data citations, data availability statements, or supplementary materials included in this article.