Abstract
Environmentally induced epigenetic transgenerational inheritance of disease and phenotypic variation has been shown to involve DNA methylation alterations in the germline (e.g. sperm). These differential DNA methylation regions (DMRs) are termed epimutations and in part transmit the transgenerational phenotypes. The agricultural fungicide vinclozolin exposure of a gestating female rat has previously been shown to promote transgenerational disease and epimutations in F3 generation (great-grand-offspring) animals. The current study was designed to investigate the actions of direct fetal exposure on the F1 generation rat sperm DMRs compared to the F3 transgenerational sperm DMRs. A protocol involving methylated DNA immunoprecipitation (MeDIP) followed by next-generation sequencing (Seq) was used in the current study. Bioinformatics analysis of the MeDIP-Seq data was developed and several different variations in the bioinformatic analysis were evaluated. Observations indicate needs to be considered. Interestingly, the F1 generation DMRs were found to be fewer in number and for the most part distinct from the F3 generation epimutations. Observations suggest the direct exposure induced F1 generation sperm DMRs appear to promote in subsequent generations alterations in the germ cell developmental programming that leads to the distinct epimutations in the F3 generation. This may help explain the differences in disease and phenotypes between the direct exposure F1 generation and transgenerational F3 generation. Observations demonstrate a distinction between the direct exposure versus transgenerational epigenetic programming induced by environmental exposures and provide insights into the molecular mechanisms involved in the epigenetic transgenerational inheritance phenomenon.
Keywords: environmental epigenetics, transgenerational, MeDIP-Seq, DMR, bioinformatics, DNA methylation
Introduction
One of the first observations of environmentally induced epigenetic transgenerational inheritance of disease involved the fungicide vinclozolin [1]. Vinclozolin is an antiandrogenic compound that is one of the most commonly used fungicides in the fruit and vegetable industry [2]. Vinclozolin has been shown to promote transgenerational phenotypes in mice and rats by a number of different laboratories [1, 3–7]. The current study was not designed to examine vinclozolin risk assessment, but to further investigate epigenetic transgenerational actions of vinclozolin and assess the different analysis methods. The molecular mechanism involved in the transgenerational inheritance of disease requires an epigenetic modification of the germline (sperm or egg) [1, 8, 9]. Initially an alteration in DNA methylation was observed [1, 10, 11], but more recently alterations in non-coding RNA expression [12, 13] and histone retention [14, 15] in the germ cells have also been observed. Therefore, the integrated actions of DNA methylation, ncRNA, and histone retention may be involved in the epigenetic inheritance process [16, 17]. Over the past ten years a large number of laboratories have demonstrated environmentally induced epigenetic transgenerational inheritance phenotypes in a variety of organisms [8, 18, 19]. In the rat studies, similar actions have been observed with vinclozolin, plastic compounds bisphenol A (BPA) and phthalates, hydrocarbon mixture (jet fuel), dioxin, insect repellent DEET and pesticides permethrin, methoxychlor and DDT, and tributyltin [1, 20–29]. The phenomenon has now been observed in plants, insects, worms, fish, birds, pigs, rodents, and humans, so appears highly conserved [8, 30–34].
In considering the phenomenon of environmentally induced epigenetic transgenerational inheritance a distinction needs to be made for direct exposure impacts versus the transgenerational impacts in the absence of continued exposure [8, 35]. When a gestating female is exposed at the critical period of gonadal sex determination (days 8–14 rat or weeks 6–18 humans), the F0 generation female, the F1 generation fetus, and the germline that will generate the F2 generation are directly exposed, such that the F3 generation is the first transgenerational generation not having direct exposure [35]. When an adult male or non-pregnant female is exposed the F0 generation adult and the germline that will generate the F1 generation offspring are directly exposed, such that the F2 generation is the first transgenerational generation not having direct exposure [35]. Previous studies have demonstrated differences and similarities between the F1 and F3 generation disease and phenotypes for a number of different exposures [7, 25, 27, 28]. The focus of the previous epigenetic analysis has been on the F3 generation sperm to address the transgenerational mechanism [10, 26]. An important question not previously investigated in mammals is how the epigenetics of the direct exposure F1 generation sperm compares with the transgenerational F3 generation sperm. One possibility is that the same epimutations are present in both the F1 and F3 generation sperm. Alternatively, the germline epigenetic developmental programming may be different between the generations leading to distinct epimutations. The current study was designed to investigate this comparison using more advanced molecular technologies.
The original analysis of the environmentally induced epigenetic transgenerational inheritance of sperm epimutations involved methylated DNA immunoprecipitation (MeDIP) followed by tiling array chips (Chip) of genome wide promoter regions of the genome [10, 11, 26]. This MeDIP-Chip analysis identified differential DNA methylation regions (DMRs) or epimutations in F3 generation sperm for a variety of toxicant induced transgenerational lineages [26]. Interestingly, the epimutation sites for the different exposures were found to be primarily exposure specific [26]. The MeDIP-Chip technology is useful but is limited to the oligonucleotides on the array, so does not consider the entire genome easily. A more advanced technology involves next-generation sequencing (NGS) for an MeDIP-Seq analysis that is genome-wide and not limited to selected oligonucleotides [36]. An MeDIP-Seq protocol was developed and is presented in the current study, along with the associated bioinformatics used to analyze the data. This study also investigates optimization of different bioinformatics approaches, pointing out the advantages and disadvantages of each.
The current study was designed to investigate and compare the genome-wide DMRs between the direct exposure F1 generation and transgenerational F3 generation sperm in control versus vinclozolin lineage rats. This is one of the first comparison of the F1 and F3 generation sperm epigenetic alterations. An advanced MeDIP-Seq protocol with associated bioinformatics was optimized and investigated. Interestingly, the DMRs of the F1 versus F3 generation sperm were found to be largely distinct. The mechanism and insights provided into environmentally induced epigenetic transgenerational inheritance phenomena are discussed.
Results
MeDip-Seq Protocol and Bioinformatics
An MeDIP-Seq protocol was developed which used more advanced technology in the MeDIP procedure with the use of magnetic beads for the immunoprecipitation as outlined in the Methods. This increased the speed and reduced the non-specific binding associated with agarose bead protocols. The MeDIP DNA was used to generate NGS libraries with modifications to the manufacturer’s protocol to address the single stranded status of the MeDIP DNA, as described in the Methods. The libraries were then used for NGS to complete the MeDIP-Seq procedure. An outline of the major steps of the protocol is presented in Supplementary Fig. S1 and details presented in the Methods.
NGS was performed on an Illumina platform (2500) generating approximately 35 million reads per sample. The sequencing quality control and processing procedure is outlined in the Methods. A bioinformatics pipeline was developed for each step in the analysis as summarized in Supplementary Fig. S2. The details of the bioinformatics approach are presented in the Methods and include mapping, filtering, normalization, differential methylation analysis, genomic feature characterization, including size (kb) and CpG density, and gene association identification. Optimization of the pipeline involved varying the filtering parameters and normalization strategy to determine how these steps impacted the resulting DMR identification. The filtering was done using three different read depth thresholds. Similarly, three different normalization strategies were also evaluated. The specific analysis details are described in the Methods. Initially, the results using largely default parameters to the MEDIPS R package analysis are presented for all the DMR data. Subsequently, the results of analyses with deviations from these defaults are shown in the ‘Bioinformatics Optimization’ section.
Differential DMR Analysis
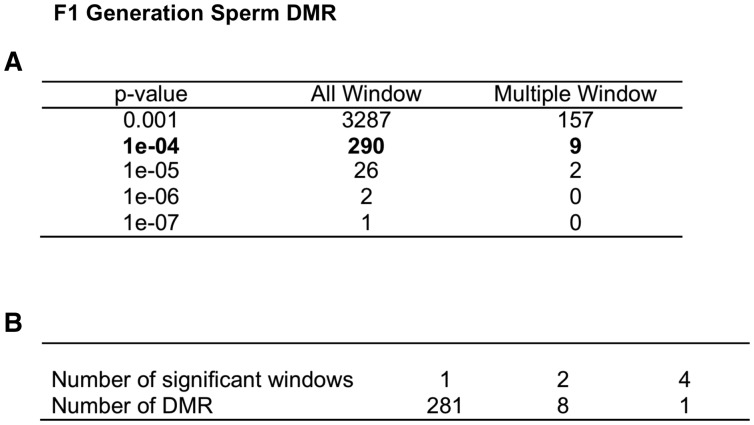
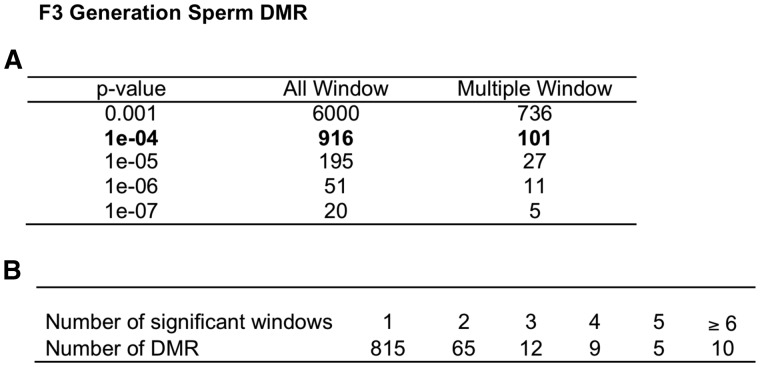
For the main analysis, parameters close to the defaults provided by the MEDIPS R package were used. A detailed summary of these can be found in the Methods. The F1 generation control versus vinclozolin lineage sperm DMR analysis identified 290 total DMRs with a P < 10−4 as shown in Fig. 1. The DMR numbers for various P values are listed for all DMRs and those with multiple window (e.g. adjacent) DMR. Further analysis shows the majority of DMR include a single 100 bp window with an edgeR P-value < 10−4 (Fig. 1B). The ratio of total reads associated with the DMR (control/total) for comparison identified DMRs with an increase (∼70%) or decrease (∼30%) in DNA methylation in the vinclozolin lineage sperm (data not shown). The F3 generation control versus vinclozolin lineage sperm DMR analysis identified 916 total DMR with an edgeR P-value < 10−4 as shown in Fig. 2A. The P < 10−4 was selected to allow a more balanced data analysis and stringent DMR selection. The DMR numbers for various P values are listed for all DMRs and those with multiple 100 bp windows with an edgeR P-value < 10−4. The majority of the DMR have a single 100 bp window, while a small number of DMR have ≥2 windows and some with greater than 5 windows (Fig. 2B). Similar to the F1 generation DMR, the F3 generation DMRs also had a (∼70/30%) mixture of both an increase and decrease in DNA methylation (data not shown). Observations demonstrate a three-fold higher number of DMRs in the F3 generation sperm than the F1 generation sperm.
Figure 1:
F1 generation sperm DMR. (A) The number of DMR found using different P-value cutoff thresholds. The all Window column shows all DMRs. The multiple Window column shows the number of DMRs containing at least two significant windows. (B) The number of DMR with each specific number of significant windows at a P-value threshold of 1e-04
Figure 2:
F3 generation sperm DMR. (A) The number of DMRs found using different P-value cutoff thresholds. The all Window column shows all DMRs. The multiple Window column shows the number of DMRs containing at least two significant windows. (B) The number of DMR with each specific number of significant windows at a P-value threshold of 1e-04
The genomic locations of the DMRs identified are presented using a chromosomal plot previously described [10]. The F1 generation DMRs was identified on all chromosomes except the Y chromosome and mitochondrial DNA (Fig. 3). When a statistically over-represented cluster of DMR is present, a black box under the chromosome bar is shown. Red arrow heads identify individual DMR. The genome locations of the F3 generation DMRs are presented in Fig. 4 and show all chromosomes contain DMRs except the Y mitochondrial chromosome. A list of the DMRs for F1 generation sperm is presented in Supplementary Table S1 and for F3 generation sperm in Supplementary Table S2. A list of the DMR clusters is presented in Supplementary Table S3 for both the F1 and F3 generation DMR clusters.
Figure 3:
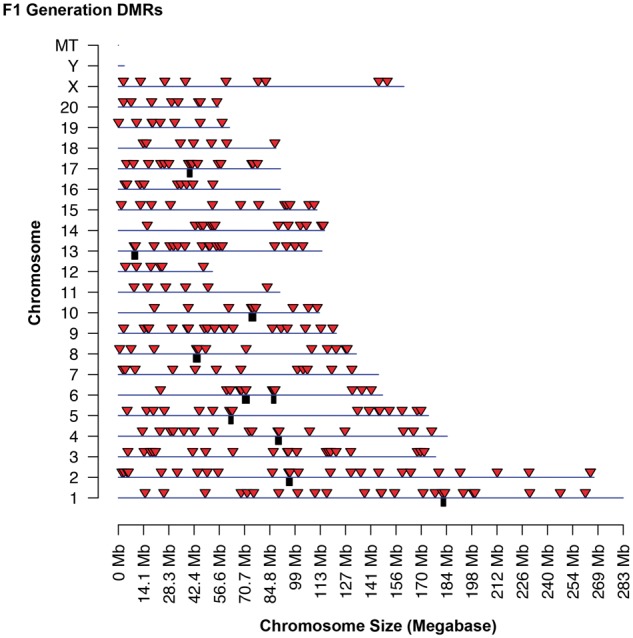
F1 generation DMR chromosomal locations. The F1 generation sperm DMR locations on the individual chromosomes. All window DMRs at a P-value threshold of 1e-04 are shown here. The red arrowhead identifies the location of the DMR and black box identifies the DMR cluster site
Figure 4:
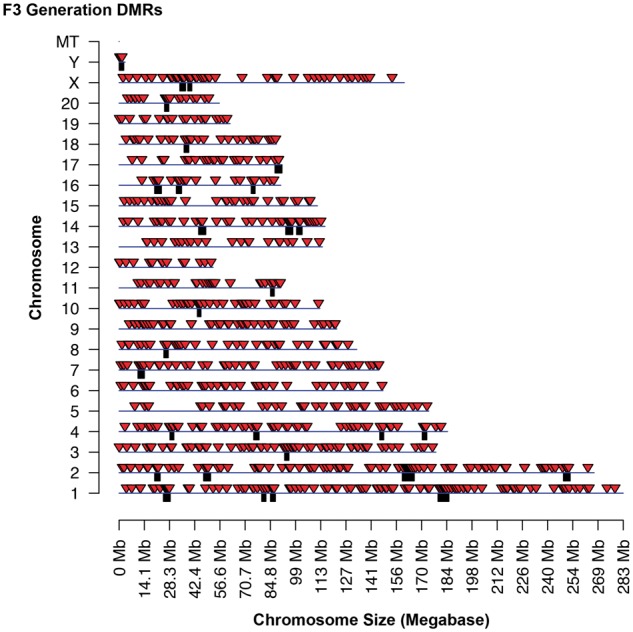
F3 generation DMR chromosomal locations. The F3 generation sperm DMR locations on the individual chromosomes. All window DMRs at a P-value threshold of 1e-04 are shown here. The red arrowhead identifies the location of the DMR and black box identifies the DMR cluster site
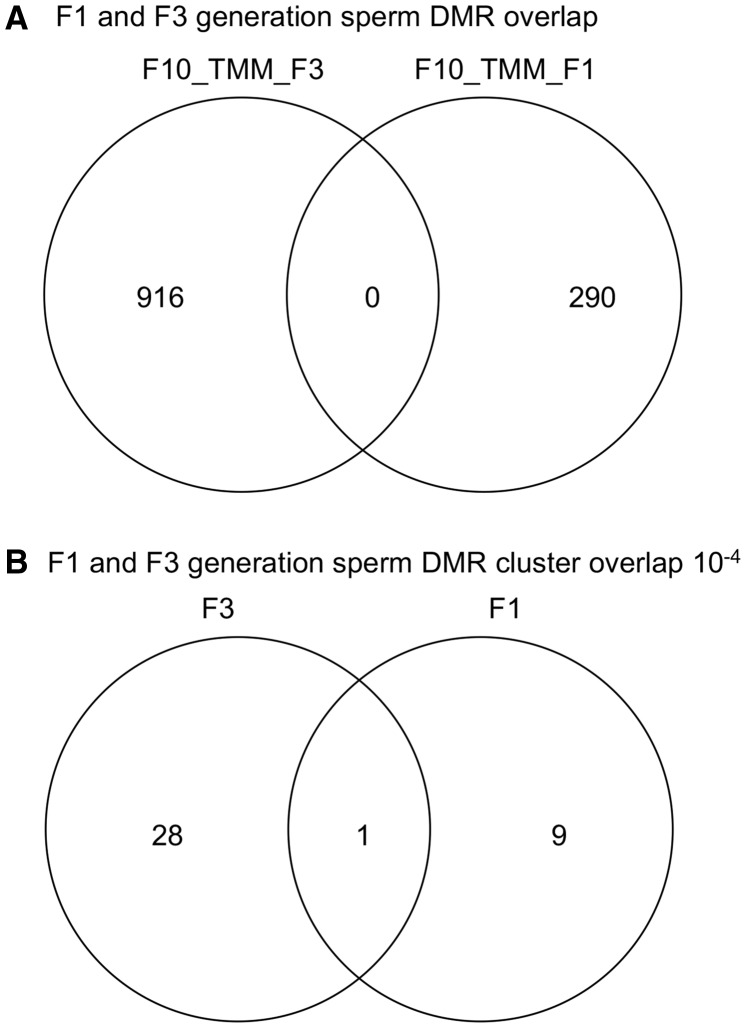
A comparison of the F1 and F3 generation sperm DMRs was made to see the degree of overlap versus generation specific DMR (Fig. 5A). None of the 290 DMR in the F1 generation (P < 10−4) overlapped with any of the 916 DMR in the F3 generation (P < 10−4). An extension of this analysis that included 10 kb flanking regions did not alter the lack of overlap observed. Therefore, the DMR were distinct between the F1 and F3 generations. Similarly, an overlap of the F1 and F3 generation DMR clusters demonstrated one overlap with the majority being distinct between the generations (Fig. 5B). Observations demonstrate the sperm DMRs are for the most part distinct between the direct exposure F1 generation sperm versus the transgenerational F3 generation sperm.
Figure 5:
DMR overlap analysis. (A) F1 and F3 generation sperm DMR overlap. (B) F1 and F3 generation sperm DMR cluster overlap
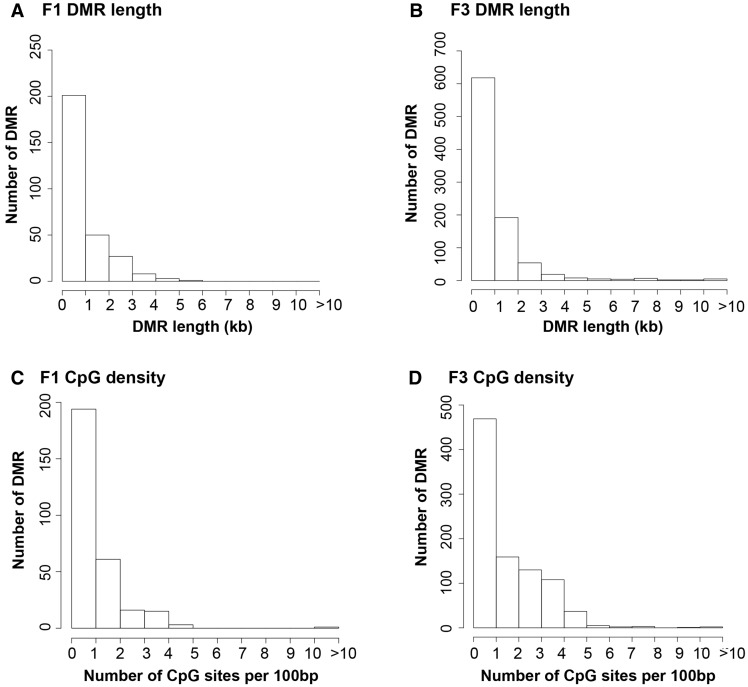
The genomic features of the DMR for both the F1 and F3 generation sperm were investigated. The DMR length was approximately a kilobase in size with few over 5 kb in size for either the F1 or F3 generation sperm DMR (Fig. 6A and B). The CpG density was found to be predominantly 1 CpG/100 bp with few above 4 CpG per 100 bp for both the F1 and F3 generation sperm DMR (Fig. 6C and D). Therefore, the environmentally modified DMR exist in CpG deserts as previously described [37]. Similar genomic features are identified between the F1 and F3 generation sperm, independent of their distinct chromosomal locations.
Figure 6:
CpG density and DMR length. (A) F1 generation DMR length; (B) F3 generation DMR length; (C) F1 generation CpG density; and (D) F3 generation CpG density. The DMR length in kilobase (kb) is shown versus the number of DMR. The number of CpG per 100 basepair (bp) versus number of DMR are presented
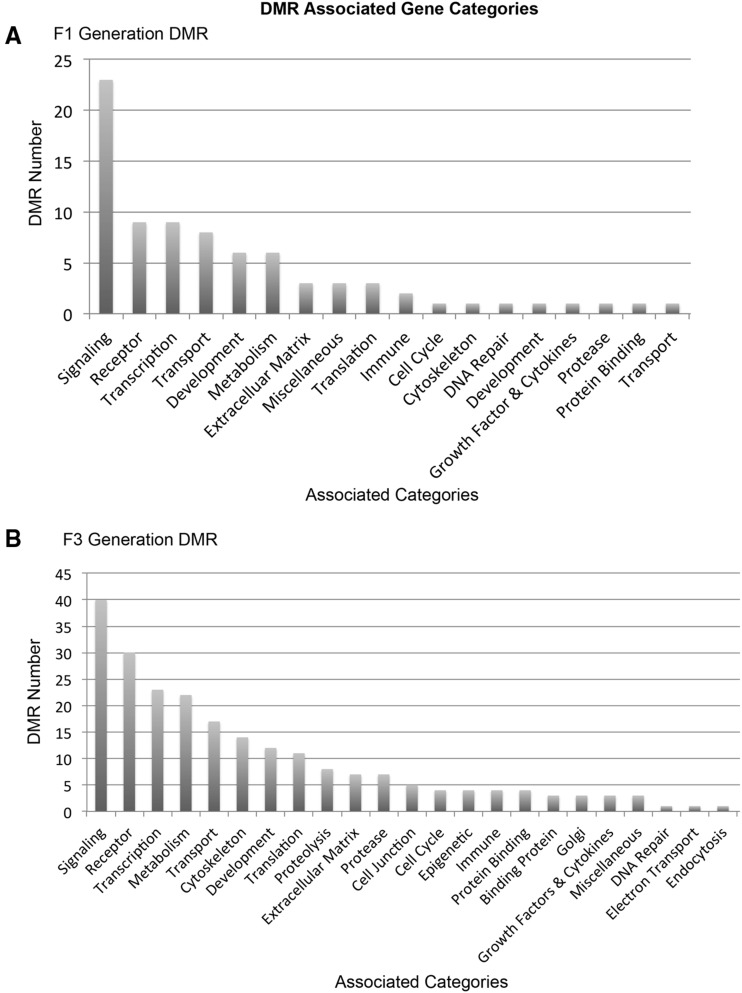
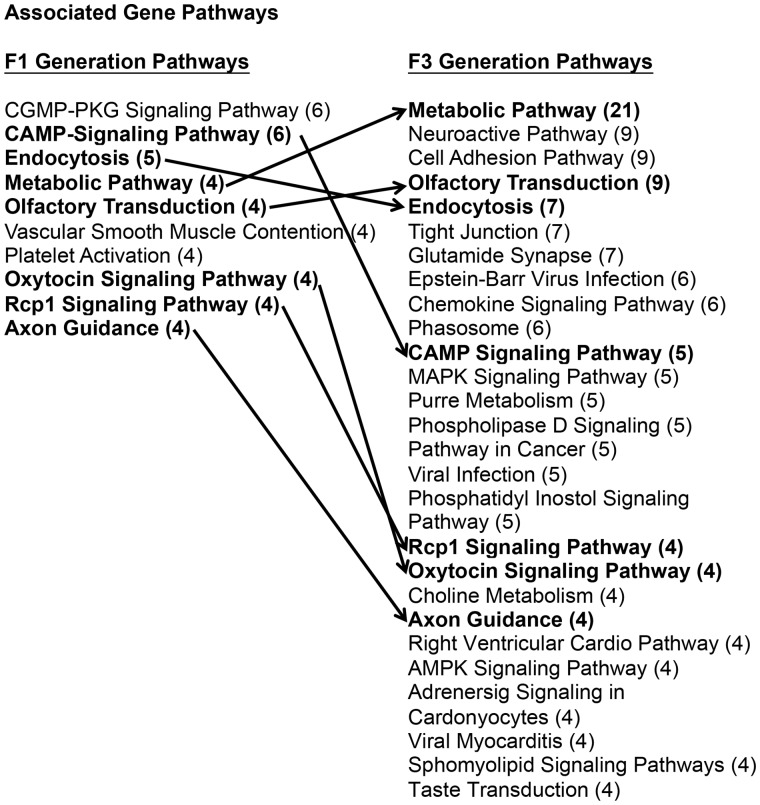
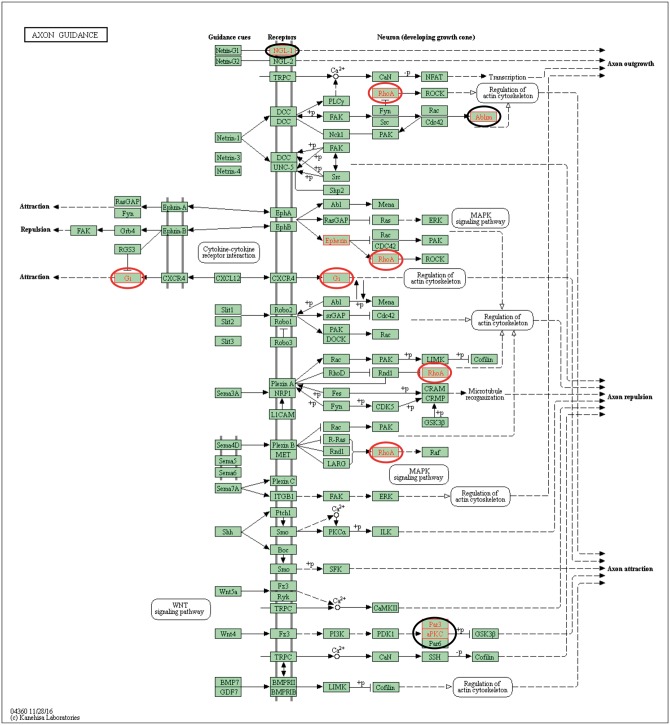
The DMR associated genes were identified to determine potential overlap with specific genes or associated pathways. The gene associations were identified with DMR when they were within 10 kb of a specific gene. Those genes associated with specific DMR are identified in Supplementary Tables S1 and S2. The gene classification category for the DMR associated genes is presented in Fig. 7. The predominant gene classification categories for both the F1 and F3 generation sperm DMR were signaling, receptor and transcription. The relative ratios for each are shown in Fig. 7. Therefore, there is similarity of gene classification categories between the F1 and F3 generation sperm DMRs. Cellular and signal transduction pathways were analyzed using KEGG pathways as described in the Methods. A list of the predominant pathways and number of associated DMR genes is presented in Fig. 8. The metabolism, cAMP-signaling pathway (Supplementary Fig. S3), endocytosis (Supplementary Fig. S4), olfactory transduction (Supplementary Fig. S5), oxytocin pathway (Supplementary Fig. S6), and axon guidance (Fig. 9; random representative selected), pathways were in common between the F1 and F3 generation sperm DMR. Therefore, the DMR associated genes were distinct between the F1 and F3 generation sperm DMR, but some common pathways were identified.
Figure 7:
DMR associated gene categories. (A) The F1 generation DMR number versus specific gene classifications (categories). (B) The F3 generation DMR number versus specific gene categories
Figure 8:
DMR associated gene pathways. The F1 generation and F3 generation sperm DMR associated gene pathways with number of genes involved in brackets (#) and bolded pathways with arrow showing common pathways
Figure 9:
Axon guidance gene pathway. The F1 generation sperm DMR associated genes indicated with red circle and F3 generation sperm DMR associated genes indicated with black circle
Bioinformatics Optimization
The data presented used the default parameters in the MEDIPS R analysis [38]. Negligible information exists on how differences in parameter combinations affect the overall MEDIPS R analysis results. In order to help determine an appropriate parameter set, two aspects of the analysis, genomic window filtering and type of normalization, were varied over a limited range of values. The analysis was performed with three different levels of genomic window filtering. Genomic windows with fewer than a chosen number of reads summed across all samples were removed from the analysis prior to the differential coverage calculations. This affects the parameterization of the edgeR model. Three different minimum filtration read thresholds were used, min = 1, min = 10 (default), and min = 40. The min = 10 is the default threshold used in the edge R model analysis. All other analysis options were held constant, using the default normalization method TMM (Trimmed Mean of M-values) [39]. Observations indicate substantial differences in the DMR identified between min = 10 with the min = 1 versus min = 40 for the F1 and F3 generation filtration. This also involves shifts in the percentage increases versus decreases in DNA methylation in the DMR and patterns of changes observed (data not shown). The min = 40 is suggested for future analysis due to a decrease in potential false positive DMR.
Normalization is used to remove unwanted noise from the dataset. Ideally, normalization minimizes all technical variation between samples, for example, correcting for library size (total read numbers) variation. There are several normalization approaches that can be used for MeDIP-Seq data. We compare the default TMM normalization (control for library size) with two variations of Remove Unwanted Variation (RUV) normalization [40]. RUV normalization takes advantage of regions of the genome that are known to be constant across treatment groups. A key step in the RUV process is to identify these regions. While spike-in controls would be ideal, here we test two different techniques for identifying the control regions. First, since methylation occurs primarily at CpG sites, regions of the genome without any CpG sites should have constant (zero) methylation between samples. The first RUV normalization variation uses regions of the genome with no CpG within 1 kb as the control sites (min = 10 − RUV CpG). The second variation uses genomic windows that had an edgeR P-value ≥ 0.8 (no significant DMR) in a preliminary analysis with minimal genomic window filtering and only TMM normalization (min 10 RUVpv). Observations indicate the RUV CpG for both F1 and F3 generation also show shifts in the DMR increase or decrease in methylation (data not shown). The normalization for library size (total read numbers) is suggested for future analysis.
The DMR number is similar regardless of the filtering level used. The number of DMR at a given edgeR P-value threshold is similar in both F1 and F3 generation datasets. The DMR also have a similar CpG density of one or two CpG/100 bp and a length of 1 kb (data not shown). However, these DMR are not completely identical. Supplementary Figure S7 shows the overlap between these DMR. The majority of DMR is unique to a single analysis or is shared by two of the three analyses (Supplementary Fig. S7A and B).
The different normalization approaches result in dramatically different numbers of DMR (Supplementary Fig. S7). Using an edgeR P-value threshold of ≤10−4, the analysis using RUV-CpG (CpG negative group) normalization results in mostly unique DMR, while the TMM normalization analysis DMR are largely a subset of the RUV-pv normalization analysis DMR (Supplementary Fig. S7C). This pattern is the same in both F1 and F3 generations, although the overlap between DMR for the RUV-pv and RUV-CpG analyses is higher in the F1 results (Supplementary Fig. S7). These patterns are generally maintained when the P values are adjusted with false discovery rates. Observations indicate the normalization dramatically varies the edgeR analysis and DMR data sets, which is further discussed in the ‘Discussion’ section.
A further analysis compared the negative-binomial approach of the edgeR based MEDIPS analysis with the non-parametric approach of SAM (significance analysis of microarrays) implemented in the SAMseq R function [41]. The SAMseq analysis provided similar DMR numbers as the edgeR analysis (data not shown). Therefore, these results do not show an obvious advantage for either the parametric approach of edgeR or the non-parametric approach.
A final analysis investigated the variation in the DMR data analysis using a permutation analysis and pairwise comparison analysis with individual pool comparisons. The permutation analysis (sub-sampled data set comparisons) does not address the validity of the individual DMR, but tests for an increase in DMR. The permutation analysis did not identify an increased number of DMR. The use of only three pools for comparison appears to be a limitation with a permutation analysis [42, 43]. Therefore, the future optimal experimental design suggested is to analyze individual animals sperm samples with independent sequencing libraries to obtain more significance in the DMR identified and reduce the variation in the analysis. The second analysis involved a pairwise comparison using individual pool comparisons to determine if variation in the data may impact DMR detection. The F3 generation had minimal random DMR identified that were in common between the comparisons showing low variation, however, in the F1 generation we did identify variation that resulted in DMR being identified. Therefore, the F1 generation does have increased epigenetic variation that can impact the DMR detected in comparison to the decreased variation observed in the F3 generation DMR analysis. This analysis also suggests that individual animal analysis will be more efficient at DMR identification than a limited number of pooled analyses.
Discussion
Previously, the identification of vinclozolin induced transgenerational sperm DMRs used a promoter MeDIP-Chip analysis and identified approximately 50 DMRs in the F3 generation sperm [10]. Subsequently, a genome wide MeDIP-Chip analysis was performed and approximately 200 DMRs were identified [11]. In the current study, the vinclozolin induced transgenerational sperm DMRs used an MeDIP-Seq analysis and compared the F3 generation DMRs with the F1 generation DMRs. Therefore, the current study used a more advanced technology with optimized bioinformatics. Interestingly, the number of DMR in the F1 generation vinclozolin lineage was less than the F3 generation. A total of 290 DMRs were identified in the F1 generation sperm and 981 identified in the F3 generation sperm. The overlap between these DMR sets identified no DMR common to both the F1 and F3 generation sperm. In considering larger chromosomal regions involving statistically over-represented clusters of DMR, there was only one overlapping cluster between the F1 and F3 generation DMR sets (Fig. 3). Therefore, the F1 generation and F3 generation sperm DMR sets are distinct.
The fetal exposure of the germline of the F1 generation involved a direct exposure toxicity to vinclozolin. The exposure period involved primordial germ cell (PGC) development and early onset of testis development. This period corresponds to the demethylation of the PGCs and initiation of DNA methylation in the prospermatogonia stage of the male germline [44–46]. Therefore, the direct exposure altered the normal epigenetic programming and generated different DNA methylation regions and ncRNA distinct from the control population [47, 48]. In contrast, the F3 generation vinclozolin lineage did not have any direct exposure and involved a transgenerationally altered DNA methylation programming in the fetal male germline. The presumption is that it is this epigenetic programming modification that will generate a similar set of DMR as seen in the F3 generation to subsequent generations, but this remains to be established. Therefore, considering this difference in direct exposure versus transgenerational epigenetic programming it is not surprising that the sperm epimutations in the F1 and F3 generation sperm are distinct. The simplistic concept that a DMR is directly induced, such as an imprinted-like gene site, that is then maintained generationally appears not to be the case. Instead the altered transgenerational developmental programming mechanisms appear to promote the transgenerational DMR.
The majority of the DMRs in either the F1 or F3 generation sperm were found to not be associated with promoters but instead be intergenic and distal to known genes. Previous studies have demonstrated the presence of statistically significant over-represented clusters of genes around DMR [49]. The existence of ‘epigenetic control regions’ or ECR was previously reported associated with transgenerational DMRs [49, 50]. These ECR are generally 2–5 Mb in size and have multiple genes that can be regulated by DMRs within the ECR that likely influence ncRNA that regulate distal gene expression [50]. Therefore, the alteration of the epigenome at a limited number of DMRs can have a dramatic effect on gene expression. In contrast, some DMR are identified in promoter regions and may have a more classic genetic impact on gene expression. The majority of DMR not associated with gene promoters may have a role in ECR.
The genomic features associated with the DMR in both the F1 and F3 sperm data sets were found to be similar to previously identified transgenerational sperm DMR in terms of length and CpG density [51]. The chromosomal locations of the DMR demonstrated they occurred throughout the genome. The length of the DMR was predominantly less than 1 kb, but some are larger in size and a few are over 10 kb in size. One of the most consistent genomic features is a low CpG density of approximately 1 CpG per 100 bp (Fig. 4). Most transgenerational DMR previously identified have this low density CpG and are referred to as a CpG desert [37]. In addition, DNA sequence motifs associated with the DMR have also been identified [51], but were not assessed in the current study. Therefore, the DMR are present in CpG deserts with approximately 1 kb in size throughout the genome. This was the case for both the direct exposure F1 generation sperm DMR and the transgenerational F3 generation sperm DMR.
The advanced MeDIP-Seq procedure developed is described in the Methods and Supplementary Fig. S1 with the advantage of magnetic beads and modified sequencing library construction. The bioinformatics optimization is described in the Methods and in Supplementary Fig. S2. Previously, the MeDIP-Chip analysis was used [10, 11, 26] and due to differential hybridization signal on the chip an intersection analysis was useful. Therefore, the DMR identified on each chip were compared between chips to identify the overlapping DMR set. The disadvantage of MeDIP-Chip was the limited number of oligonucleotides on the tiling arrays. The DMR identified were only those associated with oligos on the chip. In contrast, the MeDIP-Seq is not limited to a predetermined set of locations within the genome.
The limitations of the MeDIP-Seq are more associated with read depth of the DMR sites. A higher read depth generally leads to more accurate DMR identification. A more stringent read depth filtration is anticipated to improve DMR identification. The minimum read depth of 40 reads per sequence was found to perform well in the current study. Genomic window normalization also has the potential to increase the accuracy of the DMR identification. Two RUV normalizations did not improve the analysis and dramatically altered the DMR obtained. Therefore, currently the normalization for library size appears the minimum necessary analysis step. The permutation analysis demonstrated pooled analysis as performed in the current study may not be optimal to assess or reduce variation in the data. Therefore, future analyses should consider increased sample size to improve the statistics and ability to reduce variation in the data. Future analysis with alternate methods to confirm the DMR, such as bisulfite sequencing of the specific DMR, would be useful to further optimize the bioinformatics analysis. Preliminary studies with this approach suggest the alternate confirmation analysis may reduce the need to further optimize the bioinformatics. The variation in normalization provided preliminary distinct DMR sets and without follow up confirmation it is not possible to select a more accurate normalization strategy than correcting for library size (total read depth). Due to the dramatic change with the different normalization methods, the accuracy of the edgeR analysis computational tool needs to be investigated in the future. The sensitivity of the results to the normalization approach may indicate deviations of the data from the negative binomial distribution used by edgeR. In addition, the permutation analysis supports this limitation with the bioinformatics analysis. There is some evidence that parametric model approaches, such as edgeR, are not robust to bad model fit [52]. A preliminary analysis with SAMseq demonstrated similar results to the edgeR analysis. Therefore, SAMseq is a potentially useful alternative to consider [41]. Simulated MeDIP-Seq datasets may also be helpful for identifying optimal analysis parameters. While an exhaustive exploration of more analysis variations would be useful, it is beyond the scope of this paper.
Conclusion
Observations from the current study indicate that the direct fetal exposure induced F1 generation sperm DMRs are distinct from the transgenerational F3 generation sperm DMRs identified. Although the current study demonstrated a larger number of DMRs in the F3 generation sperm, other types of toxicants or exposures may vary in the number of DMRs induced following direct exposure in comparison to transgenerational DMRs. Recently we have found methyl mercury induced epigenetic transgenerational inheritance in zebrafish have higher numbers of DMR in the F1 generation sperm than F3 generation sperm [53].The more advanced technology of the MeDIP-Seq and associated bioinformatics provides a genome wide analysis. This is a significant advantage from the MeDIP-Chip analysis previously utilized.
The bioinformatics analysis suggested the negative-binomial approach of edgeR may not be optimal and a non-parametric approach like SAMseq needs to be considered in the future [52]. In addition, a permutation analysis and pairwise comparison analysis suggested epigenetic variation in the data, in particular in the F1 generation. Therefore, the sample pooling is not an optimal experimental design and increased sample size needs to be considered in the future. In addition, the permutation analysis should be used in the future to help validate the bioinformatics analysis.
The transgenerational DMR identified are not simply induced from direct exposure to the toxicant, but instead appear derived from altered transgenerational epigenetic programming during germline development. Future studies need to examine the F2 generation and subsequent generations from the F3 generation to more fully investigate this epigenetic transgenerational phenomenon.
Methods
Animal Studies and Breeding
Female and male rats of an outbred strain Hsd:Sprague Dawley SD®™ (Harlan) at about 70 and 100 days of age were fed ad lib with a standard rat diet and ad lib tap water for drinking. To obtain time-pregnant females, the female rats in proestrus were pair-mated with male rats. The sperm-positive (Day 0) rats were monitored for diestrus and body weight. On days 8 through 14 of gestation [54], the females were administered daily intraperitoneal injections of vinclozolin (100 mg/kg BW/day) or dimethyl sulfoxide (DMSO) in oil (vehicle). The vinclozolin was obtained from Chem Service Inc. (West Chester, PA) and was injected in a 20 μl DMSO/oil vehicle as previously described [26]. Treatment lineages are designated ‘control’ or ‘vinclozolin’ lineages. The gestating female rats treated were designated as the F0 generation. The offspring of the F0 generation rats were the F1 generation. Non-littermate females and males aged 70–90 days from F1 generation of control or vinclozolin lineages were bred to obtain F2 generation offspring. The F2 generation rats were bred to obtain F3 generation offspring. Individuals were maintained for 12 months and euthanized for sperm collection. The F1–F3 generation offspring were not themselves treated directly with vinclozolin. The control and vinclozolin lineages were housed in the same room and racks with lighting, food and water as previously described [26, 55, 56]. All experimental protocols for the procedures with rats were pre-approved by the Washington State University Animal Care and Use Committee (IACUC approval # 02568-39).
Epididymal Sperm Collection and DNA Isolation
The epididymis was dissected free of connective tissue, a small cut made to the cauda and tissue placed in 5 ml of F12 culture medium containing 0.1% bovine serum albumin for 10 min at 37 °C and then kept at 4 °C to immobilize the sperm. The epididymal tissue was minced and the released sperm centrifuged at 13 000 × g and the pellet stored at −20 °C until processed further. The pellet was resuspended in NIM buffer and then 100 μl of sperm suspension was combined with 820 μl DNA extraction buffer and 80 μl 0.1 M DTT. The sample was incubated at 65 °C for 15 min. Following this incubation, 80 μl proteinase K (20 mg/ml) was added and the sample incubated at 55 °C for at least 2 h under constant rotation. Then 300 μl of protein precipitation solution (Promega Genomic DNA Purification Kit, A795A) was added, the sample mixed thoroughly and incubated for 15 min on ice. The sample was centrifuged at 13 500 rpm for 20 min at 4 °C. One milliliter of the supernatant was transferred to a 2 ml tube and 2 μl of glycoblue and 1 ml of cold 100% isopropanol were added. The sample was mixed well by inverting the tube several times then left in −20 °C freezer for at least one hour. After precipitation the sample was centrifuged at 13 500 rpm for 20 min at 4 °C. The supernatant was taken off and discarded without disturbing the (blue) pellet. The pellet was washed with 70% cold ethanol by adding 500 μl of 70% ethanol to the pellet and returning the tube to the freezer for 20 min. After the incubation, the tube was centrifuged for 10 min at 4 °C at 13 500 rpm and the supernatant discarded. The tube was spun again briefly to collect residual ethanol to bottom of tube and then as much liquid as possible was removed with gel loading tip. Pellet was air-dried at RT until it looked dry (about 5 min). Pellet was then resuspended in 100 μl of nuclease free water. Equal amounts of DNA from three individual sperm samples were used to produce three DNA pools per lineage and employed for methylated DNA immunoprecipitation (MeDIP).
Methylated DNA Immunoprecipitation MeDIP
Methylated DNA Immunoprecipitation (MeDIP) with genomic DNA was performed as follows: rat sperm DNA pools were generated using 2 μg of genomic DNA from each individual for three pools each of control and vinclozolin lineage animals. Each pool contained three individuals for a total of n = 9 rats per exposure group. Genomic DNA was sonicated using the Covaris M220 the following way: 6 μg of pooled genomic DNA was diluted to 130 μl with TE into the appropriate Covaris tube. Covaris was set to 300 bp program and the program was run for each tube in the experiment. About 10 μl of each sonicated DNA was run on 1.5% agarose gel to verify fragment size. The sonicated DNA was transferred from the Covaris tube to a 1.7 ml microfuge tube and the volume measured. The sonicated DNA was then diluted with TE buffer (10 mM Tris HCl, pH7.5; 1 mM EDTA) to 400 μl, heat-denatured for 10 min at 95°C, then immediately cooled on ice for 10 min. Then 100 μl of 5× IP buffer and 5 μg of antibody (monoclonal mouse anti 5-methyl cytidine; Diagenode #C15200006) were added to the denatured sonicated DNA. The DNA-antibody mixture was incubated overnight on a rotator at 4°C.
The following day magnetic beads (Dynabeads M-280 Sheep anti-Mouse IgG; 11201 D) were pre-washed as follows: The beads were resuspended in the vial, then the appropriate volume (50 μl per sample) was transferred to a microfuge tube. The same volume of Washing Buffer (at least 1 ml) was added and the bead sample was resuspended. Tube was then placed into a magnetic rack for 1–2 min and the supernatant discarded. The tube was removed from the magnetic rack and the beads washed once. The washed beads were resuspended in the same volume of 1×IP buffer as the initial volume of beads. About 50 μl of beads were added to the 500 μl of DNA-antibody mixture from the overnight incubation, then incubated for 2 h on a rotator at 4×˚C.
After the incubation the bead–antibody–DNA complex was washed three times with 1× IP buffer as follows: The tube was placed into magnetic rack for 1–2 min and the supernatant discarded, then washed with 1× IP buffer three times. The washed bead-DNA solution is then resuspended in 250 μl digestion buffer with 3.5 μl Proteinase K (20 mg/ml). The sample was then incubated for 2–3 h on a rotator at 55°C and then 250 μl of buffered Phenol–Chloroform–Isoamylalcohol solution was added to the supernatant and the tube vortexed for 30 s then centrifuged at 14 000 rpm for 5 min at room temperature. The aqueous supernatant was carefully removed and transferred to a fresh microfuge tube. Then 250 μl of chloroform were added to the supernatant from the previous step, vortexed for 30 s and centrifuged at 14 000 rpm for 5 min at room temperature. The aqueous supernatant was removed and transferred to a fresh microfuge tube. To the supernatant, 2 μl of glycoblue (20 mg/ml), 20 μl of 5 M NaCl, and 500 μl ethanol were added and mixed well, then precipitated in −20°C freezer for 1 h to overnight.
The precipitate was centrifuged at 14 000 rpm for 20 min at 4°C and the supernatant removed, while not disturbing the pellet. The pellet was washed with 500 μl cold 70% ethanol in −20°C freezer for 15 min then centrifuged again at 14 000 rpm for 5 min at 4°C and the supernatant discarded. The tube was spun again briefly to collect residual ethanol to bottom of tube and as much liquid as possible was removed with gel loading tip. Pellet was air-dried at RT until it looked dry (about 5 min) then resuspended in 20 μl H2O or TE. DNA concentration was measured in Qubit (Life Technologies) with ssDNA kit (Molecular Probes Q10212).
MeDIP-Seq Analysis
The MeDIP pools were used to create libraries for NGS using the NEBNext® Ultra™ RNA Library Prep Kit for Illumina® (NEB, San Diego, CA) starting at step 1.4 of the manufacturer’s protocol to generate double stranded DNA. After this step the manufacturer’s protocol was followed. Each pool received a separate index primer. NGS was performed at WSU Spokane Genomics Core using the Illumina HiSeq 2500 with a PE50 application, with a read size of approximately 50 bp and approximately 35 million reads per pool. Six libraries were run in one lane.
Statistics and Bioinformatics
The basic read quality was verified using summaries produced by the FastQC program http://www.bioinformatics.babraham.ac.uk/projects/fastqc/ (8 February 2017, date last accessed). The reads for each MeDIP sample were mapped to the Rnor 6.0 rat genome using Bowtie2 [57] with default parameter options. The mapped read files were then converted to sorted BAM files using SAMtools [58]. To identify DMRs, the reference genome was broken into 100 bp windows. The RUVseq R package was used for RUV normalization [40]. The MEDIPS R package [38] was used to calculate differential coverage between control and exposure sample groups. The edgeR P-value [59] was used to determine the relative difference between the two groups for each genomic window. Windows with an edgeR P-value < 10−4 were considered DMRs. For the SAM analysis, DMR were identified using the SAMseq function in the samr R package [52]. P values for individual genomic windows were extracted using the samr P values from perms function. The DMR edges were extended until no genomic window with a P-value < 0.1 remained within 1000 bp of the DMR. CpG density and other information were then calculated for the DMR based on the reference genome.
DMRs were annotated using the biomaRt R package [60] to access the Ensembl database [61]. The genes that overlapped with DMR were then input into the KEGG pathway search [62, 63] to identify associated pathways. The DMR associated genes were manually then sorted into functional groups by consulting information provided by the DAVID [64], Panther [65], and Uniprot databases incorporated into an internal curated database (www.skinner.wsu.edu under genomic data, 8 February 2017, date last accessed). All molecular data has been deposited into the public database at NCBI (GEO # GSE96850). The specific scripts used to perform the analysis can be accessed at github.com/skinnerlab and at www.skinner.wsu.edu/genomic-data-and-r-code-files (8 February 2017, date last accessed).
Supplementary Material
Acknowledgements
We acknowledge Dr Eric Nilsson for critical review of the manuscript and Ms Heather Johnson for assistance in preparation of the manuscript. This study was supported by NIH grant to M.K.S.
Supplementary Data
Supplementary data are available at EnvEpig online.
Conflict of interest statement. None declared.
References
- 1. Anway MD, Cupp AS, Uzumcu M, Skinner MK.. Epigenetic transgenerational actions of endocrine disruptors and male fertility. Science 2005; 308:1466–9. [DOI] [PMC free article] [PubMed] [Google Scholar]
- 2. Kelce WR, Wilson EM.. Environmental antiandrogens: developmental effects, molecular mechanisms, and clinical implications. J Mol Med 1997; 75:198–207. [DOI] [PubMed] [Google Scholar]
- 3. McCarrey JR, Lehle JD, Raju SS, Wang Y, Nilsson EE, Skinner MK.. Tertiary epimutations—a novel aspect of epigenetic transgenerational inheritance promoting genome instability. PLoS One 2016; 11:e0168038.. [DOI] [PMC free article] [PubMed] [Google Scholar]
- 4. Taguchi YH. Identification of aberrant gene expression associated with aberrant promoter methylation in primordial germ cells between E13 and E16 rat F3 generation vinclozolin lineage. BMC Bioinformatics 2015; 16Suppl 18:S16.. [DOI] [PMC free article] [PubMed] [Google Scholar]
- 5. Gillette R, Miller-Crews I, Nilsson EE, Skinner MK, Gore AC, Crews D.. Sexually dimorphic effects of ancestral exposure to vinclozolin on stress reactivity in rats. Endocrinology 2014; 155:3853–66. [DOI] [PMC free article] [PubMed] [Google Scholar]
- 6. Paoloni-Giacobino A. Epigenetic effects of methoxychlor and vinclozolin on male gametes. Vitam Horm 2014; 94:211–27. [DOI] [PubMed] [Google Scholar]
- 7. Guerrero-Bosagna C, Covert T, Haque MM, Settles M, Nilsson EE, Anway MD, Skinner MK.. Epigenetic transgenerational inheritance of vinclozolin induced mouse adult onset disease and associated sperm epigenome biomarkers. Reprod Toxicol 2012; 34:694–707. [DOI] [PMC free article] [PubMed] [Google Scholar]
- 8. Skinner MK. Endocrine disruptor induction of epigenetic transgenerational inheritance of disease. Mol Cell Endocrinol 2014; 398:4–12. [DOI] [PMC free article] [PubMed] [Google Scholar]
- 9. Jirtle RL, Skinner MK.. Environmental epigenomics and disease susceptibility. Nat Rev Genet 2007; 8:253–62. [DOI] [PMC free article] [PubMed] [Google Scholar]
- 10. Guerrero-Bosagna C, Settles M, Lucker B, Skinner M.. Epigenetic transgenerational actions of vinclozolin on promoter regions of the sperm epigenome. Plos One 2010; 5:e13100.. [DOI] [PMC free article] [PubMed] [Google Scholar]
- 11. Skinner MK, Guerrero-Bosagna C, Haque MM.. Environmentally induced epigenetic transgenerational inheritance of sperm epimutations promote genetic mutations. Epigenetics 2015; 10:762–71. [DOI] [PMC free article] [PubMed] [Google Scholar]
- 12. Schuster A, Skinner MK, Yan W.. Ancestral vinclozolin exposure alters the epigenetic transgenerational inheritance of sperm small noncoding RNAs. Environ Epigenet 2016; 2:pii: dvw001. [DOI] [PMC free article] [PubMed] [Google Scholar]
- 13. Gapp K, Jawaid A, Sarkies P, Bohacek J, Pelczar P, Prados J, Farinelli L, Miska E, Mansuy IM.. Implication of sperm RNAs in transgenerational inheritance of the effects of early trauma in mice. Nat Neurosci 2014; 17:667–9. [DOI] [PMC free article] [PubMed] [Google Scholar]
- 14. Erkek S, Hisano M, Liang CY, Gill M, Murr R, Dieker J, Schubeler D, Vlag JV, Stadler MB, Peters AH.. Molecular determinants of nucleosome retention at CpG-rich sequences in mouse spermatozoa. Nat Struct Mol Biol 2013; 20:868–75. [DOI] [PubMed] [Google Scholar]
- 15. Puri D, Dhawan J, Mishra RK.. The paternal hidden agenda: epigenetic inheritance through sperm chromatin. Epigenetics 2010; 5:386–91. [DOI] [PubMed] [Google Scholar]
- 16. Hanson MA, Skinner MK.. Developmental origins of epigenetic transgenerational inheritance. Environ Epigenet 2016; 2:dvw002.. [DOI] [PMC free article] [PubMed] [Google Scholar]
- 17. Skinner MK. Endocrine disruptors in 2015: epigenetic transgenerational inheritance. Nat Rev Endocrinol 2016; 12:68–70. [DOI] [PMC free article] [PubMed] [Google Scholar]
- 18. Schwindt AR. Parental effects of endocrine disrupting compounds in aquatic wildlife: is there evidence of transgenerational inheritance? Gen Comp Endocrinol 2015; 219:152–64. [DOI] [PubMed] [Google Scholar]
- 19. Rissman EF, Adli M.. Minireview: transgenerational epigenetic inheritance: focus on endocrine disrupting compounds. Endocrinology 2014; 155:2770–80. [DOI] [PMC free article] [PubMed] [Google Scholar]
- 20. Manikkam M, Tracey R, Guerrero-Bosagna C, Skinner M.. Plastics derived endocrine disruptors (BPA, DEHP and DBP) induce epigenetic transgenerational inheritance of adult-onset disease and sperm epimutations. PLoS One 2013; 8:e55387.. [DOI] [PMC free article] [PubMed] [Google Scholar]
- 21. Tracey R, Manikkam M, Guerrero-Bosagna C, Skinner M.. Hydrocarbons (jet fuel JP-8) induce epigenetic transgenerational inheritance of obesity, reproductive disease and sperm epimutations. Reprod Toxicol 2013; 36:104–16. [DOI] [PMC free article] [PubMed] [Google Scholar]
- 22. Bruner-Tran Kl, Osteen Kg.. Developmental exposure to TCDD reduces fertility and negatively affects pregnancy outcomes across multiple generations. Reprod Toxicol 2011; 31:344–50. [DOI] [PMC free article] [PubMed] [Google Scholar]
- 23. Manikkam M, Tracey R, Guerrero-Bosagna C, Skinner MK.. Dioxin (TCDD) induces epigenetic transgenerational inheritance of adult onset disease and sperm epimutations. PLoS One 2012; 7:e46249.. [DOI] [PMC free article] [PubMed] [Google Scholar]
- 24. Stouder C, Paoloni-Giacobino A.. Transgenerational effects of the endocrine disruptor vinclozolin on the methylation pattern of imprinted genes in the mouse sperm. Reproduction 2010; 139:373–9. [DOI] [PubMed] [Google Scholar]
- 25. Manikkam M, Tracey R, Guerrero-Bosagna C, Skinner M.. Pesticide and insect repellent mixture (permethrin and DEET) induces epigenetic transgenerational inheritance of disease and sperm epimutations. Reprod Toxicol 2012; 34:708–19. [DOI] [PMC free article] [PubMed] [Google Scholar]
- 26. Manikkam M, Guerrero-Bosagna C, Tracey R, Haque MM, Skinner MK.. Transgenerational actions of environmental compounds on reproductive disease and identification of epigenetic biomarkers of ancestral exposures. PLoS ONE 2012; 7:e31901.. [DOI] [PMC free article] [PubMed] [Google Scholar]
- 27. Skinner MK, Manikkam M, Tracey R, Nilsson E, Haque MM, Guerrero-Bosagna C.. Ancestral dichlorodiphenyltrichloroethane (DDT) exposure promotes epigenetic transgenerational inheritance of obesity. BMC Med 2013; 11:228.. [DOI] [PMC free article] [PubMed] [Google Scholar]
- 28. Manikkam M, Haque MM, Guerrero-Bosagna C, Nilsson E, Skinner MK.. Pesticide methoxychlor promotes the epigenetic transgenerational inheritance of adult onset disease through the female germline. PLoS One 2014; 9:e102091.. [DOI] [PMC free article] [PubMed] [Google Scholar]
- 29. Chamorro-Garcia R, Sahu M, Abbey RJ, Laude J, Pham N, Blumberg B.. Transgenerational inheritance of increased fat depot size, stem cell reprogramming, and hepatic steatosis elicited by prenatal exposure to the obesogen tributyltin in mice. Environ Health Perspect 2013; 121:359–66. [DOI] [PMC free article] [PubMed] [Google Scholar]
- 30. Hauser MT, Aufsatz W, Jonak C, Luschnig C.. Transgenerational epigenetic inheritance in plants. Biochim Biophys Acta 2011; 1809:459–68. [DOI] [PMC free article] [PubMed] [Google Scholar]
- 31. Ruden DM, Lu X.. Hsp90 affecting chromatin remodeling might explain transgenerational epigenetic inheritance in Drosophila. Curr Genomics 2008; 9:500–8. [DOI] [PMC free article] [PubMed] [Google Scholar]
- 32. Greer EL, Maures TJ, Ucar D, Hauswirth AG, Mancini E, Lim JP, Benayoun BA, Shi Y, Brunet A.. Transgenerational epigenetic inheritance of longevity in Caenorhabditis elegans. Nature 2011; 479:365–71. [DOI] [PMC free article] [PubMed] [Google Scholar]
- 33. Pembrey ME. Male-line transgenerational responses in humans. Hum Fertil (Camb) 2010; 13:268–71. [DOI] [PubMed] [Google Scholar]
- 34. Nilsson EE, Skinner MK.. Environmentally induced epigenetic transgenerational inheritance of reproductive disease. Biol Reprod 2015; 93:145.. [DOI] [PMC free article] [PubMed] [Google Scholar]
- 35. Skinner MK. What is an epigenetic transgenerational phenotype? F3 or F2. Reprod Toxicol 2008; 25:2–6. [DOI] [PMC free article] [PubMed] [Google Scholar]
- 36. Hammoud SS, Cairns BR, Carrell DT.. Analysis of gene-specific and genome-wide sperm DNA methylation. Methods Mol Biol 2013; 927:451–8. [DOI] [PubMed] [Google Scholar]
- 37. Skinner MK, Guerrero-Bosagna C.. Role of CpG deserts in the epigenetic transgenerational inheritance of differential DNA methylation regions. BMC Genomics 2014; 15:692.. [DOI] [PMC free article] [PubMed] [Google Scholar]
- 38. Lienhard M, Grimm C, Morkel M, Herwig R, Chavez L.. MEDIPS: genome-wide differential coverage analysis of sequencing data derived from DNA enrichment experiments. Bioinformatics 2014; 30:284–6. [DOI] [PMC free article] [PubMed] [Google Scholar]
- 39. Robinson MD, Oshlack A.. A scaling normalization method for differential expression analysis of RNA-seq data. Genome Biol 2010; 11:R25. [DOI] [PMC free article] [PubMed] [Google Scholar]
- 40. Risso D, Ngai J, Speed TP, Dudoit S.. Normalization of RNA-seq data using factor analysis of control genes or samples. Nat Biotechnol 2014; 32:896–902. [DOI] [PMC free article] [PubMed] [Google Scholar]
- 41. Larsson O, Wahlestedt C, Timmons JA.. Considerations when using the significance analysis of microarrays (SAM) algorithm. BMC Bioinformatics 2005; 6:129.. [DOI] [PMC free article] [PubMed] [Google Scholar]
- 42. Johnson GC, Koeleman BP, Todd JA.. Limitations of stratifying sib-pair data in common disease linkage studies: an example using chromosome 10p14-10q11 in type 1 diabetes. Am J Med Genet 2002; 113:158–66. [DOI] [PubMed] [Google Scholar]
- 43. Buzkova P, Lumley T, Rice K.. Permutation and parametric bootstrap tests for gene-gene and gene-environment interactions. Ann Hum Genet 2011; 75:36–45. [DOI] [PMC free article] [PubMed] [Google Scholar]
- 44. Magnusdottir E, Gillich A, Grabole N, Surani MA.. Combinatorial control of cell fate and reprogramming in the mammalian germline. Curr Opin Genet Dev 2012; 22:466–74. [DOI] [PubMed] [Google Scholar]
- 45. Seisenberger S, Peat JR, Reik W.. Conceptual links between DNA methylation reprogramming in the early embryo and primordial germ cells. Curr Opin Cell Biol 2013; 25:281–8. [DOI] [PubMed] [Google Scholar]
- 46. Matsui Y, Mochizuki K.. A current view of the epigenome in mouse primordial germ cells. Mol Reprod Dev 2014; 81:160–70. [DOI] [PubMed] [Google Scholar]
- 47. Skinner M, Guerrero-Bosagna C, Haque MM, Nilsson E, Bhandari R, McCarrey J.. Environmentally induced transgenerational epigenetic reprogramming of primordial germ cells and subsequent germline. PLoS One 2013; 8:e66318.. [DOI] [PMC free article] [PubMed] [Google Scholar]
- 48. Brieno-Enriquez MA, Garcia-Lopez J, Cardenas DB, Guibert S, Cleroux E, Ded L, Hourcade Jde D, Peknicova J, Weber M, Del Mazo J.. Exposure to endocrine disruptor induces transgenerational epigenetic deregulation of microRNAs in primordial germ cells. PLoS One 2015; 10:e0124296.. [DOI] [PMC free article] [PubMed] [Google Scholar]
- 49. Haque MM, Nilsson EE, Holder LB, Skinner MK.. Genomic clustering of differential DNA methylated regions (epimutations) associated with the epigenetic transgenerational inheritance of disease and phenotypic variation. BMC Genomics 2016; 17:418.. [DOI] [PMC free article] [PubMed] [Google Scholar]
- 50. Skinner MK, Manikkam M, Haque MM, Zhang B, Savenkova M.. Epigenetic transgenerational inheritance of somatic transcriptomes and epigenetic control regions. Genome Biol 2012; 13:R91.. [DOI] [PMC free article] [PubMed] [Google Scholar]
- 51. Guerrero-Bosagna C, Weeks S, Skinner MK.. Identification of genomic features in environmentally induced epigenetic transgenerational inherited sperm epimutations. PLoS One 2014; 9:e100194.. [DOI] [PMC free article] [PubMed] [Google Scholar]
- 52. Li J, Tibshirani R.. Finding consistent patterns: a nonparametric approach for identifying differential expression in RNA-Seq data. Stat Methods Med Res 2013; 22:519–36. [DOI] [PMC free article] [PubMed] [Google Scholar]
- 53. Carvan MJI, Kalluvila TA, Klingler RH, Larson JK, Pickens M, Mora-Zamorano FX, Connaughton VP, Sadler-Riggleman I, Beck D, Skinner MK.. Mercury-induced epigenetic transgenerational inheritance of abnormal neurobehavior is correlated with sperm epimutations in zebrafish. PLoS One 2017; 12:e0176155.. [DOI] [PMC free article] [PubMed] [Google Scholar]
- 54. Nilsson EE, Anway MD, Stanfield J, Skinner MK.. Transgenerational epigenetic effects of the endocrine disruptor vinclozolin on pregnancies and female adult onset disease. Reproduction 2008; 135:713–21. [DOI] [PMC free article] [PubMed] [Google Scholar]
- 55. Skinner MK, Manikkam M, Guerrero-Bosagna C.. Epigenetic transgenerational actions of environmental factors in disease etiology. Trends Endocrinol Metab 2010; 21:214–22. [DOI] [PMC free article] [PubMed] [Google Scholar]
- 56. Anway MD, Leathers C, Skinner MK.. Endocrine disruptor vinclozolin induced epigenetic transgenerational adult-onset disease. Endocrinology 2006; 147:5515–23. [DOI] [PMC free article] [PubMed] [Google Scholar]
- 57. Langmead B, Salzberg SL.. Fast gapped-read alignment with Bowtie 2. Nat Meth 2012; 9:357–9. [DOI] [PMC free article] [PubMed] [Google Scholar]
- 58. Li H, Handsaker B, Wysoker A, Fennell T, Ruan J, Homer N, Marth G, Abecasis G, Durbin R. Genome Project Data Processing Subgroup. The Sequence Alignment/Map format and SAMtools. Bioinformatics 2009; 25:2078–9. [DOI] [PMC free article] [PubMed] [Google Scholar]
- 59. Robinson MD, McCarthy DJ, Smyth GK.. edgeR: a Bioconductor package for differential expression analysis of digital gene expression data. Bioinformatics 2010; 26:139–40. [DOI] [PMC free article] [PubMed] [Google Scholar]
- 60. Durinck S, Spellman PT, Birney E, Huber W.. Mapping identifiers for the integration of genomic datasets with the R/Bioconductor package biomaRt. Nat Protoc 2009; 4:1184–91. [DOI] [PMC free article] [PubMed] [Google Scholar]
- 61. Cunningham F, Amode MR, Barrell D, Beal K, Billis K, Brent S, Carvalho-Silva D, Clapham P, Coates G, Fitzgerald S, et al. Ensembl 2015. Nucleic Acids Res 2015; 43:D662–9. [DOI] [PMC free article] [PubMed] [Google Scholar]
- 62. Kanehisa M, Goto S.. KEGG: kyoto encyclopedia of genes and genomes. Nucleic Acids Res 2000; 28:27–30. [DOI] [PMC free article] [PubMed] [Google Scholar]
- 63. Kanehisa M, Goto S, Sato Y, Kawashima M, Furumichi M, Tanabe M.. Data, information, knowledge and principle: back to metabolism in KEGG. Nucleic Acids Res 2014; 42:D199–205. [DOI] [PMC free article] [PubMed] [Google Scholar]
- 64. Huang da W, Sherman BT, Lempicki RA.. Systematic and integrative analysis of large gene lists using DAVID bioinformatics resources. Nat Protoc 2009 ; 4:44–57. [DOI] [PubMed] [Google Scholar]
- 65. Mi H, Muruganujan A, Casagrande JT, Thomas PD.. Large-scale gene function analysis with the PANTHER classification system. Nat Protoc 2013; 8:1551–66. [DOI] [PMC free article] [PubMed] [Google Scholar]
Associated Data
This section collects any data citations, data availability statements, or supplementary materials included in this article.


