

Abstract
Thalidomide, which inhibits angiogenesis in certain tumor types, reduced extravasation of a macromolecular contrast medium (MMCM) in a human breast cancer model as assayed by MMCM-enhanced dynamic magnetic resonance imaging (MRI) and fluorescence microscopy in the same tumors. After a 1-week, three-dose course of thalidomide, the mean MRI-assayed endothelial transfer coefficient, KPS, decreased significantly (p<0.05) from 19.4±9.1 to 6.3±9.1 μl/min·100 cm3. Correspondingly, microscopic measurements of extravasated MMCM, expressed as fractional area of streptavidin staining, were significantly (p<0.05) lower in thalidomide-treated tumors (18.6±11.9%) than in control saline-treated tumors (50.2±2.3%). On a tumor-by-tumor basis, post-treatment KPS values correlated significantly (r2=0.55, p<0.05) with microscopic measures of MMCM extravasation. However, no significant differences were observed between saline- and thalidomide-treated tumors with respect to rate of growth, vascular richness, or amount of VEGF-containing cells. Because of its sensitivity to the detection of changes in vascular leakage in tumors, this MMCM-enhanced MRI assay could prove useful for monitoring the effects of thalidomide on an individual patient basis. The significant correlation between MRI and fluorescence microscopic measures of MMCM extravasation supports the utility of the non-invasive MRI approach for assessing the action of thalidomide on tumor blood vessels.
Keywords: Thalidomide, Experimental human breast cancer, Macromolecular contrast agent-enhanced MRI, Endothelial permeability, Immunofluorescent microscopy
Introduction
In 1953 thalidomide [α-(N-phthalimido)-glutarimide] was introduced clinically as a novel sedative and anti-nausea medication, but was eventually withdrawn from the market in 1960 after it was found to be a potent teratogen, inducing phocomelia and other severe developmental anomalies in the human fetus [1]. It was postulated that the limb defects associated with thalidomide were secondary to an inhibition of angiogenesis in developing fetal limb buds [2]. Despite its disreputable history, thalidomide is again being advanced for clinical use, exclusive of patients in the child-bearing period, because of its demonstrated efficacy in the treatment of autoimmune and inflammatory diseases [3–6]. Thalidomide also has been reported to have anti-angiogenic effects in certain malignancies [2, 7, 8], notably multiple myeloma and hepatocellular carcinoma [9, 10], where it was observed to suppress multiple angiogenic growth factors, including vascular endothelial growth factor (VEGF) [11], basic fibroblast growth factor (bFGF) [12] and tumor necrosis factor (TNF-α) [6]. However, the precise mechanism of the tumor inhibitory action for thalidomide is incompletely understood, but is believed to be, at least in part, independent of VEGF [13].
Previous reports have shown the utility of dynamic MRI enhanced with macromolecular contrast media (MMCM) to detect and quantitatively measure changes in cancer microvascular leakiness induced by a broad range of known angiogenesis inhibitors. Those previously examined angiogenesis inhibitory drugs with effects measurable by MMCM-enhanced dynamic magnetic resonance imaging (MRI) include bevacizumab, a monoclonal anti-VEGF antibody [14], celecoxib [15], a COX-2 inhibitor, and PTK787 [16], a VEGF-receptor tyrosine kinase inhibitor, all of which can be directly linked to the VEGF pathway. But no clear link between thalidomide and VEGF has been proven and the potential of dynamic MRI to detect and measure an effect of thalidomide on tumor vasculature has not been examined.
Accordingly, the primary goal of this study was to evaluate the potential of quantitative MMCM-enhanced MRI assays of microvascular leakiness and vascular richness for defining the purported angiogenesis inhibitory effect of thalidomide in an experimental breast cancer model. As a means of validation and to better understand the cellular basis of thalidomide action, MRI results were compared to immunofluorescence microscopic assays of endothelial leakiness, vascular richness and VEGF expression in the same human breast cancer xenografts.
Material and methods
Animal model
The study was performed with the approval of the Institutional Committee for Animal Research and in accordance with the guidelines of the National Institute of Health for the care and use of laboratory animals. Four-week-old female homozygous athymic rats (Hsd: RH-Foxn1rnu, Harlan, Indianapolis, Ind., n=9) were injected with 5×10⁶ cells of a poorly differentiated, estrogen-receptor-negative human breast cancer cell line, MDA-MB-435 (ATCC, Manassas, Va.). Suspended in a total volume of 0.5 ml as a 1:1 mixture of phosphate-buffered saline pH 7.4 (PBS) and Matrigel (BD Biosciences, San Jose, Calif.), the cells were injected subcutaneously into the right mammary fat pad using a 25-gauge needle (Abbott Laboratories, North Chicago, Ill.). A visual inspection of all animals was conducted every day for general appearance, behavior and tumor growth. When the tumors reached a volume of approximately 800 mm3, measured in three dimensions by caliper, animals were anesthetized by intraperitoneal injection of a combination of 35 mg per kg bodyweight pentobarbital (Nembutal, Abbott Laboratories, North Chicago, Ill.) and 0.025 ml per kg bodyweight buprenorphine hydrochloride (Buprenex, Reckitt Benckiser Pharmaceuticals, Richmond, Va.). For fast bolus contrast media injection and subsequent administration of lectin (Vector Laboratories, Burlingame, Calif.), a 25-gauge butterfly catheter (Abbott Laboratories, North Chicago, Ill.) was inserted in a tail vein. Rats were placed on a heated deuterated (D2O) water pad to keep the body temperature at physiologic levels during the scan without introducing water (H2O) flow artifacts into the MR image. All animals were imaged by dynamic contrast enhanced MRI on day 0 and again on day 7. Following baseline MRI, the rats were randomly assigned to either the thalidomide treatment or the saline control group. After the initial MRI the treatment group received intraperitoneal (i.p.) injections of thalidomide (Tocris Bioscience, Ellisville, Mo.) at a dose of 100 mg per kg bodyweight on day 0, day 3 and day 6. Because of its low solubility in water, thalidomide was prepared as a formulation in physiologic saline to which was added carboxymethylcellulose (CMC) at a concentration of 20 mg/ml saline. The control group received corresponding i.p. injections of pre-warmed saline containing the same concentration of CMC. Tissue preparation and staining procedures are described in the immunohistochemistry section below.
Contrast media
The synthesis of biotin-labeled albumin-(Gd-DTPA) conjugate (Fig. 1) followed an established method [17] with minor modifications, as described below. Briefly, biotin was converted to its 4-sulfono-2-nitrophenyl ester via the dicyclohexyl carbodiimide (DCC) method in anhydrous dimethylformamide. This active ester thus formed has greater water solubility compared with biotin itself and is also reactive toward amines. Next, the active ester of biotin was added to human albumin solution at pH 7.8 in HEPES buffer and the reaction was allowed to proceed for 24 h at room temperature. Subsequently, DTPA bisanhydride, suspended in anhydrous dimethylsulfoxide, was added in portions to the solution adjusted to pH 8.9 with vigorous stirring for 1 h. The coupling reaction was maintained at pH 8.9 for 8 h, and then mixed with excess gadolinium nitrilotriacitic acid complex, Gd(NTA)2, at pH 5.5 to complete Gd3+ chelation overnight. After purification by dialysis and size exclusion chromatography, the product solution was lyophilized to give a white, solid material which was analyzed to be a dual-labeled albumin derivative containing an average of 11 biotin groups (by avidin-HABA method) and 27 (Gd-DTPA) groups (by ICP-AES), both covalently bound to albumin lysine residues via amide linkages. The exact range of variation is undetermined. This macromolecular contrast agent has an actual molecular weight of ~90 kDa. Its effective molecular weight resembles that of a 180-kDa globulin, as measured by size-exclusion HPLC with comparison to protein standards. At 23°C and 0.25 Tesla, T1-relaxivity MMCM was measured at 11 mM−1s−1 per Gd ion and 297 mM−1s−1 per albumin-core molecule. The contrast agent was administered at a dose of 0.03 mmol Gd per kg bodyweight.
Fig. 1.
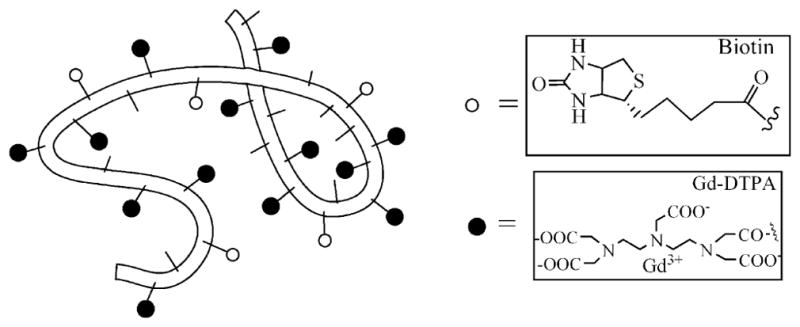
Schematic structure of albumin-(Gd-DTPA)27-(biotin)11. The belt-like random coil represents the human albumin core element with amino-containing side chains of the lysine residues (small sticks) to which (Gd-DTPA) (black spheres) and biotin (white spheres) are covalently attached
MRI
MRI was performed using an Omega CSI-II system operating at 2.0 Tesla (Bruker Instruments, Fremont, Calif.). The system is equipped with Acustar S-150 self-shielded gradient coils. Rats were placed within a birdcage radiofrequency coil (length 7.6 cm, inner diameter 4.5 cm) in supine position. A series of nine precontrast T1-weighted inversion recovery centric-ordered fast gradient-recalled echo images (TR/TE=6.0/1.5 ms, number of acquisitions= 1, flip angle α=10°, matrix 64×64, field of view 50×50, slice thickness=3 mm), with TI varying between 100 and 2,500 ms, were obtained to calculate baseline relaxation rates (R1) of tumor tissue in each animal by curve fitting. The inversion recovery snapshot FLASH method is not suitable for R1 measurements of flowing blood. Therefore, the baseline R1 in the IVC was taken to be 0.752 s−1, which is the mean blood R1 in rats at 37°C and 2.0 Tesla measured in more than 200 previous specimens [18]. Subsequently, dynamic contrast-enhanced MRI was performed using a T1-weighted three-dimensional spoiled gradient refocused (SPGR) sequence acquiring two precontrast and 28 postcontrast images with high spatial resolution and TR=50 ms, TE=3 ms, NA=1, flip angle (α)=90°, matrix=128×128×16, field of view=50×50×48 mm, partition thickness=3 mm, acquisition time 1 min 42 s per image.
MRI data processing and kinetic analysis
A Dell Precision 670 Workstation (Dell, Austin, Tex.) with a Linux WS v.4 operating system (Red Hat Enterprise, Raleigh, N.C.) and MR Vision Software (MR Vision, Winchester, Mass.) were used for processing and analysis of the acquired image data. Regions of interest (ROIs) were acquired over the blood in the inferior vena cava (IVC) and the tumor for signal intensity measurements at each time point. The tumor periphery was defined as the outer 2-mm rim all around the tumor, shown in previous studies to be a representative region of viable tumor tissue less affected by elevated interstitial pressure and necrosis in the tumor center [19].
Postcontrast R1 values were calculated based on the measured signal intensity and the calculated value of precontrast R1 based on the inversion recovery data [20]. Differences between the precontrast and postcontrast R1 values (ΔR1) in blood and tumor were assumed to be directly proportional to the concentration of gadolinium in the tissue [20]. Estimates of the endothelial transfer coefficient KPS (μl/min·100 cm3) and the fractional plasma volume (fPV, %) were calculated based on kinetic analysis of the ΔR1 data as described in detail previously [21]. Briefly, a monoexponential function was used to fit the blood ΔR1 data, serving as a forcing function for the two-compartment bi-directional kinetic model used to fit the tumor ΔR1 data [22] (Fig. 2). The fractional rate of reflux from interstitial fluid back to plasma, k (min−1), was not resolvable in the time course of these experiments (1 h) and was therefore set to zero. Both blood and tissue models were fit to the data concurrently using the SAAM II software (SAAM Institute, Seattle, Wash.) that employs a weighted, nonlinear least squares estimation algorithm [23].
Fig. 2.
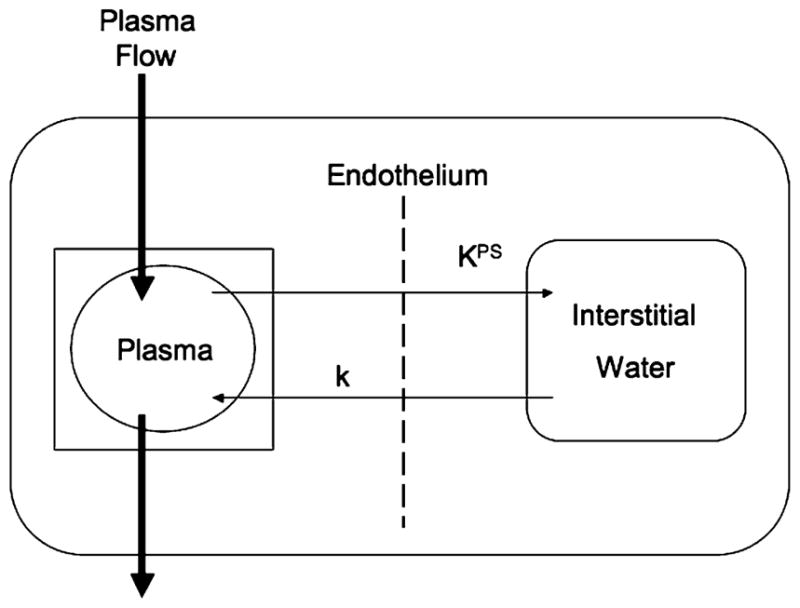
Kinetic model. A simple two-compartment tissue model describing the kinetics of contrast media transport from the plasma space into the interstitial fluid. The endothelial transfer coefficient KPS [μl/(min·100 cm3)] denotes the clearance of contrast medium from plasma to interstitial water. Denoting the fractional rate of reflux from interstitial fluid back to plasma, the rate constant k (min−1) was not resolvable in the time course of these experiments (1 h) and is therefore set to zero. The box around the plasma compartment denotes a forcing function, representing the monoexponential disappearance of MMCM from the blood. The kinetics of both compartments, taken together, reflect the dynamic response of the entire tissue/tumor to contrast medium enhancement following bolus intravenous injection
Measurement errors in the ΔR1 data were assumed to be independent and Gaussian, with zero mean and fractional standard deviation (SD) known within a scale factor determined from the data. Weights were optimally chosen, i.e., equal to the inverse of the variance of the measurement error. The precision of the parameter value estimates was determined from the covariance matrix at the least squares fit. Very low estimates of KPS with coefficients of variation greater than 100% have been tabulated as zero for the purposes of analysis.
Tumor fixation by vascular perfusion
At the completion of the MR examination on day 7, the rats were injected via the tail vein with 1 ml of FITC-labeled Lycopersicon esculentum (tomato) lectin (1 mg/ml in 0.9% NaCl; Vector Laboratories, Burlingame, Calif.) for microscopic assessment of the population of perfused blood vessels in the tumor [24]. This lectin adheres to endothelial cells. Two minutes after the lectin infusion, the chest cavity was opened rapidly and, through a 20-gauge cannula inserted into the aorta via an incision in the left ventricle, the entire vasculature was flushed for 2 min at a pressure of 140 mmHg with fixative (1% paraformaldehyde in PBS, pH 7.4; Sigma-Aldrich, St. Louis, Mo.). Blood and fixative were allowed to exit through an incision placed in the right atrium. Fixed tumors were excised, immersed in 1% paraformaldehyde in PBS for 1 h at 4 °C, rinsed three times with PBS, infiltrated with 30% sucrose, frozen in Tissue-Tek OCT (Optimal Cutting Temperature, VWR, Brisbane, Calif.) compound, and processed for immunohistochemistry as described elsewhere [24].
Immunohistochemistry
Cryostat sections (80 μm thickness) of MDA-MB-435 tumors were cut and dried on Superfrost Plus slides (Fisher Scientific, Pittsburgh, Pa.). The tissues were permeabilized with PBS containing 0.3% Triton X-100 (Lab Chem, Pittsburgh, Pa.) and incubated in 5% normal serum (Jackson ImmunoResearch, West Grove, Pa.) in PBS-plus [PBS containing 0.3% Triton X-100, 0.2% bovine serum albumin (Sigma-Aldrich, St. Louis, Mo.), and 0.01% thimerosal] for 1 h at room temperature to block non-specific antibody binding. Sections were incubated overnight with primary antibodies, listed below, diluted in 5% normal goat serum or donkey serum and 95% PBS-plus at room temperature. Endothelial cells, whether lectin-stained or not, were stained with rat monoclonal anti-RECA-1 (1:250, Pharmingen, San Diego, Calif.) to provide a means to assess the entire population of endothelial cells in the section, regardless of their perfusion status. VEGF immunoreactivity of the human tumor cells was detected using goat polyclonal antibody anti-human VEGF (1:500, R&D Systems, Minneapolis, Minn.). After incubation in primary antibodies, specimens were rinsed with PBS containing 0.3% Triton X-100 and incubated for 4–6 h at room temperature with secondary antibodies diluted in 5% normal serum in PBS. The secondary antibody for rat anti-RECA-1 was Cy3-labeled goat anti-mouse IgG (1:400, Jackson ImmunoResearch, West Grove, Pa.); the secondary antibody for goat anti-VEGF was Cy3-labeled donkey anti-goat IgG (1:400, Jackson ImmunoResearch, West Grove, Pa.). Specimens were rinsed with PBS containing 0.3% Triton X-100, post-fixed in 4% paraformaldehyde, rinsed again with PBS, and mounted in Vectashield (Vector Laboratories, Burlingame, Calif.). To detect the extravasated albumin-(Gd-DTPA)27-(biotin)11 in tumor sections, Cy3-labeled streptavidin (1:400, Jackson ImmunoResearch, West Grove, Pa.) was used for staining. Streptavidin is a tetrameric protein that has high affinity for biotin.
Microscopic assessments of tumor vascularity
Measurements were made on 80-μm-thick sections of each tumor to determine the fractional area (two-dimensional area density) occupied by fluorescence from each of four fluorescent markers: (1) overall tumor vascularity as defined by the area density (%) of endothelial cell RECA-1 immunoreactivity; (2) amount of perfused tumor vasculature as defined by the area density (%) of lectin staining; (3) amount of leakage of MMCM as defined by the area density of streptavidin staining; and (4) amount of human VEGF in tumor cells as defined by area density (%) of human VEGF immunoreactivity.
Area densities were measured using ImageJ software (http://rsb.info.nih.gov/ij) on digital fluorescence microscopic images, each measuring 960×1,280 μm (10× objective, 1× Optovar). Based on an analysis of pixel fluorescence intensities, which ranged from 0 to 255, blood vessels were distinguished from background by empirically using only the pixels above a threshold value of 40, thus maximizing the inclusion of only those pixels with specific staining.
Area density was calculated as the percentage of total pixels having a fluorescence intensity value equal to or greater than the threshold [24]. Because the fluorescence threshold was set to provide the greatest signal-to-noise ratio to favor specific immunoreactivity, some of the faintest immunoreactivity may not have been included. However, as the threshold was applied uniformly, all experimental groups were treated similarly.
Statistical analysis
Blood half-life, fPVand KPS in tumor periphery of the saline-control and the thalidomide treatment groups were compared using unpaired t-tests. Correlation between KPS determinations and immunohistochemical streptavidin area density measurements from the same tumors was assessed using standard Pearson correlation. All statistical testing was performed using the GraphPad Prism Software (GraphPad, San Diego, Calif.). Differences between groups of immunohistochemistry data were assessed using ANOVA followed by the Bonferroni-Dunn test for multiple comparisons. Comparisons with p<0.05 were considered significantly different.
Results
Over the 1-week, three-injection course of treatment, tumors grew from a calculated volume of 1,162± 157 mm3 at baseline to 3,080±538 mm3 (2.65-fold increase) at 7 days in the saline-treated control group and from a volume of 1,237±242 mm3 at baseline to 2,918± 313 mm3 (2.36-fold increase) at 7 days in the thalidomide-treated group. Tumor growth was not significantly different in the two groups. Animals tolerated all procedures well and no adverse effects were detected.
Representative dynamic contrast-enhanced MR images of a rat bearing a subcutaneous MDA-MB-435 tumor (Fig. 3) demonstrate a strong time-persistent enhancement of blood, seen best in the IVC, and modest tumor enhancement, seen best in the tumor periphery. Due to the macromolecular nature of albumin-(Gd-DTPA)27-(biotin)11 the first pass extraction fraction of this contrast agent in tumor is small, estimated to be in the range of less than 0.1%. Consequently, changes in signal intensity due to vascular permeability are correspondingly small and potentially difficult to appreciate visually, even as in this case of a discrete leak.
Fig. 3.

Representative T1-weighted spoiled gradient refocused (SPGR) images, precontrast and at 3 min, 15 min, 30 min and 60 min post injection of albumin-(Gd-DTPA)27-(biotin)11, which were used for the calculation of the endothelial transfer coefficient (KPS) and the fractional plasma volume (fPV). Note the tumor enhancement, most prominent in the rim. Due to the macromolecular nature of albumin-(Gd-DTPA)11-biotin27,however, the first pass extraction fraction in tumor tissue of our contrast agent is in the order of less than 0.1% and the changes in signal intensity caused thereby are correspondingly small. The blood enhancement seen in the IVC (white arrow) persisted over the 1-h course of data acquisition
The two-compartment tissue model and single-compartment central blood model fit the dynamic MRI data well in all studies with representative ΔR1 data sets and best fits for tumor periphery and IVC blood shown in Fig. 4. The average coefficients of variation of our KPS and fPV estimates determined from the covariance matrix for each least squares fit were 34% and 6%, respectively (Tables 1, 2).
Fig. 4.
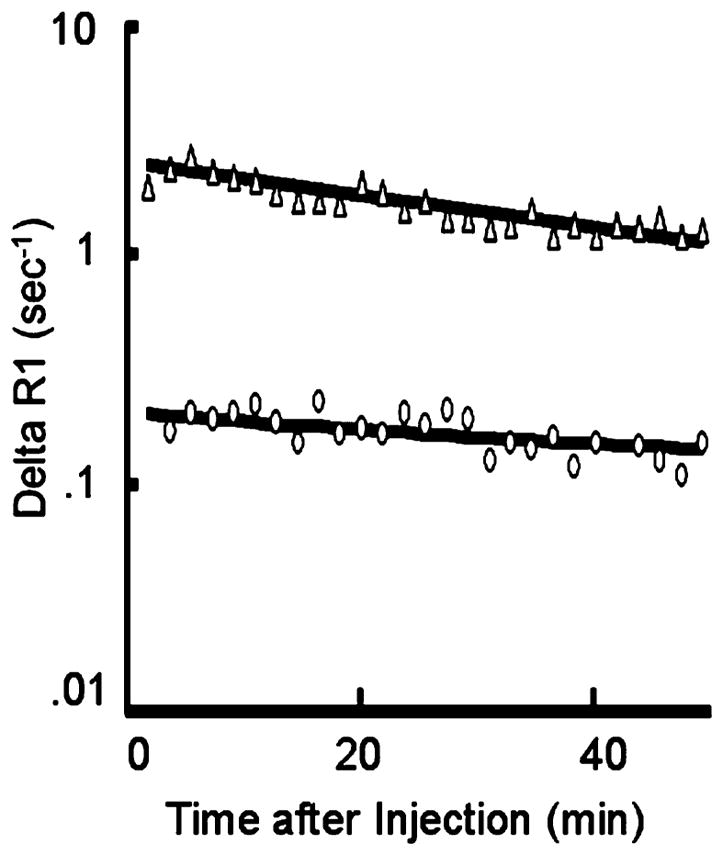
Representative fit (solid lines) of model to ΔR1 data from blood (Δ) and tumor (O) using MMCM enhancement. The deviation from a parallel relationship toward convergence of the blood and tumor fits on a semi-logarithmic plot indicates a leak of the MMCM from the blood into the interstitial space of this tumor. Had the two lines been parallel, it would have indicated no measurable leak. Due to the macromolecular nature of albumin-(Gd-DTPA)27-biotin11, and the therefore low first-pass extraction fraction in tumor tissue, the convergence of the two lines on the semi-logarithmic plot can be somewhat difficult to appreciate visually, in this case of a discrete leak
Table 1.
Measures of vascular permeability [KPS (μl/min·100 cm−3 of tissue)] in tumors treated with thalidomide or saline control (CV coefficient of variation obtained from covariance matrix at least-squares fit)
| Treatment group | Study | Baseline | Treatment Rx after 7 days | |||
|---|---|---|---|---|---|---|
|
|
|
|||||
| KPS1 | CV2 | KPS | CV | Streptavidin area density (%)3 | ||
| Thalidomide | 1 | 19.7 | 54 | 0 | – | 10.7 |
| 2 | 8.7 | 38 | 0 | – | 9.3 | |
| 3 | 14.2 | 37 | 0 | – | 38.0 | |
| 4 | 21.5 | 22 | 19.8 | 62 | 21.4 | |
| 5 | 33.0 | 31 | 11.6 | 63 | 13.3 | |
| Mean ± SD | 19.4±9.1 | 6.3±9.1a, b | 18.6±11.9b | |||
| Saline | 6 | 30.4 | 28 | 60.3 | 20 | 52.7 |
| 7 | 9.4 | 37 | 16.4 | 31 | 45.9 | |
| 8 | 37.6 | 36 | 27.5 | 23 | 51.7 | |
| 9 | 29.7 | 16 | 0 | – | 49.9 | |
| 10 | 24.1 | 18 | 30.5 | 29 | 50.8 | |
| 11 | 18.7 | 39 | 28.8 | 29 | 50.1 | |
| Mean ± SD | 25.0±19.1 | 27.3±18.1 | 50.2±2.3 | |||
Significant difference (p<0.05) between baseline and day 7
Significant difference (p<0.05) from same-day saline control
Table 2.
Measures of fractional plasma volume [fPV (ml cm−3 of tissue as %)] in tumors treated with thalidomide or saline control
| Treatment group | Study | Baseline | fPV | Treatment Rx after 7 days | ||
|---|---|---|---|---|---|---|
|
|
|
|||||
| fPV1 | CV2 | CV | Lectin area density (%)3 | |||
| Thalidomide | 1 | 5.6 | 6 | 4.4 | 4 | 9.66 |
| 2 | 2.5 | 4 | 5.5 | 3 | 17.58 | |
| 3 | 2.6 | 6 | 5.1 | 3 | 16.36 | |
| 4 | 2.7 | 6 | 6.7 | 6 | 20.92 | |
| 5 | 4.7 | 7 | 3.3 | 7 | 20.13 | |
| Mean ± SD | 5.0±1.3 | 3.6±1.4 | 16.9±4.5 | |||
| Saline | 6 | 5.0 | 5 | 5.6 | 6 | 16.61 |
| 7 | 2.4 | 4 | 3.7 | 4 | 17.60 | |
| 8 | 4.1 | 10 | 1.8 | 11 | 19.46 | |
| 9 | 2.6 | 6 | 4.1 | 3 | 16.22 | |
| 10 | 1.6 | 8 | 3.2 | 8 | 19.11 | |
| 11 | 2.7 | 8 | 2.4 | 10 | 15.34 | |
| Mean ± SD | 3.1±1.1 | 3.5±1.2 | 17.4±1.6 | |||
The individual values for tumor KPS, and the coefficient of variation of each KPS determination at the least squares fit for the thalidomide and saline treatment groups at baseline and 7 days following treatment are shown in Table 1. Also contained in Table 1 are the streptavidin area-density values for each animal obtained at 7 days following treatment with either thalidomide or saline. After 7 days of thalidomide, tumor vascular leakiness, as assayed by MMCM-enhanced MRI, decreased significantly (p< 0.05). The endothelial transfer coefficient, KPS in thalidomide-treated cancers decreased from 19.4±9.1 (μl/min·100 cm−3) to 6.3±9.1 (μl/min·100 cm−3) (64.2% decline; p<0.05). After 7 days of saline administration, KPS tumor increased slightly in the control group (from 25.0± 19.1 to 27.3±18.1) but not significantly (Table 1).
Extravasation of MMCM, assessed microscopically by streptavidin area-density measurements, was significantly less (p<0.05) in thalidomide-treated tumors (18.6±11.9%) than in the saline-treated tumors (50.2±2.3%, p<0.05) at day 7 (Table 1, Fig. 5). MRI-assayed KPS values correlated significantly (r=0.74, r2=0.55, p<0.05) with the microscopic streptavidin area-density measures of MMCM extravasation (Fig. 6).
Fig. 5.

Representative immunohistochemically stained human breast cancer sections (MDA-MB-435) showing leakage of macromolecular contrast medium (streptavidin-biotin reaction), vascular richness (lectin and RECA-1 antibody), and VEGF in tumor cells. Thalidomide treatment reduces the extravasation of albumin-(Gd-DTPA)27-(biotin)11 without reducing the abundance of tumor blood vessels. a Tumor section from the saline-control group administered albumin-(Gd-DTPA)27-(biotin)11. The strong red signal indicates extravascular 1-h accumulation of biotin-labeled contrast medium surrounding the yellow-green tumor microvessels. b After 7 days of treatment with thalidomide, the density of red-fluorescent, biotin-labeled contrast agent extravasated over 1 h is strongly reduced compared with a, indicating a reduction in leakage and extravascular accumulation of the macromolecules. Confocal microscopic images of tumor vessels in MDA-MB-435 tumors after treatment with saline (c, d) or thalidomide (e, f) for 7 days show no noticeable change in the area density of perfused blood vessels (green lectin-stained) or total blood vessels (red, RECA-1 stained). No difference is observable (c–f) between saline-control and thalidomide-treated groups with regard to tumor vascularity. (g, h). Representative MDA-MB-435 tumor sections after immunohistochemical staining for human VEGF after a 7-day, three-injection treatment protocol with saline (g) or thalidomide (h). No difference in amount VEGF immunoreactivity was detected in the two groups. Scale bar 115 μm in c–f and 120 μm in a, b
Fig. 6.
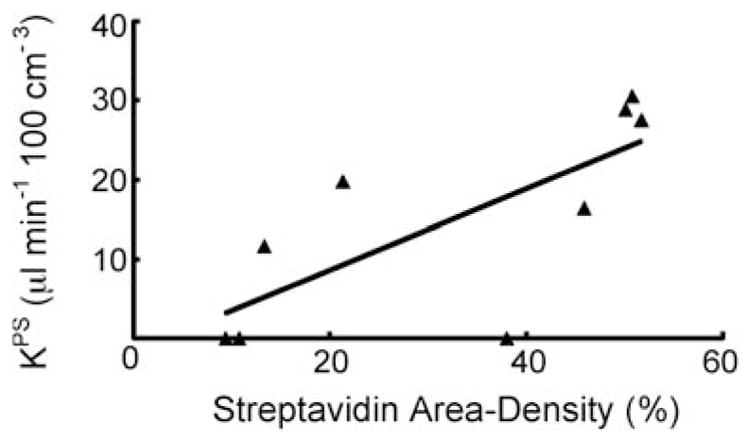
Graph showing the significant positive correlation (r=0.74, r2=0.55) for each examined tumor between the MRI-assayed endothelial transfer coefficient KPS [μl/(min·100 cm3)] and the immunohistochemically assessed streptavidin area density (%). Both KPS and streptavidin area density reflect the extent of leaked contrast medium. The solid line denotes the best fit
Thalidomide had no observable effect on tumor vascular density, as shown in Table 2. The mean MRI-assayed fractional plasma volume (fPV) of tumors in the thalidomide group was 3.6±1.4% on day 0 before treatment and 5.0±1.3% after treatment at 7 days, a non-significant change. MRI-assayed fPV values of saline-treated tumors were also not significantly different at baseline (3.1±1.1%) and after 1 week (3.5±1.2%).
Microscopic measures of tumor vascular richness agreed with the MRI findings; lectin area density, representing the microscopically assayed area density of perfused vessels, was not significantly different between thalidomide-treated tumors (16.9±4.5%) and saline-treated tumors (17.4± 1.6%, Fig. 5). Another measurement of tumor vascular richness provided by area density of RECA-1 stained endothelial cells showed no significant difference between the thalidomide-treated and the saline-treated control groups (19.9±1.4% vs 18.7±1.6%, Table 3).
Table 3.
Measurement of RECA-1 and VEGF area density in tumors treated with thalidomide or saline control. Values obtained after 7 days of therapy
| Treatment group | Study | RECA-1 area density (%)1 | VEGF area density (%)1 |
|---|---|---|---|
| Thalidomide | 1 | 17.90 | 13.8 |
| 2 | 20.05 | 12.6 | |
| 3 | 19.48 | 11.4 | |
| 4 | 20.32 | 11.8 | |
| 5 | 21.67 | 13.2 | |
| Mean ± SD | 19.9±1.4 | 12.6±1.0 |
Immunohistochemical measurements of VEGF presence within tumor cells revealed no significant difference between thalidomide-treated (12.6±1.0%) and saline-treated tumors (11.2±1.4%, Table 3 and Fig. 5) after 7 days of treatment.
Discussion
Thalidomide, a demonstrated inhibitor of angiogenesis in some tumors, significantly decreased the extravasation of a macromolecular contrast agent in a human breast cancer model. This effect was measured independently by two techniques, non-invasively by dynamic MRI enhanced with the macromolecular contrast agent, albumin-(Gd-DTPA)27-(biotin)11, and immunohistochemically by fluorescence microscopy with streptavidin staining of the same biotin-tagged MMCM. To our knowledge, the direct effect of thalidomide on tumor blood vessel leakiness has not been examined before, and non-invasive imaging, using MRI or other modalities, has not been applied to characterize the microvascular response of any tumor to thalidomide treatment.
Our results provide evidence for a substantial effect of thalidomide on tumor blood vessels, specifically a reduction in vascular permeability with respect to macromolecular solutes, and that this effect can be assayed by MMCM-enhanced MRI. Among the abnormal morphologic features of tumor vessels are a defective endothelial monolayer, an abnormal pericyte integrity, contributing to increased tumor vessel leakiness to macromolecules, as well as increased vessel diameter and tortuosity [25]. The inhibition of angiogenesis in tumors has been associated with a maturation of cancer vessels towards a more physiologic phenotype, resulting in a consecutive decrease in vascular diameter, tortuosity and endothelial permeability [26]. Potential extrapolation of the MMCM-enhanced MRI technique to individual patients might allow for the clinical characterization of tumors and for timely monitoring of tumor treatment responses to thalidomide. Our results are also important because they extend the range of tumor-active drugs and thus the robustness of the MMCM-enhanced MRI technique for monitoring vascular effects of cancer interventions.
Inhibitory effects of thalidomide on tumors have been reported in preclinical models [2] and in human clinical trials [9, 27–32]. Favorable results in patients, ranging from partial responses, to disease stabilization, to tumor regression have been reported for multiple myeloma [9, 27], AIDS-related Kaposi’s sarcoma [28], high-grade gliomas [29], hepatocellular carcinoma [30], renal cell carcinoma [31, 32], and advanced melanoma [31].
Thalidomide’s mechanisms of action against cancer and cancer vessels are complex and remain incompletely understood. Its putative anti-angiogenic properties have been attributed to suppression of cytokine-induced nuclear factor κB (NF-κB) [33], tumor necrosis factor-α (TNF-α) [6] and vascular endothelial growth factor (VEGF) [11]. Li and coworkers reported that thalidomide significantly decreased VEGF expression in cultured human lung cancer cells [11]. However, in our study of human breast cancer xenografts, immunohistochemical measurements detected no reduction in growth, vascular richness, or tumor cell VEGF in response to thalidomide administration. Our data are in agreement with Invernizzi et al. [34], who found no significant change in VEGF expression after thalidomide treatment in bone marrow cells of patients with myelodysplastic syndrome. Yabu et al. [35] showed that thalidomide exerts its action on the VEGF system by a depletion of VEGF receptors rather than on VEGF production itself; such a mode of action would be consistent with our microscopic observations of unaltered VEGF expression in human breast cancer cells.
The significant positive correlation between MRI and microscopic measurements of microvascular leakiness assayed with the same macromolecular probe provides strong support for our conclusion that thalidomide reduces microvascular leakiness in this tumor. The correlation (r2=0.55) is limited particularly by one low KPS value correlated with a high streptavidin area-density value. However, we have no definite evidence of spurious data either from the MRI experiment or from the immunohistochemical preparation of the tissue to call either of these determinations faulty. Consequently, we have taken the conservative approach to include it into our analysis.
The observed absence of detectable effect of thalidomide on tumor vascular richness (fPV, lectin area density, or RECA-1 area density) or on tumor growth could be attributable to a relatively short 7-day course of thalidomide administration, the low 100 mg per kg bodyweight dose of thalidomide, or an insensitivity of the vasculature of the MDA-MB-435 breast cancer to thalidomide. Nonetheless, the observed results suggest that dynamic contrast-enhanced MRI can detect a change in macromolecular extravasation without a reduction in tumor vascularity. Consistent with our observations but still compatible with an angiogenesis inhibitory action of thalidomide, Daruwalla et al. [36] reported a much-delayed tumor growth suppression induced by thalidomide in a mouse colorectal cancer model; significant growth suppression in those tumors was observed after 35 days, but could not be detected after 21 days of thalidomide.
As in our study, previous reports on the use of dynamic MMCM-enhanced MRI to characterize the vascular properties of tumor vessels after other forms of drug treatment have shown changes in macromolecular permeability, KPS, to be more robust, more consistently observed and earlier than changes in tumor vascular richness [15, 16, 37]. Repeated observations as these with different purported inhibitors of tumor angiogenesis indicate that alterations of vascular permeability may be more sensitive and earlier detectable than changes in vascular richness.
The results of our study are limited. We examined only one tumor type (MDA-MB-435 human breast cancer), grown in athymic rats, using one experimental MRI contrast agent not intended for human use, with a single 1-week, three-dose course of thalidomide. Many variations in experimental design could be tested. Unlike MRI, microscopic evaluations of immunohistochemically stained tumors are limited to one time point at the end of the experiment.
The mechanism of an anti-leak effect of thalidomide is still undefined; however, the change seems not to result from decreased VEGF expression in tumor cells. VEGF production may not be the major or sole target of thalidomide.
In conclusion, thalidomide, a reported inhibitor of tumor angiogenesis, reduced cancer microvascular permeability as assayed by dynamic MRI and confirmed by fluorescence microscopy, but did not reduce tumor growth, vascular richness or VEGF expression after a 7-day course of treatment in an experimental human breast cancer model. Potential translation of the MMCM-enhanced MRI assay to clinical practice could prove valuable for the non-invasive and timely monitoring of thalidomide therapeutic action on an individual tumor basis.
Acknowledgments
This work was supported by National Institutes of Health grants R01 CA082923 and R01 CA103850 from the National Cancer Institute (RB) and R01 HL-24136 and R01 HL-59157 537 from the National Heart, Lung, and Blood Institute (DM).
Contributor Information
Clemens C. Cyran, Department of Clinical Radiology, Klinikum Grosshadern, Ludwig-Maximilians-University, Munich, Germany. Center for Pharmaceutical and Molecular Imaging, Department of Radiology, University of California San Francisco, 513 Parnassus Avenue, San Francisco, CA, 94143-0628, USA
Barbara Sennino, Comprehensive Cancer Center, Cardiovascular Research Institute, and Department of Anatomy, University of California San Francisco, San Francisco, CA, 91413-0452, USA.
Bundit Chaopathomkul, Center for Pharmaceutical and Molecular Imaging, Department of Radiology, University of California San Francisco, 513 Parnassus Avenue, San Francisco, CA, 94143-0628, USA.
Yanjun Fu, Center for Pharmaceutical and Molecular Imaging, Department of Radiology, University of California San Francisco, 513 Parnassus Avenue, San Francisco, CA, 94143-0628, USA.
Victor S. Rogut, Center for Pharmaceutical and Molecular Imaging, Department of Radiology, University of California San Francisco, 513 Parnassus Avenue, San Francisco, CA, 94143-0628, USA
David M. Shames, Center for Pharmaceutical and Molecular Imaging, Department of Radiology, University of California San Francisco, 513 Parnassus Avenue, San Francisco, CA, 94143-0628, USA
Michael F. Wendland, Center for Pharmaceutical and Molecular Imaging, Department of Radiology, University of California San Francisco, 513 Parnassus Avenue, San Francisco, CA, 94143-0628, USA
Donald M. McDonald, Comprehensive Cancer Center, Cardiovascular Research Institute, and Department of Anatomy, University of California San Francisco, San Francisco, CA, 91413-0452, USA
Robert C. Brasch, Center for Pharmaceutical and Molecular Imaging, Department of Radiology, University of California San Francisco, 513 Parnassus Avenue, San Francisco, CA, 94143-0628, USA
References
- 1.Mellin GW, Katzenstein M. The saga of thalidomide. Neuropathy to embryopathy, with case reports of congenital anomalies. N Engl J Med. 1962;267:1184–1192. doi: 10.1056/NEJM196212062672305. [DOI] [PubMed] [Google Scholar]
- 2.D’Amato RJ, Loughnan MS, Flynn E, Folkman J. Thalidomide is an inhibitor of angiogenesis. Proc Natl Acad Sci USA. 1994;91(9):4082–4085. doi: 10.1073/pnas.91.9.4082. [DOI] [PMC free article] [PubMed] [Google Scholar]
- 3.Bolke E, Gripp S, Peiper M, Budach W, Schwarz A, Orth K, Reinecke P, van de Nes JA. Multifocal epithelioid hemangioendothelioma: case report of a clinical chamaeleon. Eur J Med Res. 2006;11(11):462–466. [PubMed] [Google Scholar]
- 4.Klausner JD, Freedman VH, Kaplan G. Thalidomide as an anti-TNF-alpha inhibitor: implications for clinical use. Clin Immunol Immunopathol. 1996;81(3):219–223. doi: 10.1006/clin.1996.0181. [DOI] [PubMed] [Google Scholar]
- 5.Moreira AL, Sampaio EP, Zmuidzinas A, Frindt P, Smith KA, Kaplan G. Thalidomide exerts its inhibitory action on tumor necrosis factor alpha by enhancing mRNA degradation. J Exp Med. 1993;177(6):1675–1680. doi: 10.1084/jem.177.6.1675. [DOI] [PMC free article] [PubMed] [Google Scholar]
- 6.Sampaio EP, Sarno EN, Galilly R, Cohn ZA, Kaplan G. Thalidomide selectively inhibits tumor necrosis factor alpha production by stimulated human monocytes. J Exp Med. 1991;173(3):699–703. doi: 10.1084/jem.173.3.699. [DOI] [PMC free article] [PubMed] [Google Scholar]
- 7.Figg WD, Dahut W, Duray P, Hamilton M, Tompkins A, Steinberg SM, Jones E, Premkumar A, Linehan WM, Floeter MK, et al. A randomized phase II trial of thalidomide, an angiogenesis inhibitor, in patients with androgen-independent prostate cancer. Clin Cancer Res. 2001;7(7):1888–1893. [PubMed] [Google Scholar]
- 8.Ng SS, Gutschow M, Weiss M, Hauschildt S, Teubert U, Hecker TK, Luzzio FA, Kruger EA, Eger K, Figg WD. Antiangiogenic activity of N-substituted and tetrafluorinated thalidomide analogues. Cancer Res. 2003;63(12):3189–3194. [PubMed] [Google Scholar]
- 9.Rajkumar SV, Fonseca R, Dispenzieri A, Lacy MQ, Lust JA, Witzig TE, Kyle RA, Gertz MA, Greipp PR. Thalidomide in the treatment of relapsed multiple myeloma. Mayo Clin Proc. 2000;75(9):897–901. doi: 10.4065/75.9.897. [DOI] [PubMed] [Google Scholar]
- 10.Patt YZ, Hassan MM, Lozano RD, Nooka AK, Schnirer II, Zeldis JB, Abbruzzese JL, Brown TD. Thalidomide in the treatment of patients with hepatocellular carcinoma: a phase II trial. Cancer. 2005;103(4):749–755. doi: 10.1002/cncr.20821. [DOI] [PubMed] [Google Scholar]
- 11.Li X, Liu X, Wang J, Wang Z, Jiang W, Reed E, Zhang Y, Liu Y, Li QQ. Thalidomide down-regulates the expression of VEGF and bFGF in cisplatin-resistant human lung carcinoma cells. Anticancer Res. 2003;23(3B):2481–2487. [PubMed] [Google Scholar]
- 12.Kenyon BM, Browne F, D’Amato RJ. Effects of thalidomide and related metabolites in a mouse corneal model of neovascularization. Exp Eye Res. 1997;64(6):971–978. doi: 10.1006/exer.1997.0292. [DOI] [PubMed] [Google Scholar]
- 13.Zhao D, Jiang L, Hahn EW, Mason RP. Continuous low-dose (metronomic) chemotherapy on rat prostate tumors evaluated using MRI in vivo and comparison with histology. Neoplasia. 2005;7(7):678–687. doi: 10.1593/neo.04757. [DOI] [PMC free article] [PubMed] [Google Scholar]
- 14.Turetschek K, Preda A, Novikov V, Brasch RC, Weinmann HJ, Wunderbaldinger P, Roberts TP. Tumor microvascular changes in anti-angiogenic treatment: assessment by magnetic resonance contrast media of different molecular weights. J Magn Reson Imaging. 2004;20(1):138–144. doi: 10.1002/jmri.20049. [DOI] [PubMed] [Google Scholar]
- 15.Fournier LS, Novikov V, Lucidi V, Fu Y, Miller T, Floyd E, Shames DM, Brasch RC. MR monitoring of cyclooxygenase-2 inhibition of angiogenesis in a human breast cancer model in rats. Radiology. 2007;243(1):105–111. doi: 10.1148/radiol.2431050658. [DOI] [PubMed] [Google Scholar]
- 16.Turetschek K, Preda A, Floyd E, Shames DM, Novikov V, Roberts TP, Wood JM, Fu Y, Carter WO, Brasch RC. MRI monitoring of tumor response following angiogenesis inhibition in an experimental human breast cancer model. Eur J Nucl Med Mol Imaging. 2003;30(3):448–455. doi: 10.1007/s00259-002-1000-5. [DOI] [PubMed] [Google Scholar]
- 17.van Dijke CF, Mann JS, Rosenau W, Wendland MF, Roberts TP, Roberts HC, Demsar F, Brasch RC. Comparison of MR contrast-enhancing properties of albumin-(biotin)10-(gadopentetate)25, a macromolecular MR blood pool contrast agent, and its microscopic distribution. Acad Radiol. 2002;9(Suppl 1):S257–S260. doi: 10.1016/s1076-6332(03)80451-8. [DOI] [PubMed] [Google Scholar]
- 18.Schwickert HC, Roberts TP, Shames DM, van Dijke CF, Disston A, Muhler A, Mann JS, Brasch RC. Quantification of liver blood volume: comparison of ultra short TI inversion recovery echo planar imaging (UL-STIR-EPI), with dynamic 3D-gradient recalled echo imaging. Magn Reson Med. 1995;34(6):845–852. doi: 10.1002/mrm.1910340609. [DOI] [PubMed] [Google Scholar]
- 19.Preda A, Turetschek K, Daldrup H, Floyd E, Novikov V, Shames DM, Roberts TP, Carter WO, Brasch RC. The choice of region of interest measures in contrast-enhanced magnetic resonance image characterization of experimental breast tumors. Invest Radiol. 2005;40(6):349–354. doi: 10.1097/01.rli.0000163740.40474.48. [DOI] [PubMed] [Google Scholar]
- 20.Roberts TP, Brasch RC, Schwickert HC, Shames DM, vanDijke CF, Stiskal M, Mann JS, Muhler A, Demsar F. Quantification of tissue gadolinium concentration using magnetic resonance imaging: comparison of ultrashort inversion time inversion recovery echoplanar and dynamic three-dimensional spoiled gradient-recalled approaches with in vitro measurements. Acad Radiol. 1996;3(Suppl 2):S282–S285. doi: 10.1016/s1076-6332(96)80557-5. [DOI] [PubMed] [Google Scholar]
- 21.Daldrup H, Shames DM, Wendland M, Okuhata Y, Link TM, Rosenau W, Lu Y, Brasch RC. Correlation of dynamic contrast-enhanced magnetic resonance imaging with histologic tumor grade: comparison of macromolecular and small-molecular contrast media. Pediatr Radiol. 1998;28(2):67–78. doi: 10.1007/s002470050296. [DOI] [PubMed] [Google Scholar]
- 22.Daldrup HE, Shames DM, Husseini W, Wendland MF, Okuhata Y, Brasch RC. Quantification of the extraction fraction for gadopentetate across breast cancer capillaries. Magn Reson Med. 1998;40(4):537–543. doi: 10.1002/mrm.1910400406. [DOI] [PubMed] [Google Scholar]
- 23.Foster DM, Boston RC, Jacquez JA, Zech L. A resource facility for kinetic analysis: modeling using the SAAM computer programs. Health Phys. 1989;57(Suppl 1):457–466. doi: 10.1097/00004032-198907001-00063. [DOI] [PubMed] [Google Scholar]
- 24.Inai T, Mancuso M, Hashizume H, Baffert F, Haskell A, Baluk P, Hu-Lowe DD, Shalinsky DR, Thurston G, Yancopoulos GD, et al. Inhibition of vascular endothelial growth factor (VEGF) signaling in cancer causes loss of endothelial fenestrations, regression of tumor vessels, and appearance of basement membrane ghosts. Am J Pathol. 2004;165(1):35–52. doi: 10.1016/S0002-9440(10)63273-7. [DOI] [PMC free article] [PubMed] [Google Scholar]
- 25.Hashizume H, Baluk P, Morikawa S, McLean JW, Thurston G, Roberge S, Jain RK, McDonald DM. Openings between defective endothelial cells explain tumor vessel leakiness. Am J Pathol. 2000;156(4):1363–1380. doi: 10.1016/S0002-9440(10)65006-7. [DOI] [PMC free article] [PubMed] [Google Scholar]
- 26.Jain RK. Normalizing tumor vasculature with anti-angiogenic therapy: a new paradigm for combination therapy. Nat Med. 2001;7(9):987–989. doi: 10.1038/nm0901-987. [DOI] [PubMed] [Google Scholar]
- 27.Barlogie B, Desikan R, Eddlemon P, Spencer T, Zeldis J, Munshi N, Badros A, Zangari M, Anaissie E, Epstein J, et al. Extended survival in advanced and refractory multiple myeloma after single-agent thalidomide: identification of prognostic factors in a phase 2 study of 169 patients. Blood. 2001;98(2):492–494. doi: 10.1182/blood.v98.2.492. [DOI] [PubMed] [Google Scholar]
- 28.Little RF, Wyvill KM, Pluda JM, Welles L, Marshall V, Figg WD, Newcomb FM, Tosato G, Feigal E, Steinberg SM, et al. Activity of thalidomide in AIDS-related Kaposi’s sarcoma. J Clin Oncol. 2000;18(13):2593–2602. doi: 10.1200/JCO.2000.18.13.2593. [DOI] [PubMed] [Google Scholar]
- 29.Fine HA, Figg WD, Jaeckle K, Wen PY, Kyritsis AP, Loeffler JS, Levin VA, Black PM, Kaplan R, Pluda JM, et al. Phase II trial of the antiangiogenic agent thalidomide in patients with recurrent high-grade gliomas. J Clin Oncol. 2000;18(4):708–715. doi: 10.1200/JCO.2000.18.4.708. [DOI] [PubMed] [Google Scholar]
- 30.Patt YZ, Hassan MM, Lozano RD, Ellis LM, Peterson JA, Waugh KA. Durable clinical response of refractory hepatocellular carcinoma to orally administered thalidomide. Am J Clin Oncol. 2000;23(3):319–321. doi: 10.1097/00000421-200006000-00023. [DOI] [PubMed] [Google Scholar]
- 31.Eisen T, Boshoff C, Mak I, Sapunar F, Vaughan MM, Pyle L, Johnston SR, Ahern R, Smith IE, Gore ME. Continuous low dose Thalidomide: a phase II study in advanced melanoma, renal cell, ovarian and breast cancer. Br J Cancer. 2000;82(4):812–817. doi: 10.1054/bjoc.1999.1004. [DOI] [PMC free article] [PubMed] [Google Scholar]
- 32.Stebbing J, Benson C, Eisen T, Pyle L, Smalley K, Bridle H, Mak I, Sapunar F, Ahern R, Gore ME. The treatment of advanced renal cell cancer with high-dose oral thalidomide. Br J Cancer. 2001;85(7):953–958. doi: 10.1054/bjoc.2001.2025. [DOI] [PMC free article] [PubMed] [Google Scholar]
- 33.Keifer JA, Guttridge DC, Ashburner BP, Baldwin AS., Jr Inhibition of NF-kappa B activity by thalidomide through suppression of IkappaB kinase activity. J Biol Chem. 2001;276(25):22382–22387. doi: 10.1074/jbc.M100938200. [DOI] [PubMed] [Google Scholar]
- 34.Invernizzi R, Travaglino E, De Amici M, Brugnatelli S, Ramajoli I, Rovati B, Benatti C, Ascari E. Thalidomide treatment reduces apoptosis levels in bone marrow cells from patients with myelodysplastic syndromes. Leuk Res. 2005;29(6):641–647. doi: 10.1016/j.leukres.2004.11.008. [DOI] [PubMed] [Google Scholar]
- 35.Yabu T, Tomimoto H, Taguchi Y, Yamaoka S, Igarashi Y, Okazaki T. Thalidomide-induced antiangiogenic action is mediated by ceramide through depletion of VEGF receptors, and is antagonized by sphingosine-1-phosphate. Blood. 2005;106(1):125–134. doi: 10.1182/blood-2004-09-3679. [DOI] [PubMed] [Google Scholar]
- 36.Daruwalla J, Nikfarjam M, Malcontenti-Wilson C, Muralidharan V, Christophi C. Effect of thalidomide on colorectal cancer liver metastases in CBA mice. J Surg Oncol. 2005;91(2):134–140. doi: 10.1002/jso.20289. [DOI] [PubMed] [Google Scholar]
- 37.Pham CD, Roberts TP, van Bruggen N, Melnyk O, Mann J, Ferrara N, Cohen RL, Brasch RC. Magnetic resonance imaging detects suppression of tumor vascular permeability after administration of antibody to vascular endothelial growth factor. Cancer Invest. 1998;16(4):225–230. doi: 10.3109/07357909809039771. [DOI] [PubMed] [Google Scholar]