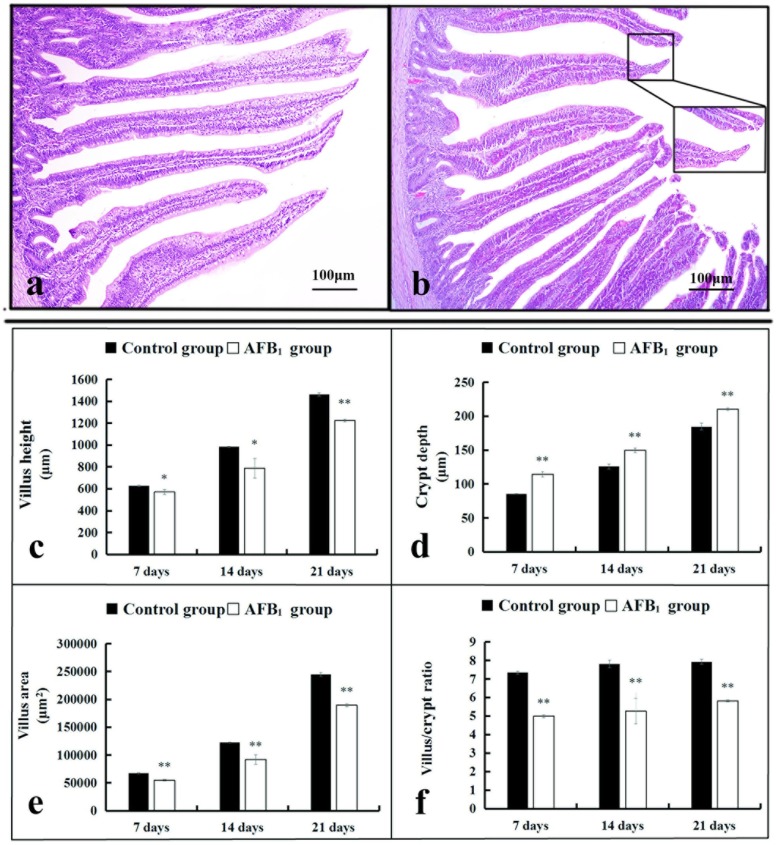
Figure 1. The histological structure of jejunum and the values of microscopic quantitative analysis.
(a-b) The histological structure of jejunum at 14 days of age (HE staining, scale bar: 100 μm), (a) control group; (b) AFB1 group. (c-f) The values of microscopic quantitative analysis, c-f: the values of villus height, crypt depth, villus area and villus/crypt ratio, respectively.
Note: data are presented with the means ± standard deviation (n=6). *p < 0.05, **p < 0.01 compared with the control group.

