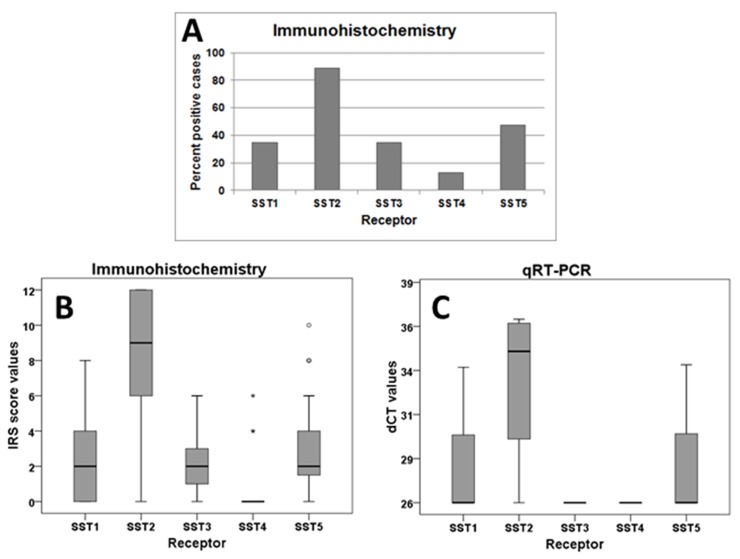
Figure 2. Frequency distribution and intensity of expression of SST subtypes in paragangliomas.
(A), Number of positive cases for different SSTs in immunohistochemical stainings. (B), Box plots of expression levels (IRS values) of SSTs as determined by immunohistochemistry. Depicted are the median of mean patient values, upper and lower quartiles, minimum and maximum values, and outliers. (C), Box plots of expression levels (dCT-values) of SSTs as determined by qRT-PCR.

