Abstract
Speech-language pathologists (SLPs) are trained to correct articulation of people diagnosed with motor speech disorders by analyzing articulators’ motion and assessing speech outcome while patients speak. To assist SLPs in this task, we are presenting the Multimodal Speech Capture System (MSCS) that records and displays kinematics of key speech articulators, the tongue and lips, along with voice, using unobtrusive methods. Collected speech modalities, tongue motion, lips gestures, and voice, are visualized not only in real-time to provide patients with instant feedback but also offline to allow SLPs to perform post-analysis of articulators’ motion, particularly the tongue, with its prominent but hardly visible role in articulation. We describe the MSCS hardware and software components, and demonstrate its basic visualization capabilities by a healthy individual repeating the words “Hello World”. A proof-of-concept prototype has been successfully developed for this purpose, and will be used in future clinical studies to evaluate its potential impact on accelerating speech rehabilitation by enabling patients to speak as naturally. Pattern matching algorithms to be applied to the collected data can provide patients with quantitative and objective feedback on their speech performance, unlike current methods that are mostly subjective, and may vary from one SLP to another.
Index Terms: Magnetic dipole localization, electromagnetic articulography (EMA), lip reading, magnetometers, motor speech disorders, tongue tracking, visualization
I. Introduction
Speech disorders can affect people suffering from brain damage due to traumatic injuries, stroke, tumors, or neurodegenerative diseases [1], [2]. For instance, apraxia of speech [3] and dysarthria [4] are motor speech disorders that cause impaired movements of the speech articulators, including the lips, oral muscles, and the tongue. Synchronized movements of the speech articulators are necessary for modulating the voicing generated by the vocal folds [5]. Once coordination of the articulators’ movements is affected, the speech may be compromised and incomprehensible. Sources of unintelligibility could be caused by abnormal rhythm and prosody, slow rate of speech, and distorted, weak, or omitted sounds [6]. Statistics about speech problems as a whole are scarce [3], but according to the existing data [7], in 2012, about 5% of children suffered from such problems in the U.S. In adults, the statistics are classified according to etiology due to the fact that the type of motor speech disorder is dictated by the site of lesion within the neurological system. Despite commonalities in neural bases of motor speech impairment, the patients’ speech can also be affected by gender, age, background, and neurological comorbidities, such as a cognitive-linguistic impairment [6].
Recovery of speech production skills, including improved synchronization of articulators’ movements involves structured therapy provided by speech-language pathologists (SLPs), in which patients may be asked to repeat a list of utterances, such as phonemes, words, and sentences. These repetitions often follow producing a model by the SLP that allows the client to listen and observe target speech patterns for reference. Speech performance is then assessed by the SLP by listening to the patient’s utterance, while watching the movement of the lips and jaw. Identification of errors in lip and jaw placement as well as perceived placement of the tongue result in the clinician offering useful feedback beyond articulation to correct speech deficits and encourage improvement in speech legibility.
Unfortunately, in current practice, relying on this form of analysis and assessment of speech is rather subjective and prone to different interpretations among SLPs [8]. Issues in reproducibility and consistency of the assessment could occur due to internal biases that may influence judgment of voice [9], and perceptual judgement is more practical and frequently used by SLPs but results in subjective ratings [10]. The traditional method of auditory-visual (audiovisual) feedback focuses on the outcome instead of the actual cause of speech production error. However, analyzing the cause of speech errors utilizing traditional audiovisual feedback, shortcomings have been noted including the inability to track the movement of the tongue, one of the most important articulators [11]. The tongue is rarely visible as it is hidden inside the oral cavity. Another issue is that lip movements during speech are rather fast, thus they cannot be easily analyzed without recording and playback. Also, to correct errant sounds, SLPs often demonstrate the proper place and manner of the articulators but this process also suffers from the abovementioned problems.
Given the issues and limitations of traditional audiovisual feedback, rehabilitation performed by SLPs might greatly benefit from a system capable of capturing and analyzing articulator movements during speech. Many publications have shown the benefits of audiovisual feedback-based treatment for people suffering from different types of speech disorders [12] and second language learners [13] in reducing their accent or in easing or accelerating the acquisition of a new language. Our proposed solution, the multimodal speech capture system (MSCS), can potentially tackle these issues by providing an unobtrusive, low-cost, light weight (< 1 kg), and portable (20 × 20 × 10 cm3) multimodal data acquisition system coupled with a real-time visual feedback display.
This paper is aimed at introducing the MSCS as a proof-of-concept prototype by describing its system components and functionality, and by providing a preliminary assessment of localization accuracy. A human subject trial will validate its impact in reducing speech impediment, which is going to be the focus of a following publication. The rest this paper is organized as follows: Section II compares current systems to our proposed solution. Section III and IV provides a hardware and software overview of the MSCS prototype, respectively. Section V focuses on the assessment of the localization accuracy and demonstrates how the speech modalities can provide a meaningful representation of speech. Section VI compares MSCS to current EMA devices, followed by concluding remarks and future steps in section VII.
II. State-of-The-Art
The MSCS, shown in Fig. 1, captures tongue movements using a wireless approach derived from our earlier work on the Tongue Drive System (TDS) [14], [15]. A disk shaped magnetic tracer (dia = 3 mm, thickness = 1.5 mm) is attached near the tip of the tongue, ~1 cm from the tip, as shown in Fig. 1 inset. During tongue motion, the magnetic field fluctuations generated by the tracer are captured by an array of external 3-axial magnetometers and converted into a 5D vector (3D position + 2D orientation) by a localization algorithm. Additionally, a camera records video frames of lip gestures, which that are processed to extract the lip boundaries [16]. Finally, voice is acquired by a pair of bilateral microphones and displayed as a waveform.
Fig. 1.
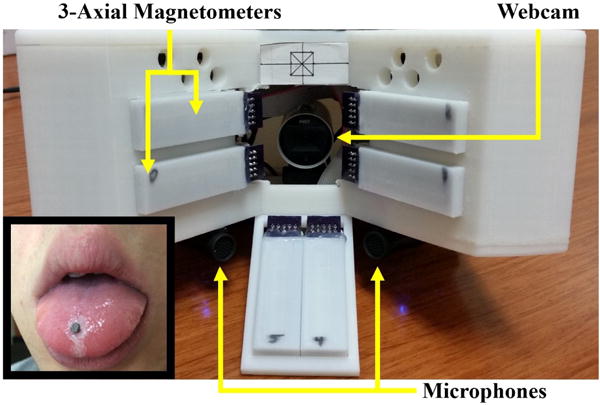
Front view of the multimodal speech capture system (MSCS) composed of twenty-four 3-axial magnetometers to capture 3D tongue motion, a webcam to capture lip gestures, and a pair of microphones for voice recording. Inset: A small magnetic tracer (∅3.18 mm × 1.6 mm) attached near the tip of a subject’s tongue with tissue adhesive.
Magnetic resonance imaging (MRI) systems can render 3D views of all articulators, including jaw and vocal cords, and can be considered among the least obtrusive solutions with no sensors is in contact with the patient body. Currently, the MSCS is unable to track jaw movements or vocal cords, and renders modest resolution of a single point on the tongue, plus imaging the lips. However, MRI is quite costly and only available in larger hospitals. It has also been found potentially harmful when patients are exposed to radiation for long and repeated sessions [17]. They are also bulky, time consuming, and quite complex, unlike MCSC that is cost-effective and designed to be easily portable, and virtually plug-and-play.
Ultrasound is used frequently in research settings since it is relatively affordable, less cumbersome, and easy to use. It is, however, incapable of capturing the movements of the apex, also referred to as the “tip” of the tongue, due to obstruction by the jaw and hyoid bone [18]. The tongue is of prime importance for speech [11] and its tracking was the main driver that led to development of the MSCS. Ultrasound does not render any images of the lip gestures either. Electropalatography (EPG) is used by some SLPs in their clinical practice, and considered relatively low cost. It is commercially available under brand names, such as SmartPalate (Complete-Speech, Orem, UT). EPG can detect multiple points on the tongue, but only positions that contact a sensing array mounted on the palate [19]. A major limitation of the EPG is that phonemes articulated without any tongue-palate contact cannot be tracked.
Electromagnetic articulography (EMA) captures movements of the tongue, lips, and jaw with sub-mm accuracy, and can track up to 24 points in real-time compared with only 1 point in the case of the MSCS. Commercially available EMA systems, such as the AG series (Carstens, Germany) [20] and Wave Speech Research System (NDI, Canada) [21], use large external transmitter coils that induce alternating currents in small wired sensing receiver coils. These wired sensors are attached to various locations of interest over the tongue and lips. A more detailed description of the underlying principles of EMA operation can be found in [20]. Although EMA is a popular articulator tracking solution in research, this technology is cost-prohibitive, cumbersome, and require a rather complex setup and operation [12]. Moreover, a key issue with practical use of EMA is that speech production is potentially hindered since multiple wired receiver coils are glued over the articulators [22]. In addition to being low-cost, portable and easy to use, the MSCS relies on a wireless tongue and lips tracking method, which reduces hindering of natural speech.
III. Hardware Overview
The MSCS in Fig. 1 is composed of an array of sensors, data processing algorithms, and a user interface. It can record, process, and display on-demand in real-time from four data sources: magnetic field generated by the magnetic tracer, position and orientation of the tracer, lips gestures, and voice audio. Fig. 2 shows a high-level block diagram of the system. The first part focuses on the hardware components that capture speech modalities. The second part describes the localization method to understand how the magnetic field recordings are translated into tracer’s position and orientation. Finally, the last part describes the software used during data collection sessions including its speech data processing modules and user interface.
Fig. 2.
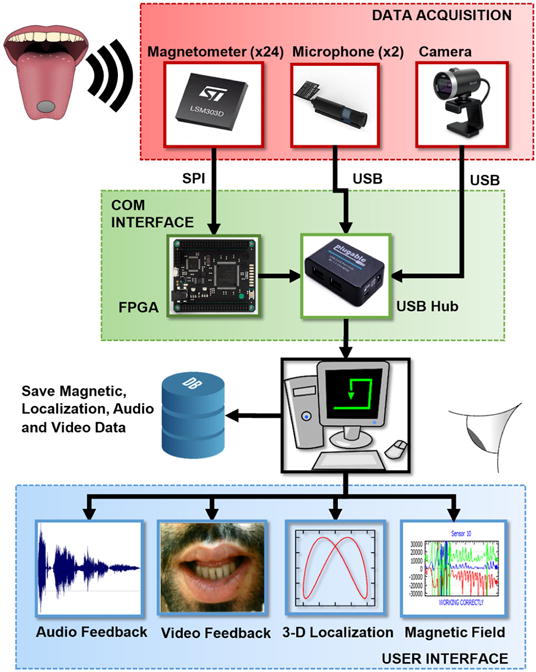
Block diagram of the MSCS, composed of a data acquisition module that captures raw data of three speech modalities (voice, lip gestures and tongue motion) and sends it to a PC via USB for storage and processing, to provide the user with a visual representation of speech.
A. Magnetic field acquisition
The changes in magnetic field induced by movements of the magnetic tracer (D21B-N52, K&J Magnetics) are measured by 24 LSM303D 3-axial magnetometers (STMicroelectronics) that are divided into six modules, each with 4 sensors. As shown in Fig. 1, these sensors are positioned near the user’s mouth such that three groups of 8 sensors are near the right cheek, left cheek, and under the chin. The magnetometers sample at a maximum rate of 100 Hz in a dynamic range that can be selected between ±2/4/8/12 gauss, which also set the sensitivity of the sensor. In the current prototype, dynamic range is set at ±4 gauss, resulting in a resolution of 122 μgauss.
All six magnetic sensor modules are connected via serial peripheral interface (SPI) to a field-programmable gate array (FPGA) (Spartan-6, Xilinx, San Jose, CA) embedded in a Mojo v3 board (Embedded Micro) [23] that also includes a USB interface to communicate with the PC. Fig. 3 shows a high-level block diagram of the FPGA module. The Communication Manager block initializes and manages the SPI communication with the magnetometers through the SPI Controller module to poll all 72 magnetic field values. After receiving the digital magnetic field values from all the magnetometers, the Communication Manager generates a data packet with a total size of 153 bytes, composed of 144 bytes of magnetic field values (2 bytes per axis, 3 axes per magnetometer), 1-byte packet counter (to verify if any packet loss has occurred), 4-byte header (to identify start of a new data packet), and 4-byte footer (to signal the end of data packet). The data packet is transmitted to the AVRI Controller block that delivers input packets to an Atmel AVR microcontroller (MCU) on the Mojo board, which transmits the packet to the PC through an enumerated virtual COM port over USB at 500,000 baud rate.
Fig. 3.
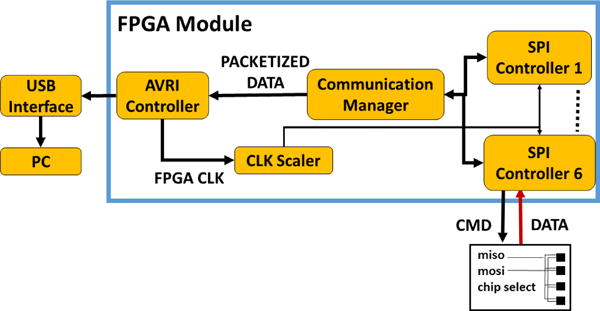
A high-level block diagram of the FPGA embedded in a Mojo board.
The decision to use an FPGA to collect magnetic data in a high throughput parallel fashion stems from the fact that the initialization and sampling time of all magnetometers need to be accurately controlled and their output data to be concurrently polled to have an instantaneous snapshot of the tracer magnetic field signature around the user’s mouth. This temporal accuracy, which is much higher than the sensors 100 Hz sampling rate results in better magnetic localization accuracy considering the necessary assumption to solve the nonlinear equation that governs a magnetic dipole (details in section IV.A).
B. Video acquisition
Lip gestures are recorded by a LifeCam Cinema webcam (Microsoft, Redmond, WA) facing the user’s lips at a rate of 30 frames/s at 1280 × 720 resolution. This webcam was selected due to its high resolution, low form factor, and autofocus capability on the user’s lips. It also has automatic ambient light and color correction and a wide-angle lens, which are appropriate with the user’s lips being very close to the lens, as can be seen in Fig. 8.
Fig. 8.

Example of voice activity detection on a speech waveform (normalized audio amplitude vs. time) with active speech delimited by the two vertical markers, and periods of silence outside these markers.
C. Audio acquisition
User voice is recorded by a pair of USB microphones (Mini Akiro, Kinobo) at an adjustable sampling rate of up to 96 kHz, which are symmetrically assembled under the magnetic sensor fixture to record stereo sound (see Fig. 1). The choice for this model was due to compatibility with Windows® as a plug-and-play USB device. Additionally, we have optional access to the webcam’s built-in microphone, which is further away from the user’s mouth, and can be used to capture the ambient noise to improve the overall voice recording quality.
IV. SOFTWARE OVERVIEW
Since data acquisition, processing, display, and saving must be performed in real-time, C++ programming language is utilized. QT framework (https://www.qt.io/) is used for its convenient UI designer and signal/slot mechanism to handle events, reducing development time and complexity. Moreover, OpenCV (http://opencv.org/) is intensively used for matrix operations, video image processing, and running optimization algorithms. The code is optimized for multi-core processing, rendering its execution more computationally efficient. The software is designed to be standalone and self-contained, such that it does not require any external components to be installed beside the Mojo board drivers. Here we explain the signal processing modules, followed by the UI.
A. Signal Processing
1) Tongue Tracking
Tongue tracking is achieved by our localization method that estimates the position (x, y, z) and orientation (θ, φ) of a magnetic dipole from its induced magnetic field. Although a brief description of this method can be found in [24]–[26], this section provides a more thorough explanation, specific to the MSCS application.
a) Mathematical Model
Fig. 4 shows the static magnetic flux density generated by a magnetic dipole and measured at the center of a magnetometer located at . The magnetic tracer, which can be considered a magnetic dipole point-source as long as its size is negligible compared to its distance from the sensors, is a cylinder with diameter d, thickness l, residual magnetic strength Br dipole moment , and location . The magnetic dipole equation relates these parameters [24],
| (1) |
where is the distance vector between the sensor and magnetic tracer. The dipole moment can be expressed in terms of its strength and direction,
| (2) |
where θ and φ are the zenith and azimuth angles of the dipole moment, respectively. Replacing in (1) with its definition in (2), the dipole equation can be rewritten as,
| (3) |
| (4) |
Fig. 4.
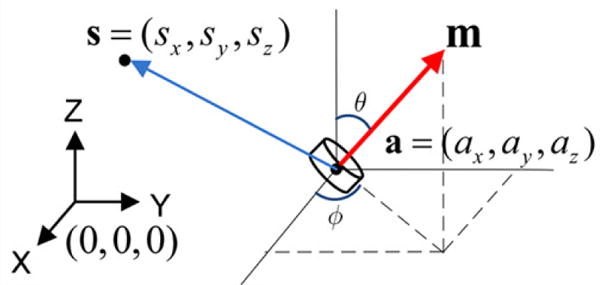
Illustration of key parameters of the source-point magnetic dipole model [24].
In order to estimate the magnetic tracer’s position (ax, ay, az) and orientation (θ, φ) in the system coordinates, one must solve the inverse problem of the nonlinear dipole equation in (3). BT in (4) can be calculated from the information provided by the manufacturer, K&J Magnetics in this case, such as d, l, and Br, which is the residual magnetic strength at the surface of the magnetic tracer. Moreover, , the position and orientation of each magnetometer in Fig. 1 is known a priori and does not change. Based on our previous work [24] and literature [27], one approach to solve the inverse problem is to use a numerical optimization method based on an error function. The objective is to estimate the magnetic tracer’s position and orientation (ax, ay, az, θ, φ) that minimize the error, E, between the calculated and measured magnetic fields at the position of every sensor. There is a multitude of mathematical optimization methods available, such as Particle Swarming Optimization (PSO), DIRECT, Powell, and Nelder-Mead [24]–[26]. We have used the latter as a suitable candidate with sufficient accuracy and reasonable computational load for our application,
| (5) |
| (6) |
| (7) |
where N is the number of magnetometers (24 in the current version), and are the measured and estimated magnetic field values at the ith magnetometer, respectively. Gi and Oi are the gain (3×3 diagonal matrix) and offset (1×3) of the ith magnetometer, respectively, and are required to ensure that every sensor provides the same measured outputs when exposed to the same magnetic field. Due to process variations during manufacturing and other soft-iron magnetic effects, it is imperative for all magnetic sensors to be carefully calibrated before being used for localization [24]. Gi also includes a coefficient that converts the sensor 16-bit digital output to gauss unit. Γi is a rotation matrix that rotates the magnetic field vector from the magnetometer’s coordinate reference to that of the system so it can be compared to the estimated magnetic field. The rotation is based on the Euler angles [α, β, γ] of the magnetometer, as described in [28].
EMFi is the earth’s magnetic field at the position of the ith magnetometer in the background and its mathematical model can be found in [29]. EMF has a slow time variation for a fixed position in the order of decades, and once the MSCS is setup and positioned near the user’s mouth, it is measured for 1 s and averaged for each axis of the magnetometer array. The averaged EMF values are used throughout the data collection session, but need to be updated every time the system is moved.
b) Magnetometer Calibration
Gain Gi and offset Oi are unique to each magnetometer and need to be derived from measurements to be used in (6) to convert the raw outputs from 3-axial magnetometers to consistent values in gauss that can be compared with theoretically estimated magnetic field from magnetic dipole model in (1). In addition, magnetometers’ position and orientation are slightly different for each device and need to be estimated with reasonable accuracy. This calibration is meant to estimate 12 parameters for each 3-axial magnetometer: 3 for gain, 3 for offset, 3 for position, and 3 for orientation. More details on magnetometer calibration can be found in [24], [27].
As described in [24], our calibration method relies on (5)–(7) with a couple of slight differences. First, the position and orientation of the magnetic tracer is known during calibration, and accurately set by a Cartesian robotic arm. Second, the error function is defined for each magnetometer and optimized over the measurement samples,
| (8) |
where P is the number of sample points taken along the robotic arm trajectory and i is the magnetometer’s index (1:24). Note that the inputs to and are parameters that the calibration algorithm is meant to generate by finding their optimal values, which result in the lowest error Ei.
c) Magnet Localization
As shown in Fig. 5, tongue tracking is performed through a 3-step process: 1) Identifying a data packet from the incoming data stream, sent by the Mojo board, and reconstitute each of the 72 magnetic field axes raw data value. To identify a complete data packet, the FPGA Communication Manager block adds a 4-byte header and a 4-byte footer to the actual payload. To reconstitute each axis, 2 consecutive bytes are concatenated and forms the magnetic field digital output measured at that axis of a magnetometer. These values can be displayed on-demand and in real-time, as shown in Fig. 6. The Asio module of Boost library is used to read data from the Mojo board through a serial COM port. 2) Computing the measured magnetic fields as formulated in (6). 3) Estimating the position and orientation (state) of the tracer using the magnetic localization algorithm, which is performed in real-time by completing the data processing of each packet before a new magnetic sample is received. On a laptop with an Intel i7-4500U CPU (2 cores, 4 threads, 2.4 GHz) and 4 GB of RAM, the localization was performed in 4 ms per sample on an average, which is lower than the 10 ms sampling period.
Fig. 5.
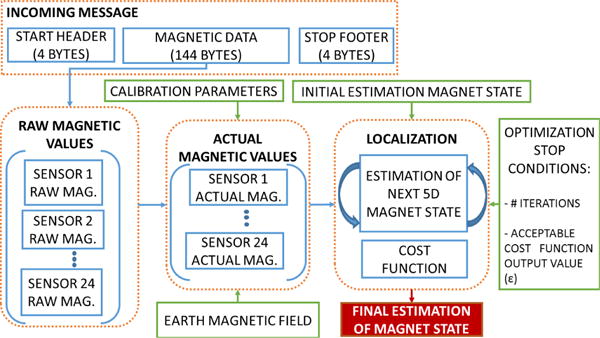
Data flow of the tongue tracking algorithm with a 72D data packet of magnetic field values from 24 magnetometers as input and an estimation of the 3D position and 2D orientation of the tracer as output.
Fig. 6.
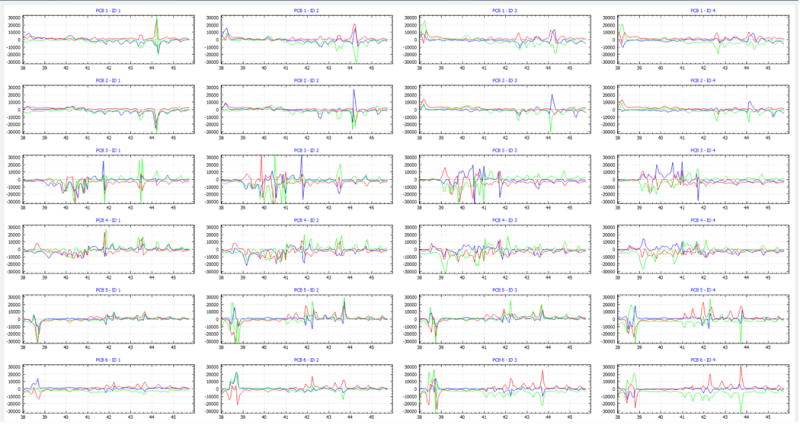
A screenshot of the raw output data of the 24 three-axial magnetometers used in the current MSCS prototype. Each graph shows the digital values of the X-, Y-, and Z-axis in blue, red, and green colors, respectively. The horizontal axis is in seconds.
In a desktop machine with AMD FX-8320E (8 cores, 3.2 GHz) with 16 GB of RAM, the localization execution time was further reduced to 1.5 ms per sample, on average.
2) Video Processing
The video frames are captured at 30 frame/s with HD resolution (1280×720 pixels). The frames are displayed in a real-time video feed in the UI (see Fig. 9) and saved in an AVI file during data recording. In addition, the video frames are processed in real-time to extract and display the lips boundary. As shown in Fig. 7, the lips boundary extraction algorithm creates a grey-level image from the raw color frame in which the red pixels are intensified and set to the highest values of the greyscale. Otsu’s grey histogram method is applied to find the optimal threshold that would separate the background with lower grey values from the foreground pixels to generate a binary (black and white) image [30]. Filtering of the binary image is carried out to remove (blacken) white pixels that are not part of the lips area, which is the largest connected component cluster of white pixels. The resulting binary image is fed into an edge detector algorithm that finds the coordinates of the lips boundary by locating the transitions in pixel values from black (0) to white (1), which is representative of the upper lip, and white to black for the lower lip. Finally, a visible light green boundary is generated from the lips boundary coordinates and overlaid on top of the original RGB image.
Fig. 9.
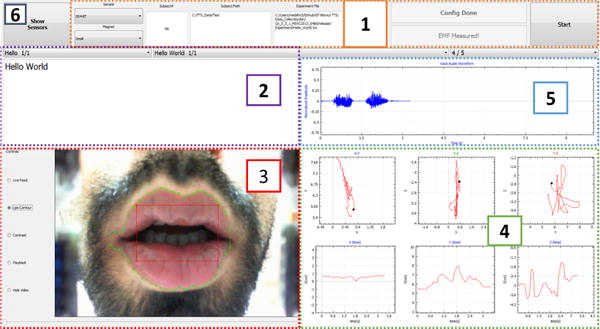
A sample screenshot of the user interface of the current MSCS prototyping, showing visual representations of key speech modalities: (1) configuration parameters, (2) utterance, (3) lips gesture superimposed with lips boundary, (4) tongue motion, and (5) voice signal waveform.
Fig. 7.
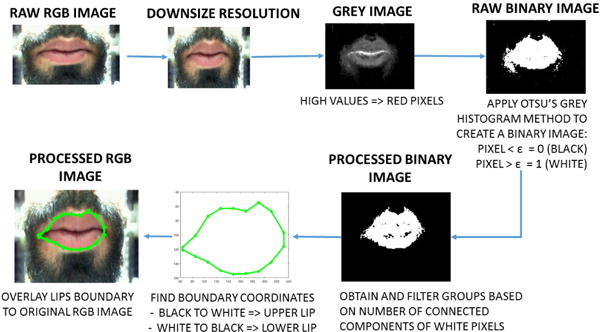
Data flow of the video processing algorithm that identifies and superimposes lips boundary.
3) Audio Processing
Voice is recorded from the stereo microphones, saved into a WAV file, and displayed in real-time as a waveform in the UI (see Fig. 9). Also a voice spectrogram can be constructed and added to the UI, as a future on-demand feature of the software (see Fig. 15). Voice data is also used in a voice activity detection (VAD) algorithm that identifies the duration of active speech. This information will be used in our future work on developing pattern matching algorithms that compare impaired speech from patients to that of a reference healthy speaker. An illustration of active speech recognition using the VAD algorithm is depicted in Fig. 8.
Fig. 15.
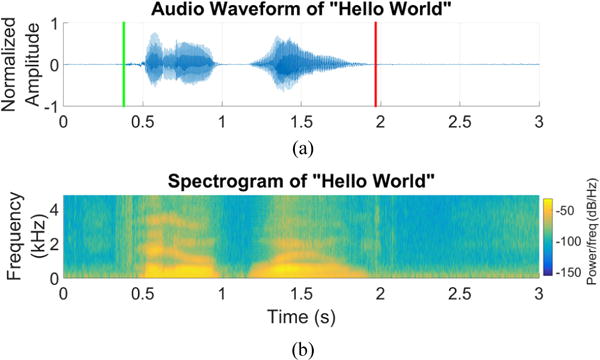
(a) Audio waveform of “Hello World” with speech detection to indicate the beginning (green flag) and end (red flag) of the utterance. (b) Synchronous spectrogram of the “Hello World” audio signal.
B. User Interface
The current version of the UI in Fig. 9 contains the session configuration parameters, list of words to be spoken by the user, and visualization of various speech modalities. The main UI is composed of six parts:
1) Configuration parameters must be set before starting data collection
Serial Number
Each MSCS device has unique calibration parameters for each of its magnetometers. These parameters are loaded by the software during initialization to ensure proper localization of the magnetic tracer.
Magnetic Tracer Specification
According to (4), the magnetic tracer dimensions and residual magnetic field need to be selected based on the type/size of magnet being used.
Subject Path
Data from all modalities are saved into files, which root folder is specified in the subject path. The magnetic and localization data are saved as comma-separated value files (.csv), the voice as a waveform audio file (.wav) and video frames in a video container file (.avi). These formats can be read by most multimedia readers and editors in Windows® operating system.
Subject Number
The unique identifier of each user.
Earth’s Magnetic Field
Earth’s Magnetic Field is measured for each axis of the magnetometer array with no magnetic tracer in their vicinity for 1 s. An average is computed on 100 measurements and saved for later use in the localization algorithm.
2) List of Words
This text box displays the words and sentences to be spoken by the MSCS user. The breakdown of the utterance list is as follows: Category (e.g., objects, months, colors, questions, etc.) to provide a context, the actual utterance, and the required number of repetitions. The “Start” button begins recording of all modalities for the current utterance. This button changes to “Stop” and can be clicked again to stop recording. The category, utterance, and trial lists will be automatically updated to the next state. However, at any point during the session, the operator can go back to a previous utterance, category, or trial and ask the user to repeat, and record it again.
3) Video Feedback
Video Feedback has five modes of operation. Live Feed mode displays the raw frames captured from the camera. A centered red box provides a visual cue to ensure that the user’s head and his/her lips are properly positioned in front of the camera. Hide Video mode hides this video feed in case it is distracting to the user and/or operator. Though, video data continues to be recorded. Lip Contour mode enables the lips boundary to be displayed over the raw RGB image, and Contrast mode shows the processed binary image, as shown in Fig. 7. Playback mode allows the user or operator to replay the last recorded video by selecting a frame via a slider.
4) Tongue Tracking
Tongue Tracking 3D trajectory of the magnetic tracer is displayed in real-time and broken down into 6 graphs: the top graphs show the tracer’s trajectory in transverse X-Y, coronal X-Z, and sagittal Y-Z planes, while the bottom graphs show the dynamic movement of the tracer along X, Y, and Z axes vs. time. These spatiotemporal representations provide the SLP with valuable information about quality of speech and possible impairments both in terms of tongue placement (upper row) and tongue timing (lower row).
5) Audio Feedback
Voice is represented in real-time as an audio waveform. Amplitude of the audio data is normalized between −1 and +1 and it is down-sampled by a factor of 10 to reduce unnecessary consumption of resources by the underlying plotting mechanism.
6) Magnetometer Feedback
To ensure the computer is properly receiving the raw magnetic field values, all magnetometers are displayed on-demand in a separate window, shown in Fig. 6, which is opened by clicking on the “Show Sensors” button on the upper left corner of the UI. The verification is done by waving the tracer close to each magnetometer (~ 1 cm), and observing the resulting large change in the magnetic field recorded by that magnetometer. A faulty magnetometer does not react to this test and may need to be replaced. If no change occurs in any magnetometers, data communication between the PC and Mojo board could be at fault, and perhaps the MSCS or PC needs to be reset.
V. Measurement Results
The first part of this section shows the accuracy of the magnetic tracking mechanism vs. a known reference trajectory. In the second part, the performance of tongue tracking modality in the current prototype is demonstrated with the sample phrase “Hello World” as a real-time MSCS visual feedback.
A. Magnetic Tracking Accuracy
Magnetic tracking accuracy is defined as the root-mean-square error (RMSE) distance between the actual and estimated position of the magnetic tracer,
| (9) |
where P is the number of sample positions in the trajectory, and and are the estimated and actual positions of the magnetic tracer, respectively. Although the tracer’s zenith angle can be manually changed, the robotic arm that sets the tracer’s spatial position does not have angular position control capability. Hence, the accuracy in tracking the orientation of the tracer is not assessed in this paper. Below is a description of the two-step calibration and localization algorithm:
1) System calibration with a reference trajectory
As mentioned in section II, before any localization can be performed, magnetometers must be calibrated. A magnetic tracer was attached to a Plexiglas pole and moved by the Cartesian robotic arm, which has a 3.6 μm spatial resolution, and followed the reference 3-D trajectory shown in Fig. 10a. The tracer is placed with its north pole facing up, which also fixes its zenith and azimuth angles to 0°. This trajectory was selected to uniformly cover a 3×3×3 cm3 cube, similar to the intraoral space where the tracer near the tip of the tongue moves, which is the region of interest (RoI) for this application. Simultaneously, the magnetic field at stationary positions of all magnetometers are measured and recorded at ~23,000 data points along the trajectory, and used as input to the optimization algorithm that generates the sensor calibration parameters: gain, offset, position, and orientation of each magnetometer [24].
Fig. 10.
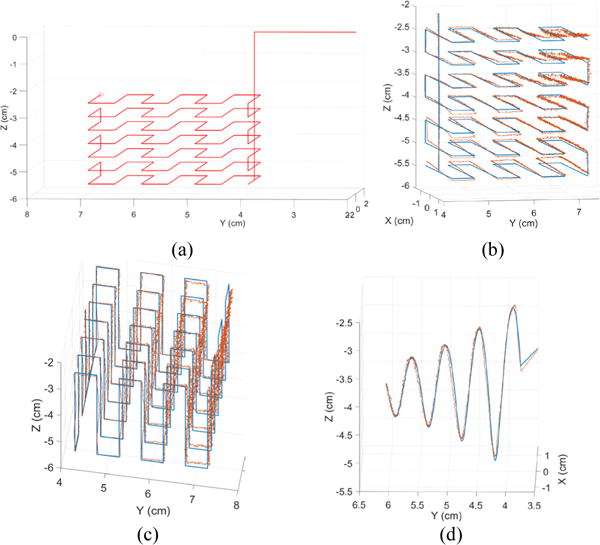
Target (red) and estimated (blue) 3D trajectories traversed by a magnetic tracer attached to a Cartesian robot. The calibration was performed on a reference trajectory (a) homogeneously sweeping a 3×3×3 cm3 cube with (b) overlapping estimated trajectories to visualize the localization error. A validation of the localization accuracy was carried out in (c) a trajectory traversing the same volume but through different points and (d) a twisting trajectory.
2) Magnetic tracer localization
Three trajectories in Figs. 10b–10d were used to test the tracer localization. The first trajectory is the same as the one used for calibration but the second one is designed to cover the same volume in a different way, i.e. side-to-side instead of bottom-up, thus moving through different points. The third test trajectory is twisted and curled to more closely emulate the natural tongue movements during speech.
The localization accuracy was assessed at multiple manually adjusted zenith angles (0°, 45°, 135°, 225°, 315°) as they are representative of the natural tongue rotations during speech. The azimuth angle could not be varied due to the robotic arm setup that only allows rotation of the tracer around the zenith angle. An improved test setup with more degrees of freedom can further improve the tracer’s localization accuracy particularly during calibration. Yaw rotation is, however, unnecessary because the tracer is cylindrical. Table I shows the results of localization accuracy measurements. It can be seen that the tracking performance is best, with sub-mm RMSE, when the tracer zenith angle is set to 0°, which is expected because the calibration parameters where derived only at that same angle. This angle was chosen because the tongue mostly remains close to that orientation during speech. The localization error for the current setup is comparable to the commercial tools [20], [21]. The accuracy is expected to worsen for different angles as well as a non-stationary setup due to EMF variations. The tracking error can be further lowered by improving the optimization algorithm as Nelder-Mead is sensitive to local minima and does not always converge to the global minimum of the error function. Also the manual alignments of the robotic arm and the tracer orientation might be responsible for part of the measured error, as they lead to different tracer position and orientation in the mathematical coordination references of the MSCS and robotic arm. Thus a better alignment procedure would be needed for reducing these external errors.
Table I.
Localization RMSE and (Max) Error in Position
| θ° | 0° | 45° | 135° | 225° | 315° |
|---|---|---|---|---|---|
| Fig. 10b | 0.71 (2.3) |
1.47 (6.4) |
2.53 (8.1) |
2.53 (6.3) |
2.28 (7.2) |
|
|
|||||
| Fig. 10c | 0.73 (2.4) |
1.42 (5.3) |
2.12 (7.1) |
1.91 (5.6) |
2.22 (6.4) |
|
|
|||||
| Fig. 10d | 0.44 (1.2) |
2.02 (6.6) |
2.85 (7.7) |
2.25 (7.1) |
2.95 (7.1) |
All values are in mm and degrees.
B. Multimodal speech display
In addition to capturing various speech modalities, the UI is also capable of displaying various representations of those modalities, namely the tongue movement, lips gestures, and voice, either in raw or augmented format in real-time. These visualizations are designed to assist the SLPs and their clients to better analyze the key articulators’ kinematics, identify possible impairments, and aim to improve speech production with the help of real-time or offline audiovisual feedback. The evaluation and analysis of what type of visual feedback has the most positive impact on users’ rehabilitation or learning outcome is out of the scope of this article. Instead we focus on illustrating the potential capabilities of the MSCS by displaying simple visualizations of speech modalities that we have already implemented, with one of the co-authors as the subject.
The utterance “Hello World” was collected from a 28 year old healthy male subject of French background with no history of speech disorders. A breakdown of each visual feedback is provided along with a high-level analysis. Fig. 11 shows a top view of the setup during data collection, in which the participant seats stationary with his mouth in front of the webcam and magnetic sensors near his cheeks and under his chin. A 23″ monitor is also placed about 1 m in front of the subject, presenting the UI and associated feedback, shown in Fig. 9. Unlike EMA, there is no electrical or mechanical contact with user’s face or articulators other than the small free-floating magnetic tracer glued on the desired spot on the user’s tongue using tissue adhesive.
Fig. 11.
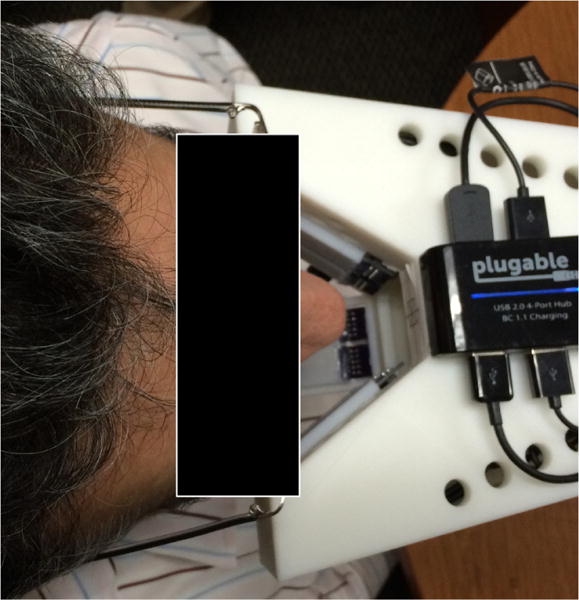
Top view of the MSCS experiment setup with a subject seating stationary with his mouth in front of the webcam/microphones, and magnetic sensors near the cheeks and under the chin. A 23″ monitor, located ~1 m in front of the subject (not shown) presents the UI feedback shown in Fig. 9.
The tongue trajectories in the sagittal (Y–Z) plane for three utterances of the “Hello World” is depicted in Fig. 12. Potential explanations for differences in tongue trajectories could be related to co-articulatory effects where sounds are not necessarily produced, and/or sensitivity to lips and/or jaw movements rather than tongue alone (e.g./O/). However, key parts of tongue trajectories, related to phonemes sensitive to tongue motion, seem to be similar such as “/L/” in which the tongue touches the palate with high values along the Z axis.
Fig. 12.
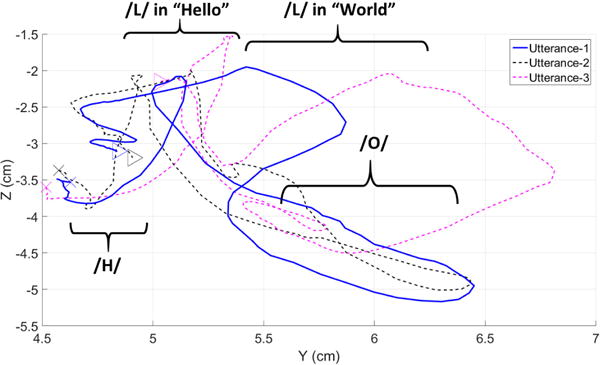
Tongue trajectory of three repetitions of “Hello World” in the sagittal (Y-Z) plane. The cross and triangle symbols indicate the beginning and ending positions of the magnetic tracer, respectively, as identified by the voice input from the microphones.
Fig. 13 illustrates a list of common lips gestures, also known as visemes, for various phonemes in English language [31]. Fig. 14 shows a selected subset of video frames, overlaid with lips boundary real-time output (green polygon) of the video processing algorithm, which can be mapped onto one of their representative visemes in Fig. 13. For instance, phoneme “/O/” is recognizable by the lips forming a round shape, phoneme “/L/” by the extension of the lips corners, and phoneme “/W/” by forward extension and smaller aperture.
Fig. 13.
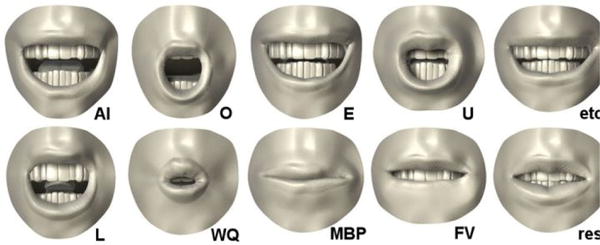
A list of common visemes or lips gestures for various phonemes [31].
Fig. 14.
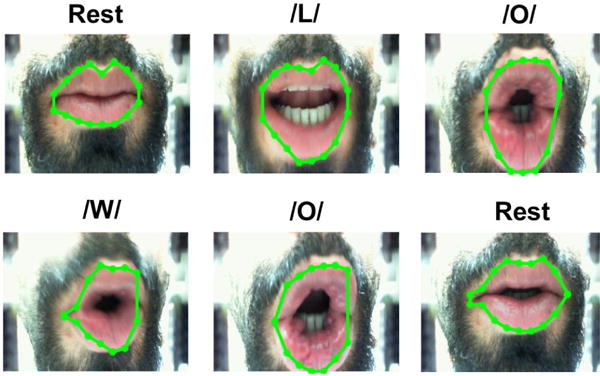
Selected video frames in the utterance of “Hello World,” overlaid with real-time lip boundary output of video processing algorithm.
Fig. 15a shows the audio waveform for “Hello World,” sampled at 44 kHz. The speech processing algorithm in this case has detected the beginning and end of the utterance and marked them with the green and red flags, respectively. This information is very helpful in determining the synchronous start and end points of the tongue trajectory for segmentation of each particular word or phoneme, as shown in Fig. 12. Fig. 15b shows the synchronous spectrogram of the “Hello World” audio signal, which contains additional useful information to be used by the audio processing algorithm.
VI. Discussion
Published results of tracking errors in the commercial systems, such as AG500 series (Carstens, Germany) [20] and Wave Speech Research System (NDI, Canada) [21] are in the order of ~0.5 mm, which are smaller than our current magnetic tracking algorithm in Table 1. On the other hand, the MSCS is completely unobtrusive, and relies on a wireless and non-contact approach. Moreover, there are numerous methods that can help in improving the tracking accuracy, such as optimizing the geometrical arrangement of the magnetometers around the user’s mouth for optimal tracking accuracy. Also, the intrinsic gain of the magnetometers can be changed to amplify weaker magnetic fields when the tracer is far from the sensor and also prevent sensor saturation when the trace is too close.
Multimodal capture of various speech modalities and their associated visual feedback provides a convenient means for SLPs for identifying speech impediments during therapy sessions and discussing them with their patients. They also enable SLPs to more accurately analyze articulator movements at a later time, as well as track, quantify, and document progress (or lack thereof) over time to choose optimal rehabilitation strategies. MSCS captures various modalities together to allow more thorough expert analysis of speech as well as automated assessment algorithms, to be developed in the future. For instance, pattern matching algorithms can compare lip gestures, tongue trajectories, and voice of a user against a reference and provide quantitative and objective feedback on speech performance, which could greatly impact the way motor speech treatment is conducted in the field of speech therapy.
There are also limitations in the current MSCS technology. First, only one desired location on the tongue can be tracked at a time because the complexity of the nonlinear magnetic localization, described in section II.B, increases exponentially with the number of magnetic dipoles in the space. This may not be sufficient for accurate representation of the complete tongue surface movement with its complex twists and curls during speech. However, it is shown that useful speech information from the tongue can be found at its tip and blade [5]. Second, the localization algorithm can only track the position and orientation of the small tracer in a fairly limited volume, in the order of 3–5 cm on the side. Even though it is possible to expand this volume by using a larger, and therefore stronger, magnetic tracer, it might compromise the user comfort level or even affect pronunciation of certain phonemes. The current system is believed to covers a volume that is large enough for tracking tongue movements within the oral cavity. Finally, although MSCS relies on an unobtrusive and wireless approach to track tongue motion, articulation might be hindered due to attachment of the magnetic tracer on the tongue, which is an external object. This issue will depend on the size of the magnetic tracer and should be qualitatively investigated in the future by analyzing participant’s feedback in pilot studies and quantitatively by evaluating sound distortion of voicing on participants that would speak with and without a magnetic tracer glued near the tip of their tongue with a similar method described in [32].
VII. Conclusions
The MSCS is a portable, unobtrusive, cost effective, plug-and-play, and easy to setup and use system developed to assist speech and language pathology and learning by synchronously capturing various speech modalities and using them to provide visual feedback on tongue movements, lips gestures, and voice. The tongue movements are remotely and wirelessly tracked using 24 three-axial magnetometers localizing the 3D position and 2D orientation of a small magnetic tracer attached near the tip of the tongue. Calibration of the magnetometers is necessary, only once, to produce accurate results. Localization accuracy will be improved in future work by adding high precision rotation capability to the current Cartesian robot to account for tracer’s angular motion during calibration. Also, a reference magnetometer will be added, far from the magnetic tracer, to continuously collect the ambient EMF in order to reduce localization accuracy drops when the device position or orientation accidentally changes during data acquisition. Moreover, a wearable headset version of the MSCS is in development to enable users to naturally and comfortably move their heads while speaking since it is somewhat inconvenient to restrict head movements and body posture during longer therapy sessions.
The current practice and speech assessments, performed by SLPs, judging speech execution via direct observation and audio recording, is rather subjective and not quite repeatable. The MSCS collects a rich and comprehensive dataset from key articulators and provides insight into patients’ speech in the form of visual feedback that enables SLPs and their client to visualize, analyze, and potentially correct motor speech impairments. While a manual analysis of the feedback is currently necessary, the long term objective is to provide quantitative, reliable, and reproducible assessment of speech by advanced automated pattern recognition algorithms, which can compare lip gestures, tongue trajectories, and voice of a user against a reference (without speech impediments). As a result, the objective assessment could greatly impact the way motor speech treatment is conducted in the field of speech therapy, and can also be used by second language learners to correct their accent by comparing their articulators’ movements to that of an instructor or native speaker.
Acknowledgments
The authors would like to acknowledge contributions by Shurjo Banerjee, Justin Eng, Nischal Prasad, and Amir Khan for their work on early prototypes.
This research was supported in part by the National Institute of Biomedical Imaging and Bioengineering grant 1R21EB018764 and the National Science Foundation Division of Information and Intelligent Systems grant IIS-1449266.
Contributor Information
Nordine Sebkhi, GT-Bionics lab, School of Electrical and Computer Engineering, Georgia Institute of Technology, Atlanta, GA 30308, USA.
Dhyey Desai, GT-Bionics lab, School of Electrical and Computer Engineering, Georgia Institute of Technology, Atlanta, GA 30308, USA.
Mohammad Islam, GT-Bionics lab, School of Electrical and Computer Engineering, Georgia Institute of Technology, Atlanta, GA 30308, USA.
Jun Lu, GT-Bionics lab, currently is with the School of Automation at Guangdong University of Technology, Guangzhou, GD, 510006, China.
Kimberly Wilson, Department of Clinical and Professional Studies, University of West Georgia, Carrollton, GA.
Maysam Ghovanloo, GT-Bionics lab, School of Electrical and Computer Engineering, Georgia Institute of Technology, Atlanta, GA 30308, USA.
References
- 1.Kent RD. Research on speech motor control and its disorders: A review and prospective. J Communication Disorders. 2000 Sep;33(5):391–428. doi: 10.1016/s0021-9924(00)00023-x. [DOI] [PubMed] [Google Scholar]
- 2.Maas E, Robin DA, Hula SNA, Freedman S, Wulf G, Ballard K, Schmidt R. Principles of motor learning in treatment of motor speech disorders. Am J Speech-Language Pathology. 2008 Aug;17(3):277–298. doi: 10.1044/1058-0360(2008/025). [DOI] [PubMed] [Google Scholar]
- 3.American Speech-Language-Hearing Association (ASHA) Apraxia of Speech in Adults. [Online] Available: http://www.asha.org/public/speech/disorders/ApraxiaAdults/
- 4.American Speech-Language-Hearing Association (ASHA) Dysarthria. [Online] Available: http://www.asha.org/public/speech/disorders/dysarthria/
- 5.Wang J, Samal A, Rong P, Green JR. An optimal set of flesh points on tongue and lips for speech-movement classification. J Speech, Language, and Hearing Research. 2016 Feb;59:15–26. doi: 10.1044/2015_JSLHR-S-14-0112. [DOI] [PMC free article] [PubMed] [Google Scholar]
- 6.Duffy JR. Motor speech disorders: Substrates, differential diagnosis, and management. 3rd. St Louis, MO: Elsevier Mosby; 2013. [Google Scholar]
- 7.National Institute on Deafness and Other Communication Disorders. Percentage of Children Ages 3–17 with a Communication or Swallowing Disorder During the Past 12 Months. NIH; 2012. [Online]. Available: http://www.nidcd.nih.gov/health/statistics/vsl/Pages/communication-disorders.aspx. [Google Scholar]
- 8.Walshe M, Miller N, Leahy M, Murray A. Intelligibility of dysarthric speech: perceptions of speakers and listeners. Int J Language and Communication Disorders. 2008 Dec;43(6):633–648. doi: 10.1080/13682820801887117. [DOI] [PubMed] [Google Scholar]
- 9.Suhail IS, Kazi RA, Jagade M. Perceptual evaluation of tracheoesophageal speech: Is it a reliable tool? Indian J Cancer. 2016 Apr;53:127–131. doi: 10.4103/0019-509X.180814. [DOI] [PubMed] [Google Scholar]
- 10.McHenry MA. An exploration of listener variability in intelligibility judgments. American Journal of Speech-Language Pathology. 2011 May;20:119–123. doi: 10.1044/1058-0360(2010/10-0059). [DOI] [PubMed] [Google Scholar]
- 11.Cleland J, McCron C, Scobbie JK. Tongue reading: Comparing the interpretation of visual information from inside the mouth, from electropalatographic and ultrasound displays of speech sounds. Clinical Linguistics and Phonetics. 2013 Apr;27(4):299–311. doi: 10.3109/02699206.2012.759626. [DOI] [PubMed] [Google Scholar]
- 12.Katz WF, McNeil MR. Studies of articulatory feedback treatment for apraxia of speech based on Electromagnetic Articulography. Perspectives on Neurophysiology and Neurogenic Speech and Language Disorders. 2010 Oct;20(3):73–80. [Google Scholar]
- 13.Katz WF, Mehta S. Visual feedback of tongue movement for novel speech sound learning. Frontiers in Human Neuroscience. 2015 Nov;9(612) doi: 10.3389/fnhum.2015.00612. [DOI] [PMC free article] [PubMed] [Google Scholar]
- 14.Kim J, Park H, Bruce J, Rowles D, Holbrook J, Nardone B, West D, Laumann A, Roth E, Veledar E, Ghovanloo M. Qualitative assessment of tongue drive system by people with high-level spinal cord injury. J Rehabilitation Research and Development. 2014 Aug;51(3):451–466. doi: 10.1682/JRRD.2013.08.0178. [DOI] [PMC free article] [PubMed] [Google Scholar]
- 15.Yousefi B, Huo X, Kim J, Veledar E, Ghovanloo M. Quantitative and comparative assessment of learning in a tongue-operated computer input device–part II: navigation tasks. IEEE Trans Information Technology in Biomedicine. 2012 Jul;16(4):633–643. doi: 10.1109/TITB.2012.2191793. [DOI] [PMC free article] [PubMed] [Google Scholar]
- 16.Agarwal S, Mukherjee DP. Computer Vision, Pattern Recognition, Image Processing and Graphics. Jodhpur: Dec, 2013. Lip tracking under varying expressions utilizing domain knowledge. [Google Scholar]
- 17.Hartwig V, Giovanetti G, Vanello N, Lombardi M, Landini L, Simi S. Biological effects and safety in magnetic resonance imaging: A Review. Intl J Environmental Research and Public Health. 2009 Jun;6(6):778–798. doi: 10.3390/ijerph6061778. [DOI] [PMC free article] [PubMed] [Google Scholar]
- 18.Grimaldi M, Fivela BG, Sigona F, Tavella M, Fitzpatrick P, Craighero L, Fadiga L, Sandini G, Metta G. New technologies for simultaneous acquisition of speech articulatory data: 3D articulograph, ultrasound and electroglottograph. Proc LangTech. 2008 Jan;:1–5. [Google Scholar]
- 19.Hassan ZM, Heselwood B. Instrumental Studies in Arabic Phonetics. Philadelphia: John Benjamins; 2011. Appendix; p. 356. [Google Scholar]
- 20.Yunusova Y, Green JR, Mefferd A. Accuracy assessment for AG500, Electromagnetic Articulograph. J Speech, Language, and Hearing Research. 2009 Apr;:547–555. doi: 10.1044/1092-4388(2008/07-0218). [DOI] [PMC free article] [PubMed] [Google Scholar]
- 21.Berry J. Accuracy of the NDI Wave Speech Research System. J Speech, Language, and Hearing Res. 2011 Oct;54:1295–1301. doi: 10.1044/1092-4388(2011/10-0226). [DOI] [PubMed] [Google Scholar]
- 22.Katz WF, Bharadwaj SV, Stettler MP. Influences of Electromagnetic Articulography sensors on speech produced by healthy adults and individuals with aphasia and apraxia. J Speech, Language, and Hearing Research. 2006 Jun;49(3):645–659. doi: 10.1044/1092-4388(2006/047). [DOI] [PubMed] [Google Scholar]
- 23.Mojo V3. Embedded Micro; [Online] Available: https://embeddedmicro.com/mojo-v3.html. [Google Scholar]
- 24.Farajidavar A, Block JM, Ghovanloo M. A comprehensive method for magnetic sensor calibration: a precise system for 3-d tracking of the tongue movements. Proc 34th IEEE Eng in Med Biol Conf. 2012 Aug; doi: 10.1109/EMBC.2012.6346140. [DOI] [PMC free article] [PubMed] [Google Scholar]
- 25.Cheng C, Huo X, Ghovanloo M. Towards a magnetic localization system for 3-d tracking of tongue movements in speech-language therapy. Proc IEEE 31st Annual Intl Conf Eng Med Biol Society (EMBC) 2009 Sep 3–6;:563–566. doi: 10.1109/IEMBS.2009.5334058. [DOI] [PMC free article] [PubMed] [Google Scholar]
- 26.Wang J, Huo X, Ghovanloo M. Tracking Tongue movements for environment control using particle swarm optimization. Proc IEEE Intl Symp on Circuits and Systems. 2008 May 18–21;:1982–1985. [Google Scholar]
- 27.Hu C, Li M, Song S, Yang W, Zhang R, Meng MQ-H. A cubic 3-axis magnetic sensor array for wirelessly tracking magnet position and orientation. IEEE Sensors J. 2010 Apr;10(5):903–913. [Google Scholar]
- 28.Varshalovich DA, Moskalev AN, Khersonskii VK. Description of rotation in terms of the euler angles. Quantum Theory of Angular Momentum, Ed Singapore: World Scientific. 1988:21–23. ch. 1.4.1. [Google Scholar]
- 29.International Association of Geomagnetism and Aeronomy. International geomagnetic reference field: the eleventh generation. Geophysical Journal International. 2010 Oct;(183):1216–1230. [Google Scholar]
- 30.Otsu N. A Threshold Selection Method from Gray-Level Histograms. IEEE Trans Systems, Man, Cybernetics. 1979 Jan;9(1):62–66. [Google Scholar]
- 31.Phonemes, phones, graphemes and visemes. [Online]. Available: http://www.web3.lu/phonemes-phones-graphemes-visemes/
- 32.Meenakshi N, Yarra C, Yamini BK, Ghosh P. Comparison of speech quality with and without sensors in electromagnetic articulograph AG 501 recording. Interspeech. 2014 Sep;:935–939. [Google Scholar]


