Abstract
Background
Suboptimal temporal sampling of left ventricular (LV) blood pool and tissue time activity curves (TACs) may introduce bias and increased variability in estimates of myocardial blood flow (MBF) and flow reserve (MFR) from dynamic PET myocardial perfusion images. We aimed to optimize temporal sampling for estimation of MBF and MFR.
Methods
24 normal volunteers and 32 patients underwent dynamic stress/rest rubidium-82 chloride (82Rb) PET imaging. Fine temporal sampling was used to estimate the full-width at half maximum (FWHM) of the LV blood pool TAC. Fourier analysis was used to determine the longest sampling interval, TS, as a function of FWHM, which preserved the information content of the blood phase. Dynamic datasets were reconstructed with frame durations varying from 2 to 20 seconds over the first two minutes for the blood phase and 30 to 120 seconds for the tissue phase. The LV blood pool and tissue TACs were sampled using regions of interest (ROI) and fit to a compartment model for quantification of MBF and MFR. The effects of temporal sampling on MBF and MFR were evaluated using clinical data and simulations.
Results
TS increased linearly with input function FWHM (R=0.93). Increasing the blood phase frame duration from 5 to 15 seconds resulted in MBF and MFR biases of 6–12% and increased variability of 14–24%. Frame durations <5 seconds had biases of less than 5% for both MBF and MFR values. Increasing the tissue phase frame durations from 30 to 120 seconds resulted in <5% biases.
Conclusions
A two-phase framing of dynamic 82Rb PET images with frame durations of 5 seconds (blood phase) and 120 seconds (tissue phase) optimally samples the blood pool TAC for modern 3D PET systems.
Keywords: Myocardial perfusion imaging: PET, Myocardial blood flow, Myocardial flow reserve, Rubidium-82, Temporal sampling
Introduction
Measurement of myocardial blood flow (MBF) and myocardial flow reserve (MFR) from dynamic rubidium-82 chloride (82Rb) PET offer incremental prognostic1,2 and diagnostic value3,4 over conventional relative perfusion imaging. The short 75 second half life of 82Rb mandates careful optimization of tracer dose as well as infusion and imaging protocols in order to balance limitations of PET scanner sensitivity (which favor larger infused doses to preserve image quality of delayed images for visual interpretation) and maximum count rate capabilities due to dead time losses (which favor smaller infused doses for more accurate quantification of the arterial input function). These factors, along with the type of infusion system utilized affect the measurement of the left ventricle (LV) blood pool and tissue time activity curves (TAC). Dynamic image series, used to compute TACs, are reconstructed in discrete time bins, typically ranging from ~5 seconds to several minutes or more. While shorter time bins will increase temporal resolution, shorter time bins also result in decreased image quality due to lower total counts per image and increased reconstruction time and storage requirements for reconstructed images. Insufficient temporal resolution results in under-sampling of the LV blood pool TAC (“input function”) and may produce biased estimates of MBF and MFR and increase variability.
Prior studies have evaluated the effects of the shape of the input function and temporal sampling on the accuracy and precision of the K1 uptake parameter using simulations.5,6 These analyses demonstrated that input functions with narrower width have more high temporal frequency information and therefore require shorter frame durations for accurate measurement.4 However, these studies did not evaluate input functions with widths and shapes typically seen with modern 82Rb infusion systems beyond simulations nor did they account for increased temporal sampling achievable with modern scanners using clinical data.
We sought to define an optimal temporal sampling protocol for dynamic 82Rb imaging in modern PET systems, using real world data from patients and healthy volunteers in addition to simulations alone7, that minimizes the tradeoffs between biases and variability in estimates of MBF and MFR and increased time and storage for image reconstruction5–10. We first found an efficient protocol then evaluated its accuracy and variability.
Materials and Methods
Study Population
We evaluated dynamic 82Rb rest and stress images from 24 prospectively recruited normal volunteers with less than or equal to 5% pre-test likelihood for coronary artery disease (CAD) (8 men, 16 women, age 51±10 years) and 32 randomly selected patients that were referred for clinically indicated 82Rb rest and stress imaging (22 men, 10 women, age 64±14 years). Pre-screening tests for normal volunteers included detailed cardiovascular history and physical examination, comprehensive metabolic and lipid panels, hemoglobin A1c and/or oral glucose tolerance test, and symptom-limited maximal treadmill exercise EKG test. All subjects provided written informed consent and all exam protocols were approved by the University of Michigan Institutional Review Board.
PET Imaging
All subjects were instructed to avoid caffeine and methylxanthine intake for 24 hours and to fast overnight prior to PET imaging. 82Rb was administered using a weight-adjusted protocol of 12MBq/kg [0.32mCi/kg] using the same activity (481–1665MBq [13–45mCi]) for both rest and stress. 82Rb was directly eluted from a generator and infused into a brachial vein at 50mL/min over 5–25 seconds using the Cardiogen-82 infusion system (Bracco Diagnostics, Monroe Township, NJ). Pharmacological stress was achieved using 0.4 mg of intravenous regadenoson. Dynamic PET scans were acquired in 3D list mode on a Biograph mCT whole-body PET/CT scanner (Siemens Healthcare USA, Malvern, PA).
Image Processing
Dynamic attenuation corrected emission images were reconstructed using the manufacturer recommended protocol (attenuation-weighted iterative 3D ordered-subset expectation-maximization iterative reconstruction or 3D-OSEM with 24 subsets and 3 iterations) without post-filtering during reconstruction to a matrix size of 128×128 and pixel size of 3.18×3.18mm. Dynamic series were reconstructed from the first 6 minutes of acquired data11. Temporal sampling protocols were divided into two phases: (1) a fine, uniformly sampled dynamic blood phase that spanned the full width of the input function peak and (2) a coarse, uniformly sampled slow-varying tissue phase. For analysis of optimum temporal sampling during the blood phase, the blood phase frame duration (T1) was varied from 2 to 20 seconds while the tissue phase frame duration (T2) remained fixed at 30 seconds. For example, {12×10s, 8×30s} is a sampling protocol with 10-second blood phase frame durations. For analysis of optimum temporal sampling during the tissue phase, T1 was fixed at 10 seconds while T2 was varied from 30 to 60 to 120 seconds. Because the peak of the input function may not fall consistently within a single temporal frame6, reconstructions with time shifts of a half frame duration for the blood phase were also analyzed.
LV myocardial surfaces were automatically determined using the 4DM software (INVIA, Ann Arbor, MI) that utilized a myocardial volume summed from the data acquired from 2 to 6 minutes. As needed, manual adjustment of the cardiac axis and the position of the mitral valve plane were performed (30 of the 56 datasets). Minimal smoothing was applied to the image volume using a 1-12-1 weighted averaging filter in three-dimensions.
The region-of-interest (ROI) sampling methodology used a 3D box that was centered at the mitral valve plane along the axis of the LV to automatically extract a unique LV blood pool time activity curve. The size of the box was 2×2 pixels wide (6.4mm) to minimize spillover from the myocardium and spanned the long axis to include activity in both the LV and left atrium (6.4×6.4×30mm). The myocardial tissue time activity curves were estimated from the tracer activity midway between the endocardial and epicardial surfaces for each of the 3 vascular territories of the left anterior descending (LAD), left circumflex (LCX), and right coronary artery (RCA), and averaged for the global tissue TAC.
Input Function Width Estimation
From the dynamic sequence with T1= 2s, the input function width was estimated from the FWHM of the LV blood pool TAC within the blood phase. The peak height and peak time were approximated with a quadratic fit to the points from the peak frame and its two adjacent neighboring frames. The FWHM was determined using linear interpolation between points in all other frames.
Maximum Frame Duration Definition
Fourier analysis was used to determine the minimum temporal sampling to maintain 95% of underlying information contained in the input function. The minimum temporal sampling defines the maximum limit for the frame duration during the blood phase (defined as TS), which is also related to the Nyquist sampling rate which preserves 95% of the signal information. Linear mixed-effects modeling, with robust estimation and with per subject error terms to account for correlation between stress and rest data from a given subject, was used to assess the relationship between TS and FWHM. Similar analyses were also conducted for the tissue phase frame duration using the LV tissue TAC. These analyses defined an efficient temporal sampling protocol. The minimum temporal sampling definition was also used to analyze the number of phases and their phase intervals that result in the fewest number of frames across all datasets.
Blood Flow Estimation
Both LV blood pool input function and LV tissue TAC were fit to a 1-tissue compartment to obtain estimates for uptake rate K1, washout rate k2, and LV blood pool to myocardium spillover fV. Myocardial blood flow was computed from the estimated K1 using a previously validated K1-MBF relationship for 82Rb.12 All temporal frames were frame duration weighted in the kinetic fitting.
Verification by Simulation
Using previously validated methods5, noiseless and noisy simulated TACs were generated to confirm the effects of varying input function widths and blood phase frame durations on MBF and MFR. A model for the baseline time activity curves from the infusion system was selected from the available 82Rb normal volunteer data with a blood pool frame duration of 2 seconds and a narrow FWHM of 9.8 seconds for stress. An additional input function with a greater width was simulated by a convolution with rectangular function of width of 15 seconds as a dispersion function5 with a resulting FWHM of 16.3 seconds. The baseline TACs were interpolated to 1 second frames.
The myocardial tissue TACs were generated using a 1-tissue compartment model including spillover from the blood pool TAC to the myocardial tissue TAC. The kinetic parameters used in the 1-tissue compartment model were chosen from the averaged kinetic fits of the 82Rb normal volunteer data during stress: K1=1.11 (MBF=2.95) ml/min/g, k2=0.12 min−1, and fV=0.43.
To generate noisy simulated TACs, time-varying Gaussian noise (100 noise realizations per frame) with zero mean and with standard deviation varying with the tissue activity and globally scaled to 5% of the mean tissue activity post 2 minutes, were added to the baseline tissue TACs. Both noiseless and noisy 1-second frame duration TACs were rebinned to TACs with the blood phase frame duration T1 varying from 1 to 20 seconds with a fixed tissue phase frame duration of 30 seconds. During the rebinning process, the blood phase frames were also time shifted from 1 to 20 seconds to allow varying proportions of the peak of the input function to fall within one or more temporal frames. MBF estimates were averaged over all noise realizations and all frame shifts per sampling protocol.
Time Sampling Effects on MBF and MFR
Relative differences in global and regional MBF or MFR by varying frame durations were computed for simulated and clinical data. The MBF and MFR values from the 2-second blood phase frame duration and the 30-second tissue phase frame duration sampling protocols were the reference values for computing relative differences. Changes in MBF and MFR were used to select the optimal temporal sampling protocol that improved accuracy and reduced variability.
Statistical Analysis
Statistical significance was assessed with Wilcoxon tests and Fisher exact tests for continuous and dichotomous variables, respectively. Two-sided values of P<0.05 were considered significant. All statistical analyses were performed with R 3.3.1 (The R Foundation for Statistical Computing).
Results
Study Population
Characteristics of patients and normal volunteers evaluated are given in Table 1.
Table 1.
Subject characteristics
| Characteristic | Normals (n=24) |
Patients (n=32) |
All (n=56) |
P |
|---|---|---|---|---|
| Age (y) | 50.5 [44.5–58.8] | 64.2 [57.4–73.0] | 58.3 [46.3–69.0] | 0.0002 |
| Weight (kg) | 74.5 [61.7–83.7] | 88.2 [72.3–99.5] | 82.3 [65.4–90.3] | 0.014 |
| Height (m) | 1.70 [1.63–1.75] | 1.64 [1.63–1.75] | 1.67 [1.63–1.75] | 0.72 |
| Male sex | 8 (33) | 22 (69) | 30 (54) | 0.014 |
| Hypertension | 0 (0) | 26 (81) | 26 (48) | <0.0001 |
| Dyslipidemia | 0 (0) | 29 (91) | 29 (52) | <0.0001 |
| Diabetes | 0 (0) | 17 (53) | 17 (30) | <0.0001 |
Continuous variables are presented as median [interquartile range]. Dichotomous variables are presented as number (%). P-values compare Normals and Patients.
Input Functions
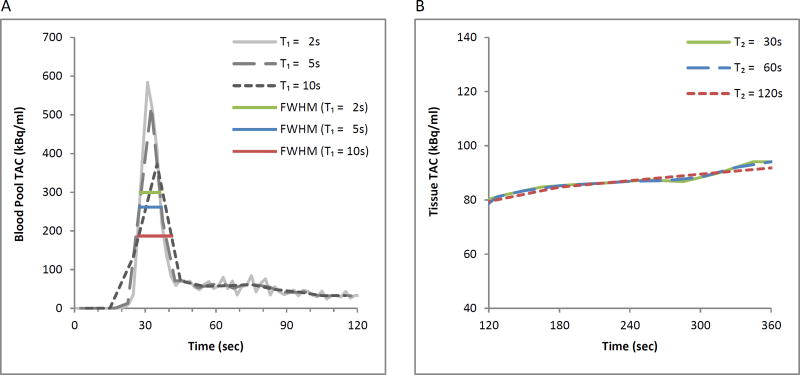
TACs from a representative normal volunteer are presented in Figure 1 who received a 1000MBq (27mCi) injected dose from a 4-day old generator. The relatively narrow input function FWHM of 8.3 seconds requires sampling of less than 8.2 seconds to accurately capture the peak (Figure 1A). With a 5 second frame duration, a modest 1.0 second (12%) increase in the FWHM is observed. With a 10 second frame duration, the measured FWHM is markedly increased at 13.9 seconds due to insufficient temporal sampling. Figure 1B shows for the same representative volunteer, the tissue phase of the tissue TAC with 30, 60 and 120 second frame durations maintain their similar shape with relative root mean squared differences of 0.6% for 60 seconds and 1.7% for 120 seconds both with respect to the 30-second frame duration tissue TAC.
Figure 1.
Time activity curves from a representative normal volunteer with time points from initiation of the scan to 120 seconds (blood phase, panel A) and from 120 seconds to 360 seconds (tissue phase, panel B). In panel A, TACs from reconstructions with frame durations of 10 seconds demonstrates a dramatically different shape from those with shorter durations: the 10 second reconstructions resulted in a substantially lower and wider TAC. With increasing frame durations of 2, 5 and 10 seconds, there were increasing FWHM values of 8.3, 9.3, and 13.9 seconds, respectively. In panel B, the tissue TAC shows successive longer tissue phase frame durations of 30, 60, 120 seconds with only minor differences in shape.
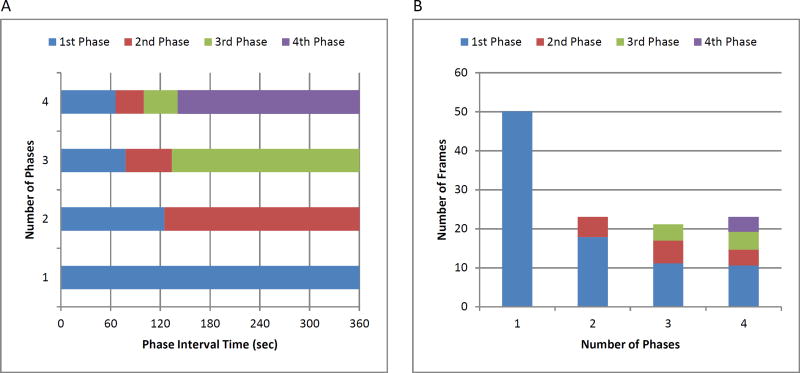
Increasing protocol complexity to include one or more additional transition phases with intermediate length frame durations between the blood pool and tissue phases (Figure 2A) did not result in significantly improved protocol efficiency (Figure 2B). Similarly, a four-phase protocol did not result in greater efficiency than achieved by a two-phase protocol.
Figure 2.
(A) Interval times for 1, 2, 3, and 4 uniformly sampled phases with the fewest number of frames across all datasets. (B) Fewest number of frames for protocols with different numbers of phases.
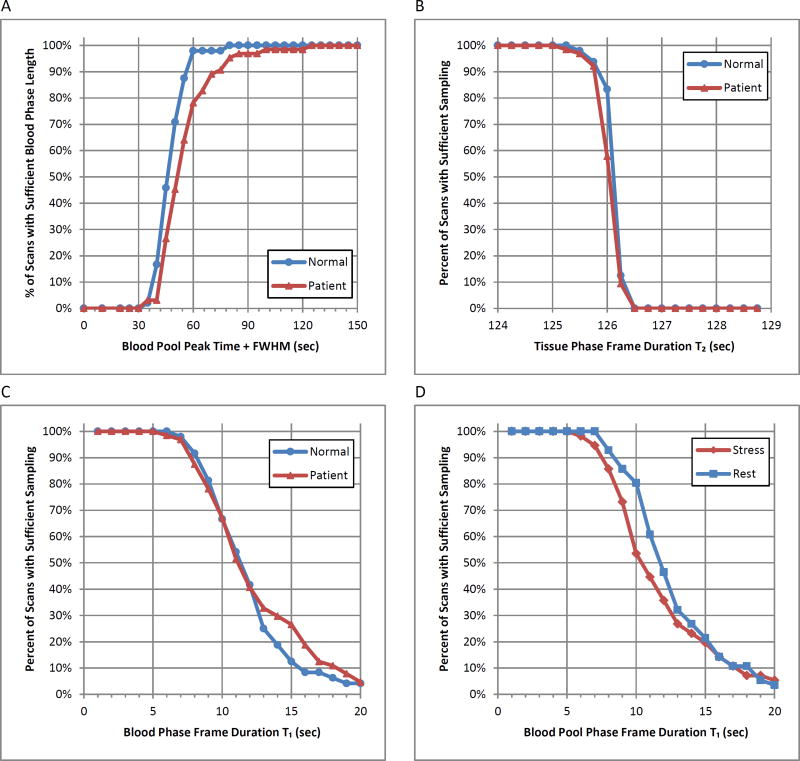
The mean time of peak blood pool activity was 37 ± 9.2 seconds for all stress studies and 39±6.4 seconds for all rest studies, with a maximum of 85 seconds (Table 2). The mean FWHM was 11.8 ± 5.6 seconds for all stress studies and 13.4 ± 5.2 for all rest studies, with a maximum of 38 seconds. Consequently, an empiric transition point between the blood pool and tissue phases at the maximum time to peak activity plus the maximum FWHM (85 + 38 = 123 ≈ 120 seconds) was selected which confirms the results in Figure 2A. This duration was sufficient to fully capture the blood phase in 100% of normal volunteers and 98% of patients (Figure 3A). The frame duration during the blood phase which retained ≥95% of the blood pool TAC signal information for all volunteers and patients was 5 seconds (Figure 3C), including at rest and stress (Figure 3D). Analogously, the phase frame duration during the tissue phase which retained ≥95% of the tissue TAC signal information for all volunteers and patients was 125 seconds (Figure 3B).
Table 2.
Imaging parameters
| Parameter | Normals (n=24) |
Patients (n=32) |
All (n=56) |
P |
|---|---|---|---|---|
| Stress cardiac output (mL/min) | 6.7 [5.8–7.8] | 5.9 [4.9–7.2] | 6.3 [5.0–7.3] | 0.045 |
| Rest cardiac output (mL/min) | 4.3 [3.5–5.3] | 4.7 [3.6–5.5] | 4.5 [3.6–5.4] | 0.32 |
| Stress ejection fraction (%) | 69.0 [65.3–74.0] | 50.0 [37.3–59.0] | 58.1 [47.5–69.0] | 0.0008 |
| Rest ejection fraction (%) | 61.5 [57.3–65.0] | 50.5 [38.0–63.0] | 55.2 [45.8–65.0] | 0.016 |
| Stress ejection fraction <45% | 0 (0) | 12 (38) | 12 (21) | 0.0006 |
| Rest ejection fraction <45% | 0 (0) | 14 (44) | 14 (25) | 0.0001 |
| Generator age, range (d) | 16.8 [7.3–23.8] | 16.3 [9.3–24.0] | 16.5 [8.3–24.0] | 0.90 |
| Stress time to peak, range (s) | 32.3 [29.9–34.0] | 40.6 [34.3–43.3] | 37.0 [32.3–39.0] | <0.0001 |
| Rest time to peak, range (s) | 37.5 [34.3–40.4] | 41.5 [36.3–45.1] | 39.8 [35.6–42.5] | 0.018 |
| Stress FWHM, range (s) | 10.4 [8.4–12.7] | 12.9 [8.2–15.3] | 11.8 [8.3–14.0] | 0.16 |
| Rest FWHM, range (s) | 12.8 [10.7–14.4] | 13.9 [10.6–16.9] | 13.4 [10.6–14.9] | 0.74 |
| Stress max. frame duration TS (s) | 11.0 [8.9–12.7] | 12.1 [8.4–14.9] | 11.7 [8.8–13.7] | 0.55 |
| Rest max. frame durations TS (s) | 12.5 [10.5–14.0] | 12.5 [9.8–15.4] | 12.5 [10.2–14.4] | 0.84 |
Continuous variables are presented as median [interquartile range]. Dichotomous variables are presented as number (%). P-values compare Normals and Patients.
Figure 3.
(A) Percentage of PET datasets with sufficient blood phase length that includes the blood pool peak time from start of injection plus FWHM. (B) Percentage of sufficiently sampled tissue TAC in the tissue phase. (C,D) Percentage of sufficiently sampled blood pool TAC where T1<TS as a function of initial frame duration. All data is shown separated in to (A,B,C) normal and patient datasets and (D) stress and rest series.
Fitting for Infusion System and Scanner
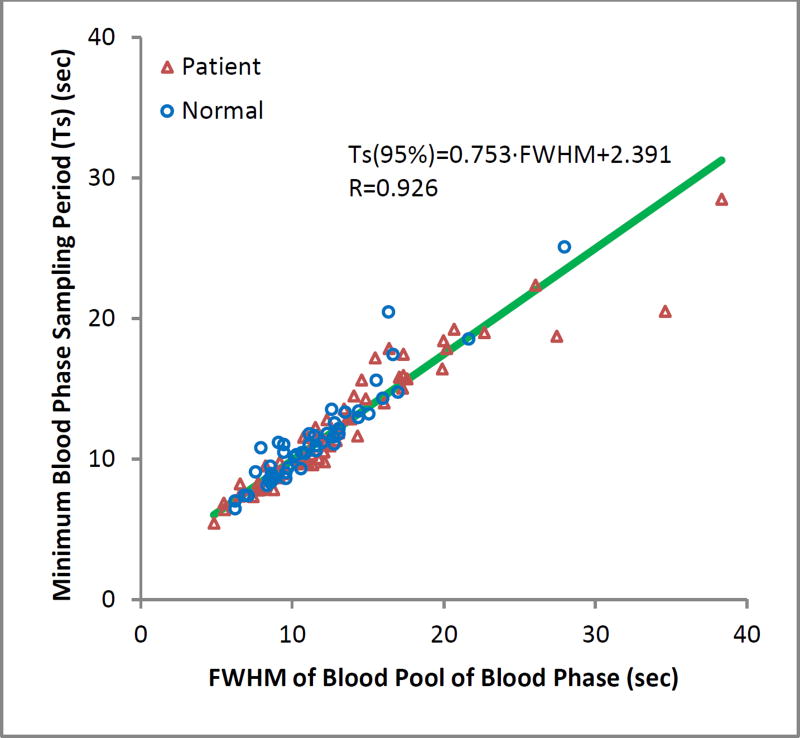
We found that the minimum sampling rate (frame duration) was proportionally correlated to the FWHM (R=0.926). The minimum sampling rate could be reliably predicted from the linear mixed-effects model fit as seen in the scatter plot in Figure 4. Generally, input functions with width and frame duration fall above this regression line will be under-sampled, while those below will be over-sampled. Those on or near the line will be near optimally sampled.
Figure 4.
Linear relationship between the frame duration of the blood phase and the peak FWHM of the input curve that preserves 95% of the blood pool signal information.
Simulated Time Sampling Effects on MBF and MFR
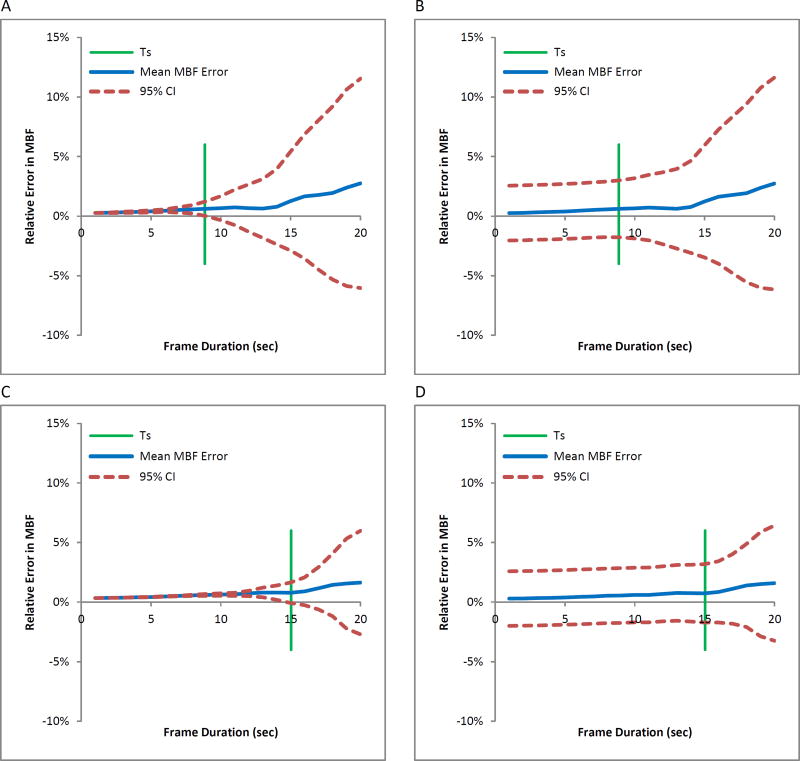
In simulations, the mean relative MBF error slowly increases as a function of frame duration for different input function widths of 9.8 (Figure 5A) and 16.3 seconds (Figure 5C). The variability in measurement dramatically increases when the blood phase frame duration T1 is greater than the maximum frame duration TS, which preserves ≥95% of the information content of the input function. The 95% confidence intervals substantially increase beyond 8.9 seconds for FWHM=9.8 seconds and 15.0 seconds for a FWHM=16.3 seconds. Furthermore, where T1 is substantially greater than TS, the average measured MBF is meaningfully different from the true value. When noise is incorporated into simulations (Figures 5B and 5D), the mean MBF error is nearly identical to the noise-free simulation model. With the 95% confidence intervals beginning at approximately 5%, the MBF error variability begins to increase slowly with frame durations after the maximum frame duration TS and increases more sharply 5 seconds after TS.
Figure 5.
Relative MBF error versus blood phase frame duration in simulated data with FWHM of 9.8s and TS of 8.9s, indicated by green line, (A) noiseless and (B) with simulated noise, and FWHM of 16.3s and TS of 15.0s, (C) noiseless and (D) with simulated noise. Blue line indicates mean and red lines indicate range of errors (CI=confidence intervals).
Clinical Time Sampling Effects on MBF and MFR
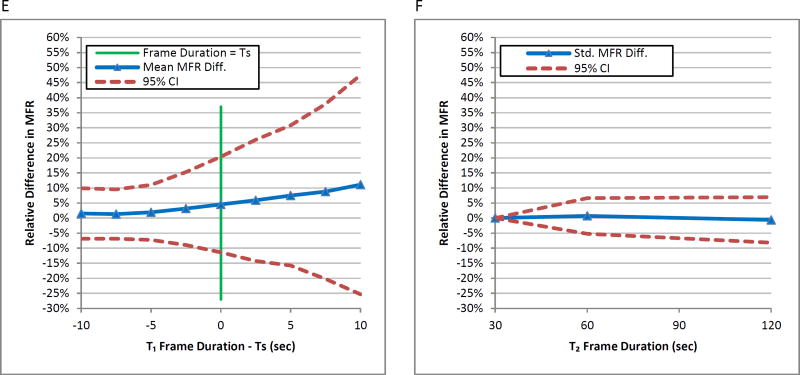
In Figures 6A, 6C, and 6E, the mean relative differences in global MBF and MFR of the 56 studies increased as the blood phase frame duration T1 increased. The standard deviations of relative MBF and MFR values also increased with increasing frame duration T1 beyond the recommended frame duration TS for each dataset. Sudden increases in the variability are more clearly seen beyond TS. The global MBF and MFR mean relative differences from varying T2 were within 5% with little change in variability compared to the reference sampling protocol with T2 as 30 seconds seen in Figures 6B, 6D, and 6F.
Figure 6.
Mean relative differences in global (A) stress MBF, (C) rest MBF, and (E) MFR of all datasets versus blood phase frame duration minus TS of each dataset. The 95% confidence interval lines denote increasing variability after TS. Reference values are global MBF and MFR values using the T1=2 second frame duration. Mean relative differences in global (B) stress MBF, (D) rest MBF, and (F) MFR of all datasets versus tissue phase frame duration. Reference values are global MBF and MFR values using the T2=30 second frame duration.
Mean magnitude differences in global MBF and MFR as a function of frame durations T1 are re-categorized by dataset type in Table 3. For sufficiently sampled protocols (T1≤5 seconds), the average relative magnitude differences of stress MBF, rest MBF and MFR are less than 5%. For insufficiently sampled protocols (T1>5 seconds), the average relative magnitude differences for stress MBF for all datasets exceed 5% at approximately 6 second frame durations at an increasing rate of 12 percentage point per 10 seconds of frame duration. The average relative magnitude difference for rest MBF and MFR for all datasets also exceeds 5% at approximately 8 second frame durations but at an increasing rate of 6 percentage points per 10 seconds of frame duration.
Table 3.
Effects of blood phase sampling on global MBF and MFR means
| Dataset | Quantity | Reference* | Magnitude Difference Mean at T1 | ||||||
|---|---|---|---|---|---|---|---|---|---|
| T1 | 2sec | 4sec | 5sec | 8sec | 10sec | 12sec | 15sec | 20sec | |
| Normal | Stress MBF | 2.6 ± 0.6 | 3.9% | 4.6% | 9.3% | 12.1% | 15.6% | 20.0% | 28.0% |
| Rest MBF | 0.8 ± 0.2 | 2.2% | 2.5% | 4.0% | 4.6% | 5.7% | 6.9% | 9.6% | |
| MFR | 3.4 ± 0.8 | 2.6% | 2.9% | 5.9% | 7.9% | 10.4% | 13.2% | 18.0% | |
| Patient | Stress MBF | 1.7 ± 0.8 | 3.8% | 4.4% | 7.6% | 9.3% | 11.1% | 13.7% | 18.6% |
| Rest MBF | 1.1 ± 0.4 | 3.1% | 4.3% | 6.3% | 8.1% | 9.6% | 11.4% | 15.8% | |
| MFR | 1.7 ± 0.8 | 2.8% | 3.3% | 3.6% | 4.7% | 5.1% | 6.2% | 7.6% | |
| All | Stress MBF | 2.1 ± 0.8 | 3.8% | 4.5% | 8.3% | 10.5% | 13.0% | 16.4% | 22.7% |
| Rest MBF | 1.0 ± 0.4 | 2.7% | 3.5% | 5.3% | 6.6% | 7.9% | 9.4% | 13.2% | |
| MFR | 2.4 ± 1.2 | 2.7% | 3.1% | 4.6% | 6.1% | 7.3% | 9.2% | 12.1% | |
Reference values come from 2sec frame duration result averages and in ml/min/g for MBF and unitless for MFR.
The mean magnitude differences in global and regional MBF and MFR as a function of the tissue phase frame durations T2 are within 3% for T2 of 60 seconds and within 5% for T2 of 120 seconds in Table 4. Nearly all of the MBF and MFR relative differences in each of the vascular territories of LAD, LCX, and RCA were not significantly different from the global relative differences in spite of their lower tissue count statistics.
Table 4.
Effects of tissue phase sampling on global and regional MBF and MFR means for all datasets
| Quantity | Region | Reference* | Magnitude Difference Mean at T2 | P | ||
|---|---|---|---|---|---|---|
| T2 | 30sec | 60sec | 120sec | 60sec | 120sec | |
| Stress MBF | Global | 2.5 ± 1.2 | 2.3% | 4.4% | ||
| LAD | 2.5 ± 1.1 | 2.4% | 4.8% | 0.77 | 0.061 | |
| LCX | 2.5 ± 1.3 | 2.4% | 4.2% | 0.82 | 0.0044 | |
| RCA | 2.8 ± 2.8 | 2.4% | 4.4% | 0.64 | 0.33 | |
| Rest MBF | Global | 1.0 ± 0.4 | 2.6% | 4.4% | ||
| LAD | 1.1 ± 0.4 | 2.9% | 4.5% | 0.54 | 0.88 | |
| LCX | 1.0 ± 0.4 | 2.5% | 4.2% | 0.082 | 0.080 | |
| RCA | 1.0 ± 0.4 | 3.0% | 5.2% | 0.40 | 0.25 | |
| MFR | Global | 2.7 ± 1.6 | 2.1% | 2.8% | ||
| LAD | 2.6 ± 1.4 | 2.5% | 3.0% | 0.20 | 0.32 | |
| LCX | 2.6 ± 1.6 | 2.5% | 3.6% | 0.26 | 0.87 | |
| RCA | 3.1 ± 2.1 | 2.7% | 4.0% | 0.25 | 0.083 | |
Reference values come from 30sec tissue phase frame duration result averages and in ml/min/g for MBF and unitless for MFR. P-values compare regional (LAD, LCX, RCA) with global relative magnitude differences.
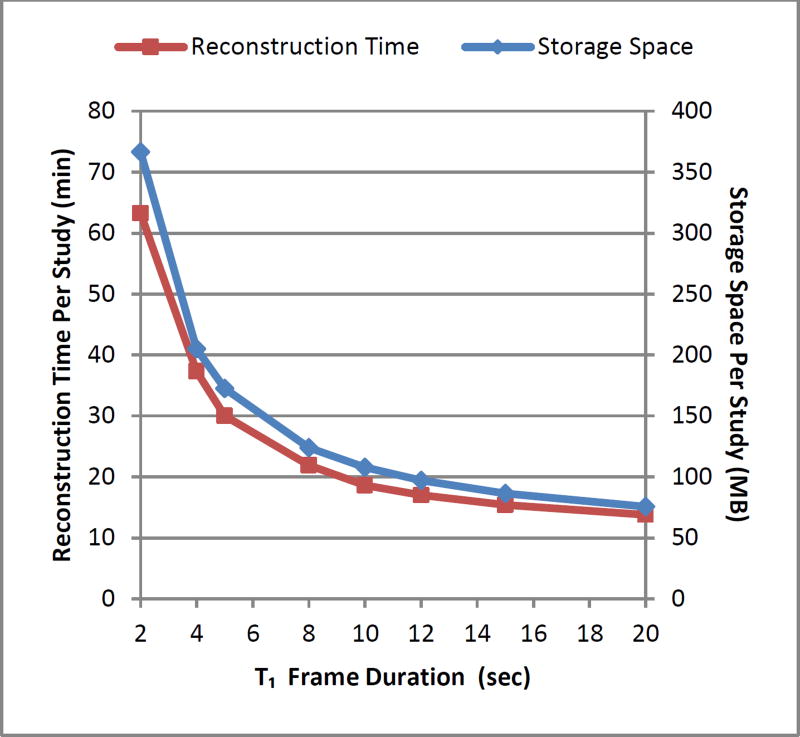
We minimized MBF differences to within 5% with a reduction of 53% of the number of frames when using 5 second frame durations in the blood phase compared to the least efficient frame duration of 2 seconds. Alternatively, using frame durations less than 5 seconds resulted in steeply increasing requirements for storage space and image reconstruction time (Figure 7). Ensuring sufficient sampling, the trade-off that remains in selecting the appropriate sampling protocol is between quantification accuracy and computational efficiency.
Figure 7.
Reconstruction time and storage space per study versus blood phase frame duration.
Discussion
This study optimizes dynamic time frame binning during image reconstruction for quantification of MBF and MFR using 82Rb PET. Frame durations were defined to minimize bias, variability, and demands on computation and storage. Compared to the other protocols used in this study, these protocols results in improvements of 2–8%, 3–15% and 16–53% in bias, variability and computational efficiency, respectively. These optimal protocols can readily be implemented with existing software packages on clinical PET instruments.
Current System Recommendations
For injections performed by an automated constant flow 82Rb infusion system such as the Bracco Cardiogen-82, the input function width is not directly controllable by the user and is determined by multiple factors including: requested activity, generator age, and the physiology of the individual patient. Given substantial potential variability in input function duration, frame durations should be determined based on the lower end of the range of input function durations to be expected in clinical practice. For example, when using a Bracco infusion system with a Siemens Biograph mCT, a 5 second blood phase frame duration would be sufficient as seen in Figure 3C.
With a current generation 3D scanner with high count rate capabilities, we showed data with blood pool FWHM of 5 seconds or greater was adequately sampled at 5 second frame durations for accurate MBF and MFR quantification to within 5% that of blood phase frame durations of less than 5 seconds. Variability in generator age or patient physiology (increasing LV dysfunction) typically results in variability in the FWHM of the blood pool TAC. Frame durations lower than 5 seconds increase storage space and reconstruction needed up to twofold (Figure 7). Consequently, 5 second sampling remains the recommended protocol, provided adequate counting statistics are obtained. With respect to the tissue phase, we found that 125s duration frames were sufficient to retain 95% of signal information for all tissue TACs and that T2 frame durations of 30, 60, or 120 seconds can be accommodated with less than 2% bias in MBF and MFR values. Longer tissue phase frame durations might also be sufficient but were not evaluated in this study. Therefore {24×5s, 2×120s} is one sampling protocol that sufficiently samples the blood phase and the tissue phase. A summary of sampling requirements is listed in Table 5.
Table 5.
Summary of sampling requirements
| Parameter | Optimal | Alternate | Effect of Alternate Parameter Values |
|---|---|---|---|
| Number of Phases | 2 | 3 or 4 | Less than 8% space and time savings |
| Blood Phase Interval | 0–120sec | ||
| Tissue Phase Interval | 120–360sec | ||
| Blood Phase Frame Duration (T1) | 5sec | 10sec | Up to 12% MBF and MFR change |
| Tissue Phase Frame Duration (T2) | 125sec | 120, 60, or 30sec | Less than 5% in MBF and MFR change |
Considerations for Other Systems
For count limited scanners, slower protocols relative to the sampling can bias MBF estimates due to poor count statistics per frame.6 Conversely, fast bolus injections may result in count losses,13 leading to underestimation of the input function. For older PET systems with lower sensitivity and increased risk of count losses, careful optimization may require lengthening the injection duration using a controllable pump13 to increase the FWHM of the blood pool TAC. Then using the TS and FWHM relationship in Figure 4, an optimum sampling protocol for the blood phase may be determined.
For scanners with a minimum frame duration, such as 5 second frame durations for example, the injection should be performed >3 seconds again using the relationship in Figure 4 in order to avoid under-sampling of the resulting input function.
For cases where the both the infusion system and scanner are constrained, bias and variability in MBF and MFR estimates may be unavoidable (Figures 5 and 6).
New Knowledge Gained
Under-sampling of the blood phase of TACs from dynamic 82Rb PET images with frame durations longer than 5 seconds significantly increases MBF and MFR estimates and their variability. Tissue phase frame durations can be as large as 120 seconds.
Limitations
Due to this retrospective analysis of the experimental data in the study, a reference arterial blood curve was not available and the 2-second blood phase frame duration and 30-second tissue phase frame duration sampling protocols were used as the reference standards. Another limitation was acquiring the data from one PET scanner and one infusion system. Differences in scanner types such as 2D or 3D acquisition and count rate performances could affect the image quality of short duration frames and the resulting image-derived arterial blood curves. Similarly utilizing a different infusion system with a constant activity rate allowing for slower infusions13 instead of one with a constant flow rate may yield more relaxed recommendations for the blood phase frame duration. Variations in other methodological factors such as scatter correction, prompt gamma correction, image reconstruction and post-filtering, patient motion, and tracer kinetic modeling could also affect the results.14
Conclusions
A simple two-phase framing of dynamic 82Rb PET images where the blood phase has frame durations of 5 seconds and a phase length of 120 seconds optimally samples the blood pool TAC for modern 3D PET systems. Frame durations for the tissue phase can be as large as 120 seconds with minimal effect on flow estimates. For imaging systems incapable of the required temporal sampling, the injection duration should be increased accordingly. If required temporal sampling is not possible and injections cannot be lengthened, increased variability and bias in MBF and MFR estimates are expected.
Abbreviations
- FWHM
full-width at half maximum
- LV
left ventricular
- MBF
myocardial blood flow
- MFR
myocardial flow reserve
- PET
positron emission tomography
- ROI
region of interest
- T1
blood phase frame duration
- T2
tissue phase frame duration
- TS
maximum blood phase frame duration
- TAC
time-activity curve
Footnotes
Conflict of Interest
B.C. Lee and J.B. Moody are employees of INVIA Medical Imaging Solutions. R.L. Weinberg has no disclosures. J.R. Corbett and E.P. Ficaro are owners of INVIA Medical Imaging Solutions. V.L. Murthy has received consulting fees from Ionetix, Inc. and Bracco Diagnostics and owns stock in General Electric, Mallinckrodt and Cardinal Health.
References
- 1.Murthy VL, Naya M, Foster CR, Hainer J, Gaber M, Di Carli G, et al. Improved Cardiac Risk Assessment With Noninvasive Measures of Coronary Flow Reserve. Circulation. 2011;124(20):2215–2224. doi: 10.1161/CIRCULATIONAHA.111.050427. [DOI] [PMC free article] [PubMed] [Google Scholar]
- 2.Ziadi MC, deKemp RA, Williams KA, Guo A, Chow BJW, Renaud JM, et al. Impaired Myocardial Flow Reserve on Rubidium-82 Positron Emission Tomography Imaging Predicts Adverse Outcomes in Patients Assessed for Myocardial Ischemia. J Am Coll Cardiol. 2011;58(7):740–748. doi: 10.1016/j.jacc.2011.01.065. [DOI] [PubMed] [Google Scholar]
- 3.Naya M, Murthy VL, Taqueti VR, Foster CR, Klein J, Garber M, et al. Preserved Coronary Flow Reserve Effectively Excludes High-Risk Coronary Artery Disease on Angiography. J Nucl Med. 2014;55(2):248–255. doi: 10.2967/jnumed.113.121442. [DOI] [PMC free article] [PubMed] [Google Scholar]
- 4.Ziadi MC, deKemp RA, Williams K, Guo A, Renaud JM, Chow BJW, et al. Does quantification of myocardial flow reserve using rubidium-82 positron emission tomography facilitate detection of multivessel coronary artery disease? J Nucl Cardiol. 2012;19(4):670–680. doi: 10.1007/s12350-011-9506-5. [DOI] [PubMed] [Google Scholar]
- 5.Raylman RR, Caraher JM, Hutchins GD. Sampling requirements for dynamic cardiac PET studies using image-derived input functions. J Nucl Med. 1993;34(3):440–447. [PubMed] [Google Scholar]
- 6.Ross SG, Welch A, Gullberg GT, Huesman RH. An investigation into the effect of input function shape and image acquisition interval on estimates of washin for dynamic cardiac SPECT. Phys Med Biol. 1997;42(11):2193–2213. doi: 10.1088/0031-9155/42/11/014. [DOI] [PubMed] [Google Scholar]
- 7.Kolthammer JA, Muzic RF. Optimized dynamic framing for PET-based myocardial blood flow estimation. Phys Med Biol. 2013;58(16):5783. doi: 10.1088/0031-9155/58/16/5783. [DOI] [PubMed] [Google Scholar]
- 8.Klein R, Beanlands R, deKemp R. Quantification of myocardial blood flow and flow reserve: technical aspects. J Nucl Cardiol. 2010;17(4):555–570. doi: 10.1007/s12350-010-9256-9. [DOI] [PubMed] [Google Scholar]
- 9.Mazoyer BM, Huesman RH, Budinger TF, Knittel BL. Dynamic PET data analysis. J Comput Assist Tomogr. 1986;10(4):645–653. doi: 10.1097/00004728-198607000-00020. [DOI] [PubMed] [Google Scholar]
- 10.Herrero P, Markham J, Bergmann SR. Quantitation of myocardial blood flow with H215O and positron emission tomography: assessment and error analysis of a mathematical approach. J Comput Assist Tomogr. 1989;13(5):862–873. doi: 10.1097/00004728-198909000-00021. [DOI] [PubMed] [Google Scholar]
- 11.Efseaff M, Klein R, Ziadi MC, Beanlands RS, deKemp RA. Short-term repeatability of resting myocardial blood flow measurements using rubidium-82 PET imaging. J Nucl Cardiol. 2012;19(5):997–1006. doi: 10.1007/s12350-012-9600-3. [DOI] [PubMed] [Google Scholar]
- 12.Lortie M, Beanlands RSB, Yoshinaga K, Klein R, Dasilva JN, DeKemp RA. Quantification of myocardial blood flow with 82Rb dynamic PET imaging. Eur J Nucl Med Mol Imaging. 2007;34(11):1765–1774. doi: 10.1007/s00259-007-0478-2. [DOI] [PubMed] [Google Scholar]
- 13.Klein R, Adler A, Beanlands RS, deKemp RA. Precision-controlled elution of a 82Sr/82Rb generator for cardiac perfusion imaging with positron emission tomography. Phys Med Biol. 2007;52(3):659–673. doi: 10.1088/0031-9155/52/3/009. [DOI] [PubMed] [Google Scholar]
- 14.Moody J, Lee B, Corbett J, Ficaro E, Murthy V. Precision and accuracy of clinical quantification of myocardial blood flow by dynamic PET: A technical perspective. J Nucl Med. 2015;22(5):935–951. doi: 10.1007/s12350-015-0100-0. [DOI] [PubMed] [Google Scholar]


