

Abstract
Background
Previous studies have indicated that snacking is contributing to increased calorie intake of American children, and that the energy density of snacks in US diets has increased in recent decades.
Objective
Examine short and long-term trends in the energy density and food sources of snacks for US children over from 1977 to 2014, and examine whether trends differ between socio-demographic groups.
Methods
We used data collected from eight nationally representative surveys of food intake in 57,762 US children age 2–18 years, between 1977 and 2014. Overall patterns of snacking, trends in energy intake from snacking, trends in food and beverage sources and energy density of snacks across race-ethnic, age, gender, education and income groups were examined.
Results
In all socio-demographic groups there was a significant increase in per capita energy intake deriving from snacks from 1977 to 2014 (P<0.01). Salty snack intake doubled over the study period, and sugar-sweetened beverage intake decreased overall from 1977 to 2014 but increased in Non-Hispanic Blacks. Non-Hispanic Blacks had the largest increase in per capita intake from foods as a snack from 1977 to 2014. Children in the lowest poverty level and household education groups had more than 100% increase in calorie intake from snacks from 1977–2014.
Conclusions
We found that snacking behavior in the US differs between race-ethnic, household education, gender and income groups, yet snacking remains a significant component of children’s diets and the foods consumed at these snacks are not the types of foods recommended by the US dietary guidelines.
Keywords: snacking trends, dietary intake, race-ethnic differences, salty snacks, children
Introduction
Currently around one in three US children are overweight or obese.1 Obese children are more likely to have risk factors for cardiovascular disease, such as high cholesterol or high blood pressure,2 and are more likely to become obese adults, hence at higher risk for non-communicable diseases.3 Obesity increases in recent decades have been attributed to a number of factors, including consuming food outside the home, increased portion sizes, increases in intake of sugar-sweetened beverages (SSBs) and increases in snacking behaviors.4,5 There are growing concerns about the types of food and beverages consumed as snacks, and the amount of energy snacking provides. A recent review of snacking patterns among children and adolescents highlighted the lack of data describing snacking trends in the US population, and available data were not recent enough to understand what effects snacking may be having on current energy intake in US children.6
Research over the last five years has suggested a plateauing of obesity levels in children and adolescents7 and a decline in energy intakes of US households with children.8 It is important to examine whether declines in snacking behaviour are also occurring. One study examining long-term trends of snacking behaviors in children found that the percentage of children snacking on any given day increased from 74% in 1977–1978 to 98% in 2003–2006 and that snacks accounted for 27% of daily total energy intake in 2003–2006.9 However it is unknown whether this increasing trend for snacking has continued in recent years or whether trends are in line with plateauing obesity levels and reduced energy intake of US households.
In addition, studies that have examined short-term snacking trends have observed inconsistent results between different race-ethnic, age and weight groups,10 and also that a large proportion of snacks still appear to derive from less healthy foods such as salty snacks, desserts and sweets.6,11 To date there have been no studies exploring how and whether long-term snacking trends differ by socio-demographic factors such as race-ethnicity, household income and household education, and no short-term studies exploring whether household income and education are associated with snacking behaviour in US children.
Population averages may mask important differences between socio-demographic subgroups. As such, we examined both short and long-term changes in snacking patterns in US children by age group, gender, race-ethnicity, education and income level. This included an examination of overall snacking patterns, trends in energy intake from snacking, trends in food and beverage sources and overall trends of the energy density of snacks across race-ethnic, age, education, gender and income groups.
Methods
Survey population
Data were obtained from eight nationally representative surveys of food intake in 57,762 US children aged <19 years. Data are from the 1977–1978 Nationwide Food Consumption Survey (NFCS); the 1989–1991 Continuing Survey of Food Intake by Individuals (CSFII), the 1994–1996 CSFII and the 1997–1998 CSFII. Four NHANES surveys were used: NHANES 2003–2004, NHANES 2005–2006 (NHANES 03–06), NHANES 2011–12 and NHANES 2013–14 (NHANES 11–14). Supplementary Table 1 shows the number of records used in each survey year. The USDA and NHANES surveys are based on a multistage, stratified area probability sample of noninstitutionalized US households. Detailed information about each survey and its sampling design has been published previously.12 By utilizing secondary USDA and NHANES data, we were exempt from institutional review board concerns for this paper.
Snacking definition
Each eating occasion was self-defined by the respondent in each survey. Respondents were asked to name the type of each eating occasion and the main meal planner was asked about intake for any child under the age of 12.13 The snack category includes those eating occasions defined by the respondent as “snack,” plus occasions related to snacking, such as food and/or beverage breaks.
Dietary data
All dietary survey data used a comparable food composition table and collection methods developed by the USDA. To examine trends over time from surveys with different collection methods on days 1 and 2, we used only the first day’s data (a single, interviewer-administered 24-h dietary recall) collected from each individual (as recommended by the USDA) and used appropriate weights and adjustments for the sample design provided.
UNC food grouping system
To determine snack food items contributing to energy intake, the food grouping system developed by the University of North Carolina at Chapel Hill (UNC-CH) was used. This food grouping system links all foods from 1977 onwards and has been previously described.14 All foods reported in the USDA surveys were assigned to one of the 107 UNC-CH food groups. For all children, the amount of energy content provided by each UNC-CH snack food group was calculated and divided by the total energy from snacking of all individuals. Those food groups contributing the most to snacking energy intake are reported.
Statistical analysis
Data are presented as means (SE). Snacking trends were studied by dividing the population into three age groups (2–5 y, 6–11 y, and 12–18 y), four race-ethnic groups (Hispanic, Non-Hispanic White, Non-Hispanic Black and Other), two genders (Male and Female), three income groups (<185%, 185–350% and >350% of the National Poverty Level) and four household education groups (less than high school, high school diploma, some college and bachelor’s degree). We used survey commands to account for survey design, weighting, and clustering.15 The proportion of children consuming snacks within each race-ethnic, gender, income, age and education group was determined. For each survey year, the percentage of children who were reported snackers was examined by each socio-demographic group. We calculated the mean number of snacking occasions per day, mean energy intake (calories) from snacks per capita per day, and the proportion of energy intake deriving from snack foods. Survey methods were used within STATA to account for the clustering and weighting that is inherent in the NHANES sampling methodology, so as to allow statistically significant differences between survey cycles to be identified using Student’s t-test. A p-value of <0.05 was considered significant. STATA version 14.1 was used for all analyses.
Results
Overall trends
For all US children there was a significant increase in per capita energy intake from snacks from 1977–2014 (P<0.01) (Table 1). There was a peak in per capita energy intake from snacks in all age groups in 2003–06, with a subsequent decrease between 2006 and 2014, however this was only significant in the 6–11 and 12–18 y age groups (P<0.01) (Table 1). Overall the same trend was seen in the number of snacks per day and the calorie intake per snacker.
Table 1.
Number of snacks consumed per day, percentage snackers in the population and energy consumed per snacking occasion by US children from the 1977–78, 1989–91, 1994–98, 2003–06 and 2011–14 surveys by age group
| 1977–78 | 1989–91 | 1994–98 | 2003–06 | 2011–14 | |
|---|---|---|---|---|---|
| Age 2–5 y | |||||
| Snacks, n/d | 1.2 (.04) | 1.4 (.08) | 2.3 (.05) | 3.0 (.08) | 3.0 (.08)1 |
| Per capita mean intake from snacks, kcal | 195 (7.8) | 243 (15) | 378 (8.4) | 441 (12) | 439 (12.3)1 |
| % snackers | 65 (1.7) | 72 (2.9) | 89 (1.1) | 96 (0.6) | 95 (0.8)1 |
| Per capita mean intake from snacks, kcal (snackers only) | 302 (7.4) | 339 (15.9) | 427 (6.6) | 460 (11.5) | 461 (12.5)1,2 |
| Age 6–11 y | |||||
| Snacks, n/d | 1.0 (.03) | 1.1 (.07) | 1.8 (.05) | 2.7 (.07) | 2.5 (.06)1,3 |
| Per capita mean intake from snacks, kcal | 237 (7.3) | 281 (19.7) | 424 (14.6) | 538 (19.7) | 469 (13.8)1,2 |
| % snackers | 63 (1.3) | 66 (2.4) | 83 (1.2) | 93 (0.9) | 92 (1.1)1 |
| Per capita mean intake from snacks, kcal (snackers only) | 373 (9.1) | 424 (23.1) | 512 (13.1) | 579 (20.6) | 511 (13.3)1,b |
| Age 12–18 y | |||||
| Snacks, n/d | 1.0 (.03) | 1.1 (.05) | 1.7 (.06) | 2.3 (.05) | 2.1 (.06)1,3 |
| Per capita mean intake from snacks, kcal | 307 (9.3) | 336 (21.6) | 513 (27) | 576 (18.8) | 461 (17.1)1,2 |
| % snackers | 61 (1.4) | 61 (2.2) | 78 (1.7) | 88 (.9) | 83 (1.5)1,2 |
| Per capita mean intake from snacks, kcal (snackers only) | 508 (10.1) | 549 (27.2) | 657 (23.7) | 651 (19.6) | 555 (16.5)1,2 |
| Age 2–18 y | |||||
| Snacks, n/d | 1.1 (.03) | 1.2 (.05) | 1.9 (.04) | 2.6 (.05) | 2.4 (.05)1,3 |
| Per capita mean intake from snacks, kcal | 260 (6.8) | 292 (13) | 448 (14) | 532 (8.4) | 459 (9.8)1,2 |
| % snackers | 62 (1.3) | 66 (1.9) | 82 (1.1) | 92 (0.5) | 89 (0.9)1,2 |
| Per capita mean intake from snacks, kcal (snackers only) | 418 (6.9) | 444 (13.6) | 544 (12.1) | 580 (8.7) | 516 (9.2)1 |
Different from 1977–78, p<0.01;
Different from 2003–06, p<0.01;
Different from 2003–06, p<0.05
Note: Data come from the 1977–1978 Nationwide Food Consumption Survey (NFCS); the 1989–1991 Continuing Survey of Food Intake by Individuals (CSFII), the 1994–1996 CSFII, tthe 1997–1998 CSFII, NHANES 2003–2004, NHANES 2005–2006, NHANES 2011–12 and NHANES 2013–14. Results have been weighted to be nationally representative. Results are presented as mean (SE).
Overall food and beverage shifts
For food and beverages the trend was an overall increase in mean calorie intake from 1977 to 2006 with a subsequent decrease observed from 2006–2014 (Figure 1a. and 1b.). This decrease was greater for beverages, with the same trend also observed specifically in consumption of SSBs. 12–18 year olds had the highest intake of SSBs than all other age groups, however the long term trend was a lower intake in 2014 than in 1977 (Figure 2b.). Sports drinks, coffee and tea and fruit and vegetable juices were the only beverage categories in which an increase in calorie intake from 1977 to 2014 was observed. Salty snack intake more than doubled from 1977–2014 overall, and was more than three times higher in 2–5 year olds in 2014 than in 1977 (Figure 2a.). Calorie intake from desserts and sweets snacks remained stable overall during the study period, with a slight peak in 1994–98 (Figure 2c.). Grain-based desserts were the number one source of total calorie intake in each survey year (Supplementary Table 3), with around half of the top food sources of snacks deriving from “less healthy” food items such as salty snacks, desserts and sweets in each year. Calorie intake from healthier food sources such as fruit and vegetables, meat and fish, and dairy products remained relatively stable over the study period.
Figure 1. Per capita intake (kcal) from snacks - beverage and food sources for US children.
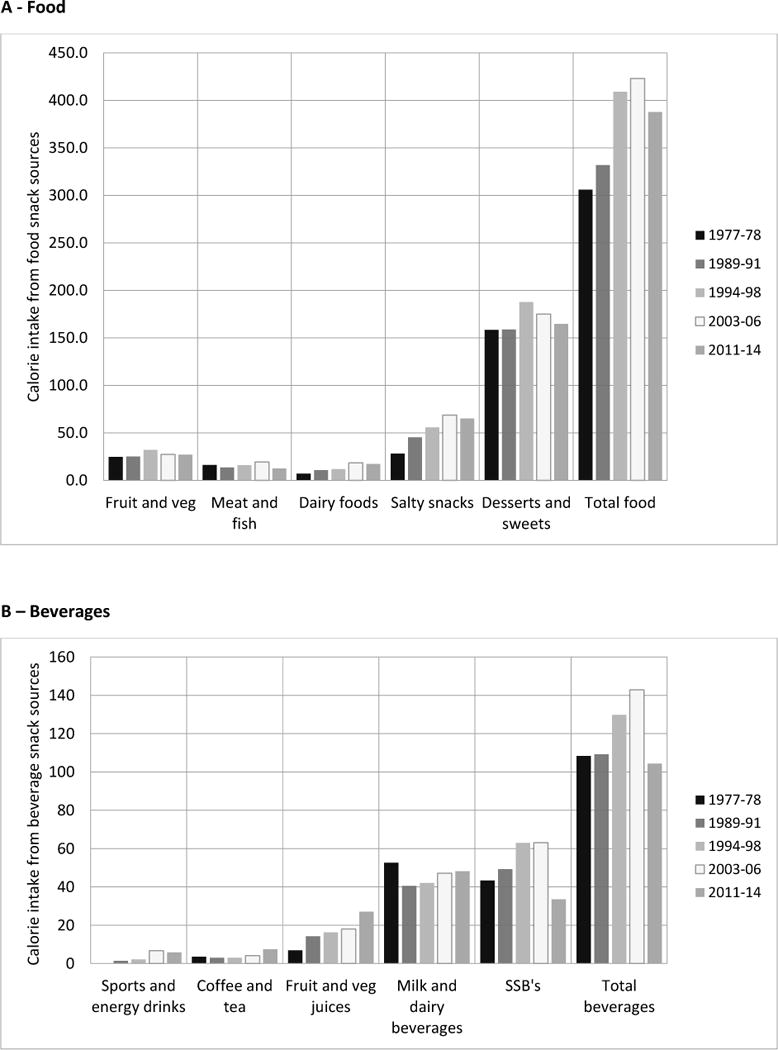
a. Food b. Beverages
Figure 2. Kilocalories per capita per day from snacks by age group for US children.
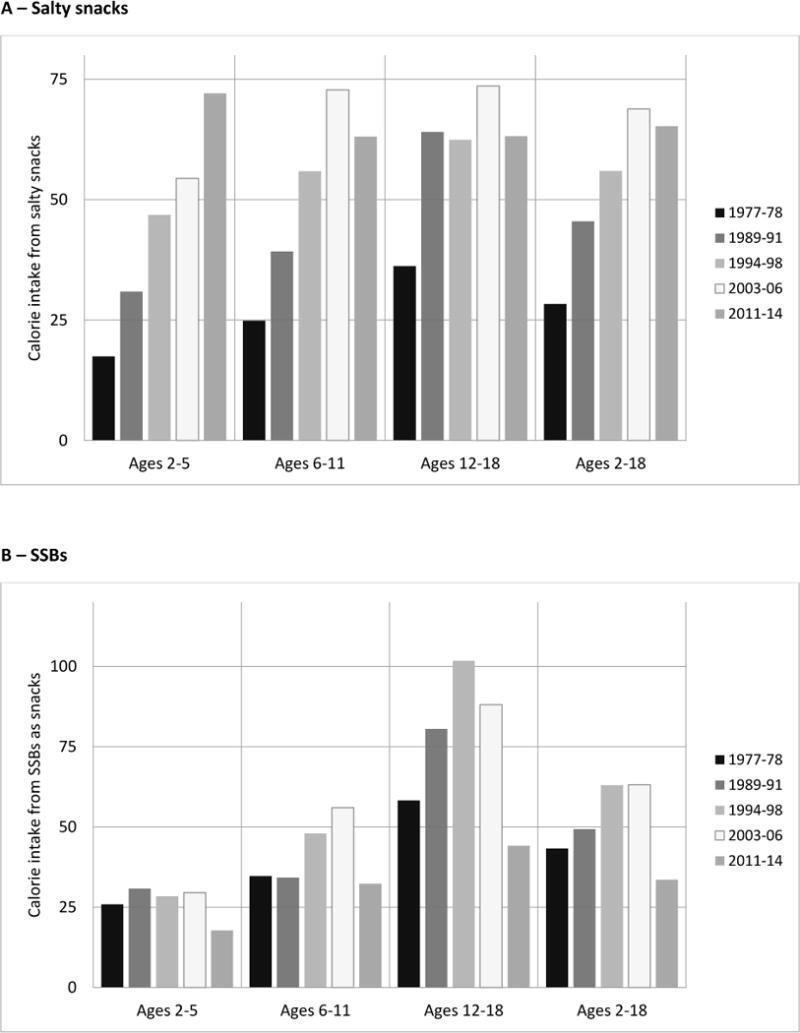
a. Salty snacks b. Sugar-sweetened beverages c. Desserts and sweets
Socio-demographic differences in snacking in US children
Trends by race/ethnicity
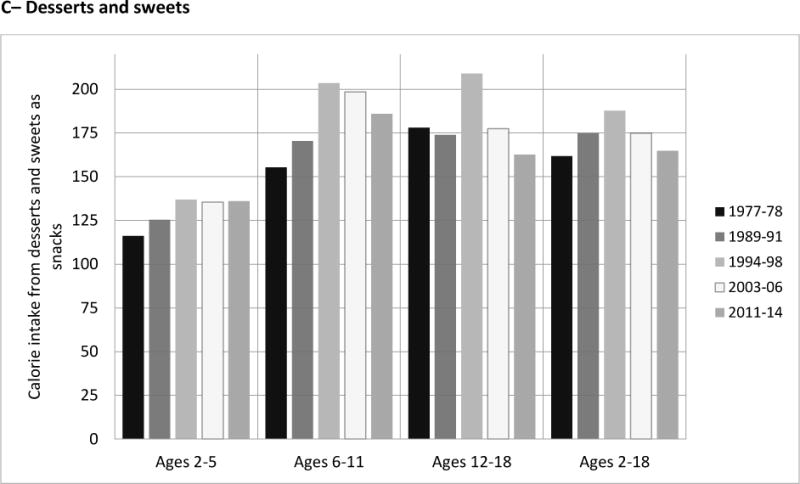
All race-ethnic groups showed an increase in calories per capita per day between 1977 and 2006 and a decline in calories per capita per day between 2003–06 and 2011–14 (Supplementary Table 2). These increases were significant between 1977–78 to 2003–06 and 2003–06 to 2011–14 (P<0.05 for all). However, although in 1977–78, 1989–91 and 1994–98 Hispanics and Non-Hispanic Blacks had a significantly lower calorie intake from snacks compared to Non-Hispanic Whites (P<0.01 Supplementary Table 3), in the most recent survey years there was no discernible difference in per capita intake from snacks between race-ethnic groups. Across all race-ethnic groups there was an increase in energy intake deriving from beverages from 1977 to 2006 and a subsequent decrease between 2006 and 2014, resulting in not much overall change in per capita calorie intake from beverages as a snack between 1977 and 2014 (Figures 3a and 3b). Although Non-Hispanic Blacks had the largest increase in calories per capita per day deriving from foods as a snack from 1977 to 2014 (180kcal per day increase), they also had the lowest mean per capita intake of snacks as a beverage despite having a higher intake of SSBs (Supplementary Figure 1a.).
Figure 3. Kilocalories per capita per day from foods and beverages by ethnicity for US children.
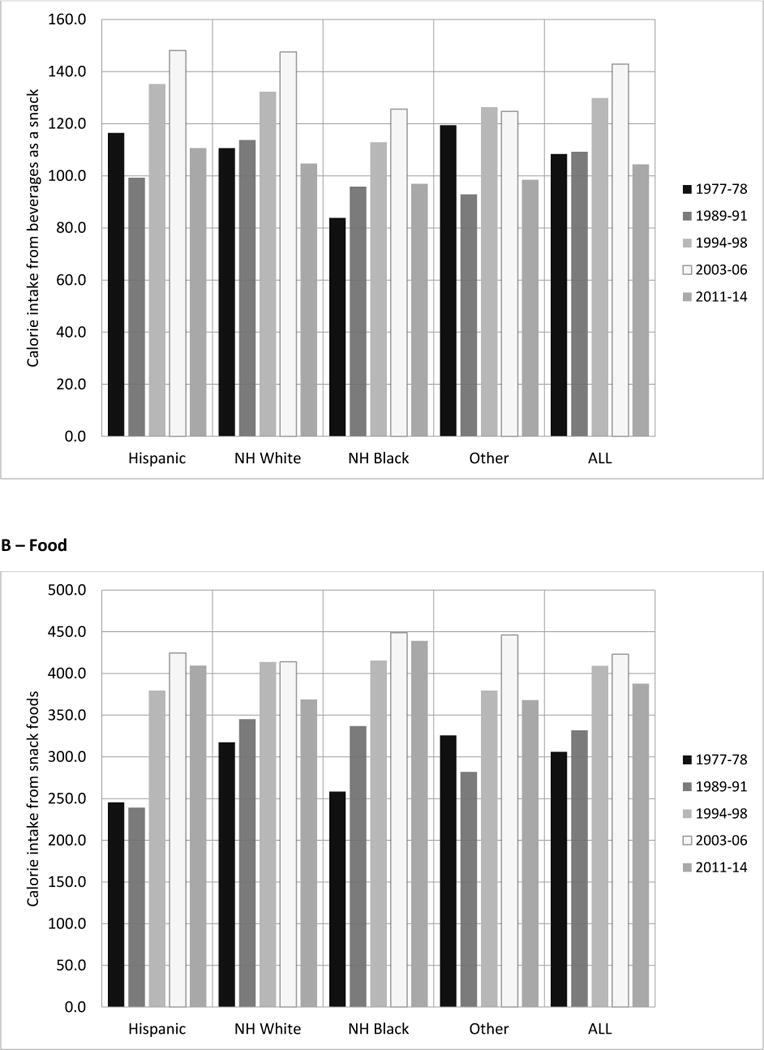
a. Beverages b. Foods
The major food and beverage drivers of the trends
Overall, per capita calorie intake from SSBs as a snack increased from 1977–78 to 2003–06 and then decreased from 2003–06 to 2011–2014 (Supplementary Figure 1a). There was an increase in intake from 1977–2006 then a large decrease from 2006–2014 (around 30 calories per capita per day decrease in last 10 years), with Non-Hispanic Blacks having the highest calorie intake from SSBs in 2011–14. A large increase in salty snack per capita intake from 1977–2014 was observed in all race-ethnic groups and overall (Supplementary Figure 1b). The largest increase was seen in Hispanics with more than a four-fold increase, and a doubling in Non-Hispanic Whites and a tripling in Non-Hispanic Blacks. Intake of desserts and sweets remained stable overall from 1977–2014 overall however Hispanic and Non-Hispanic Blacks had an increase of around 50% over the study period (Supplementary Figure 1c).
Trends by income level, gender and education
All income and education groups and both gender groups showed an increase in calories per capita per day between 1977–78 and 2003–06 and a decline in calories per capita per day between 2003–06 and 2011–14 (Supplementary Table 2). The largest increase in per capita intake from snacks was seen in the lowest poverty level (<185% NPL) and the lowest education group (less than high school) with a more than 100% increase in calorie intake from snacks from 1977–2014. In each survey year males had a higher per capita intake of snacks.
Discussion
To the knowledge of the authors, this is the first study to examine both short and long-term trends in snacking behaviors of US children and adolescents in specific age, race-ethnic, gender, household education and income groups. We found that in all socio-demographic groups there was a significant increase in the per capita energy intake deriving from snacks from 1977 to 2014 (P<0.01) but in the most recent period following 2006 we found a systematic decline in all socio-demographic subgroups. Of these subgroups, children and adolescents with the lowest household education level, those in the Non-Hispanic Black race-ethnic group, and those in the lowest household income group had the largest increase in calorie intake from snacks over the 37 years.
Overall calorie intake from snacking among children remains high at 459 kcal per day, with the bulk coming from foods generally considered unhealthy such as desserts, sweets, SSBs and salty snacks. These sources combined contributed to 54% of energy from snack foods in 2014. This aligns with research showing that the US population overall has a high intake of foods high in added sugar and solid fats16 and with a recent short-term study in US children from 2003–10 which showed that although total calorie intake from discretionary foods had declined in recent years, that intake was still unacceptably high.10 The fact that we did not see a corresponding increase in non-discretionary food sources such as fruit and vegetables, meat and fish or dairy, further shows that it is unlikely that “healthy snacking” is compensating in any way for “unhealthy snacking” behaviors. In fact, our data showed that in all years, grain-based desserts were the number one source of energy from snacking and more than half of the top 10 sources of calories from snacks were from less healthy food sources (Supplementary Table 3). This is comparable with the total diet of these same US children and adolescents which has been previously reported.17,18
As expected from national trends19 we observed an increase in SSB intake from 1977 to 2006 and a decrease from 2006 to 2014 resulting in a lower intake of SSBs as snacks for US children and adolescents in 2014 than in 1977. This highlights the importance of examining long-term trends in snacking behaviour, with the majority of studies to date looking at shorter time periods and observing only either an increase (research examining trends from 1989–2006)9 or a decrease (research examining trends from 2003–2010)10 in SSB intake. We observed that although Non-Hispanic Blacks had the lowest overall calorie intake from beverages as snacks in 2014, they had the highest calorie intake from SSBs and showed an increase in SSB consumption from 1977 to 2014, despite overall trends showing a decrease in SSB consumption. One US study found that non-Hispanic black households had increased consumption of SSBs compared to other race-ethnic groups.20 Our finding that Non-Hispanic Blacks have had the largest increase in intake from SSBs as snacks from 1977 to 2014 is cause for concern considering there has been a significant decrease in the exposure to children of advertizing of SSBs, and many schools now have reduced access to SSBs.21
Salty snack intake more than doubled from 1977 to 2014 overall in US children and adolescents (P<0.01) and long-term intake trends for desserts and sweets showed no difference between 1977 and 2014. Despite these overall trends, Non-Hispanic Blacks had a 50% increase in intake over the 37 years in desserts and sweets and the highest intake of salty snacks in 2014 of all race-ethnic groups. This is in contrast to prior research which found intake of salty snacks over the past 10 years has remained stable in children and adolescents10 and another study which found Non-Hispanic Whites had the highest intake of salty snacks.22 However, our findings are supported by research from other countries that show that a large proportion of energy intake from snacks derives from less healthy foods,16,23 and that disparities exist between race-ethnic and education groups.24–27
Our analysis had some limitations. First, collected dietary data has clear limitations in underreporting and that these limitations can vary by age, race-ethnicity and body weight.28 Second are potential differences in diet methodologies. Similar to other studies looking at US trends in dietary intake, different methodologies were used across different years. The introduction of the multiple pass method in the 1990s may have resulted in additional snacks identified during that period, however our finding of a recent decrease in snacking gives us faith that this did not affect our overall findings. Although data presented are based on the first day 24-h recall from all surveys, the recall methodology was modified to include multiple passes through the list of foods and beverages in the CSFII 1994–96, 98 and to include the USDA’s automated collection system in the 2002 and later NHANES surveys. Validation studies in adults have shown these newer methods improved completeness of the recall,29 although it is important to note that 24hr recall in itself is prone to underreporting. Despite each survey being linked to the same FNDDS USDA food composition table there may have been changes in nutrient composition based on different assay techniques which we cannot account for.24,25 We attempted to address this by using the UNC-CH food grouping system used in previous studies that allows foods in each survey year to be linked to one consistent food group to offset changes in food composition table numbering and ensure high quality estimates of nutrient values over time.
This study examined long-term and short-term trends in the number of snacking occasions, foods consumed, and total contribution of snacks to energy intake across various socio-demographic groups of US children and adolescents. We found a long-term increase in overall snacking behaviour but a declining trend to 2011–14 from a peak intake of 2003–06. We also examined critical differences in snacking behavior between race-ethnic, household education, gender and income groups and showed important disparities in Non-Hispanic Blacks as well as differences between the lower household education and income groups. Importantly we found that the major foods consumed at these snacking events (SSBs, desserts and sweets and salty snacks) are exactly the foods recommended for reduced intake by US dietary guidelines. Future research should examine how snacking is contributing to intake of other risk-associated nutrients such as added sugars, sodium and saturated fat. Finally, it is important to consider that factors such as social and family aspects, cultural practices, television and computer screen time, physical activity levels and cognitive factors can all affect a child’s intake of snack foods. Results from this study should be considered as one piece of the puzzle that can help guide policy recommendations related to the levels of adverse nutrients in the food supply.
Supplementary Material
What is already known about this subject
Snacking is contributing to an increased calorie intake of US children and adolescents
A large proportion of snacks derive from less healthy foods such as salty snacks, desserts and sweets
What this study adds
This is the first study to examine both recent and long term trends in snacking behaviors of US children and adolescents by specific age, gender, race/ethnic, household education and income groups
Results indicate that disparities exist in snacking behavior in the US between various race-ethnic, household education, gender and income groups. Importantly, disparities in Non-Hispanic Blacks as well as differences between the lower education and income children and others were observed.
Acknowledgments
We thank the Robert Wood Johnson Foundation (Grants 67506, 68793,70017, 71837) and the National Institutes of Health (R01DK098072, DK56350, and CPC P2C HD050924) for financial support. E Dunford is supported mainly by a National Health and Medical Research Council of Australia Early Career Fellowship (APP1088673) with supplemental support from R01DK098072. We also wish to thank Dr. Phil Bardsley for exceptional assistance with the data management and Ms. Denise Ammons for graphics support.
Footnotes
Conflict of interest statement: No authors have conflict of interests of any type with respect to this manuscript.
Author contributions: E Dunford and B Popkin designed and conducted this research. E Dunford analysed data and wrote paper. E Dunford and B Popkin had joint primary responsibility for final content.
References
- 1.Centers for Disease Control and Prevention. Childhood Obesity Facts. https://www.cdc.gov/healthyschools/obesity/facts.htm. Accessed July 28, 2016.
- 2.Freedman DS, Mei Z, Srinivasan SR, Berenson GS, Dietz WH. Cardiovascular risk factors and excess adiposity among overweight children and adolescents: the Bogalusa Heart Study. J Pediatr. 2007;150(1):12–7 e2. doi: 10.1016/j.jpeds.2006.08.042. [DOI] [PubMed] [Google Scholar]
- 3.Freedman DS, Khan LK, Serdula MK, Dietz WH, Srinivasan SR, Berenson GS. The relation of childhood BMI to adult adiposity: the Bogalusa Heart Study. Pediatrics. 2005;115(1):22–7. doi: 10.1542/peds.2004-0220. [DOI] [PubMed] [Google Scholar]
- 4.McCrory MA, Suen VM, Roberts SB. Biobehavioral influences on energy intake and adult weight gain. J Nutr. 2002;132(12):3830S–3834S. doi: 10.1093/jn/132.12.3830S. [DOI] [PubMed] [Google Scholar]
- 5.Duffey KJ, Popkin BM. Energy Density, Portion Size, and Eating Occasions: Contributions to Increased Energy Intake in the United States, 1977–2006. PLoS Med. 2011;8(6):e1001050. doi: 10.1371/journal.pmed.1001050. [DOI] [PMC free article] [PubMed] [Google Scholar]
- 6.Hess JM, Jonnalagadda SS, Slavin JL. What Is a Snack, Why Do We Snack, and How Can We Choose Better Snacks? A Review of the Definitions of Snacking, Motivations to Snack, Contributions to Dietary Intake, and Recommendations for Improvement. Adv Nutr. 2016;7(3):466–75. doi: 10.3945/an.115.009571. [DOI] [PMC free article] [PubMed] [Google Scholar]
- 7.Ogden CL, Carroll MD, Lawman HG, Fryar CD, Kruszon-Moran D, Kit BK, Flegal KM. Trends in Obesity Prevalence Among Children and Adolescents in the United States, 1988–1994 Through 2013–2014. JAMA. 2016;315(21):2292–9. doi: 10.1001/jama.2016.6361. [DOI] [PMC free article] [PubMed] [Google Scholar]
- 8.Ng SW, Slining MM, Popkin BM. Turning point for US diets? Recessionary effects or behavioral shifts in foods purchased and consumed. Am J Clin Nutr. 2014;99(3):609–16. doi: 10.3945/ajcn.113.072892. [DOI] [PMC free article] [PubMed] [Google Scholar]
- 9.Piernas C, Popkin BM. Trends in snacking among U.S. children. Health Aff (Millwood) 2010;29(3):398–404. doi: 10.1377/hlthaff.2009.0666. [DOI] [PMC free article] [PubMed] [Google Scholar]
- 10.Bleich SN, Wolfson JA. Trends in SSBs and snack consumption among children by age, body weight, and race/ethnicity. Obesity (Silver Spring) 2015;23(5):1039–46. doi: 10.1002/oby.21050. [DOI] [PMC free article] [PubMed] [Google Scholar]
- 11.Piernas C, Popkin BM. Snacking increased among U.S. adults between 1977 and 2006. J Nutr. 2010;140(2):325–32. doi: 10.3945/jn.109.112763. [DOI] [PMC free article] [PubMed] [Google Scholar]
- 12.Perloff BP, Rizek RL, Haytowitz DB, Reid PR. Dietary intake methodology. II. USDA’s Nutrient Data Base for Nationwide Dietary Intake Surveys. J Nutr. 1990;120(Suppl 11):1530–4. doi: 10.1093/jn/120.suppl_11.1530. [DOI] [PubMed] [Google Scholar]
- 13.National Health and Nutrition Examination Survey. MEC In-Person Dietary Interviewers Procedures Manual. https://www.cdc.gov/nchs/data/nhanes/nhanes_03_04/DIETARY_MEC.pdf. Accessed 4 August 2016.
- 14.Duffey KJ, Gordon-Larsen P, Ayala GX, Popkin BM. Birthplace is associated with more adverse dietary profiles for US-born than for foreign-born Latino adults. J Nutr. 2008;138(12):2428–35. doi: 10.3945/jn.108.097105. [DOI] [PubMed] [Google Scholar]
- 15.Popkin BM, Haines PS, Siega-riz AM. Dietary patterns and trends in the United States: the UNC-CH approach. Appetite. 1999;32(1):8–14. doi: 10.1006/appe.1998.0190. [DOI] [PubMed] [Google Scholar]
- 16.Reedy J, Krebs-Smith SM. Dietary sources of energy, solid fats, and added sugars among children and adolescents in the United States. J Am Diet Assoc. 2010;110(10):1477–84. doi: 10.1016/j.jada.2010.07.010. [DOI] [PMC free article] [PubMed] [Google Scholar]
- 17.Slining MM, Popkin BM. Trends in intakes and sources of solid fats and added sugars among U.S. children and adolescents: 1994–2010. Pediatr Obes. 2013;8(4):307–24. doi: 10.1111/j.2047-6310.2013.00156.x. [DOI] [PMC free article] [PubMed] [Google Scholar]
- 18.Slining MM, Mathias KC, Popkin BM. Trends in Food and Beverage Sources among US Children and Adolescents: 1989–2010. J Acad Nutr Diet. 2013;113(12):1683–94. doi: 10.1016/j.jand.2013.06.001. [DOI] [PMC free article] [PubMed] [Google Scholar]
- 19.Ng SW, Slining MM, Popkin BM. Turning point for US diets? Recessionary effects or behavioral shifts in foods purchased and consumed. Am J Clin Nutr. 2014;99(3):609–16. doi: 10.3945/ajcn.113.072892. [DOI] [PMC free article] [PubMed] [Google Scholar]
- 20.Piernas C, Ng SW, Popkin B. Trends in purchases and intake of foods and beverages containing caloric and low-calorie sweeteners over the last decade in the United States. Pediatr Obes. 2013;8(4):294–306. doi: 10.1111/j.2047-6310.2013.00153.x. [DOI] [PMC free article] [PubMed] [Google Scholar]
- 21.Powell LM, Schermbeck RM, Szczypka G, Chaloupka FJ, Braunschweig CL. Trends in the nutritional content of television food advertisements seen by children in the United States: analyses by age, food categories, and companies. Arch Pediatr Adolesc Med. 2011;165(12):1078–86. doi: 10.1001/archpediatrics.2011.131. [DOI] [PMC free article] [PubMed] [Google Scholar]
- 22.Masters MA, Stanek Krogstrand KL, Eskridge KM, Albrecht JA. Race/ethnicity and income in relation to the home food environment in US youth aged 6 to 19 years. J Acad Nutr Diet. 2014;114(10):1533–43. doi: 10.1016/j.jand.2014.04.023. [DOI] [PubMed] [Google Scholar]
- 23.Mercille G, Receveur O, Macaulay AC. Are snacking patterns associated with risk of overweight among Kahnawake schoolchildren? Public Health Nutr. 2010;13(2):163–71. doi: 10.1017/S1368980009990711. [DOI] [PubMed] [Google Scholar]
- 24.Howe LD, Ellison-Loschmann L, Pearce N, Douwes J, Jeffreys M, Firestone R. Ethnic differences in risk factors for obesity in New Zealand infants. J Epidemiol Community Health. 2015;69(6):516–22. doi: 10.1136/jech-2014-204464. [DOI] [PMC free article] [PubMed] [Google Scholar]
- 25.Durao C, Severo M, Oliveira A, Moreira P, Guerra A, Barros H, et al. Association of maternal characteristics and behaviours with 4-year-old children’s dietary patterns. Matern Child Nutr. 2016 doi: 10.1111/mcn.12278. [Epub ahead of print] [DOI] [PMC free article] [PubMed] [Google Scholar]
- 26.Gates A, Skinner K, Gates M. The diets of school-aged Aboriginal youths in Canada: a systematic review of the literature. J Hum Nutr Diet. 2015;28(3):246–61. doi: 10.1111/jhn.12246. [DOI] [PubMed] [Google Scholar]
- 27.Fernandez-Alvira JM, Bornhorst C, Bammann K, Gwozdz W, Krogh V, Hebestreit A, et al. Prospective associations between socio-economic status and dietary patterns in European children: the Identification and Prevention of Dietary- and Lifestyle-induced Health Effects in Children and Infants (IDEFICS) Study. Br J Nutr. 2015;113(3):517–25. doi: 10.1017/S0007114514003663. [DOI] [PubMed] [Google Scholar]
- 28.Livingstone MB, Robson PJ, Wallace JM. Issues in dietary intake assessment of children and adolescents. Br J Nutr. 2004;92(Suppl 2):S213–22. doi: 10.1079/bjn20041169. [DOI] [PubMed] [Google Scholar]
- 29.Moshfegh AJ, Rhodes DG, Baer DJ, Murayi T, Clemens JC, Rumpler WV, et al. The US Department of Agriculture Automated Multiple-Pass Method reduces bias in the collection of energy intakes. Am J Clin Nutr. 2008;88(2):324–32. doi: 10.1093/ajcn/88.2.324. [DOI] [PubMed] [Google Scholar]
Associated Data
This section collects any data citations, data availability statements, or supplementary materials included in this article.